First-Principles Study of Chlorine Adsorption on Clean Al(111)
Jun Yamashita
1,*and Norio Nunomura
21Yazaki Research and Technology Center, Susono 410–1194, Japan
2Information Technology Center, University of Toyama, Toyama 930–8555, Japan
A density functional theory model is used to investigate the structural, thermodynamic, and electronic properties of chlorine atoms ad-sorbed on the Al(111) surface within a supercell approach for chlorine coverages of 1/4, 1/3, 1/2, 3/4, and 1 ML. The largest bond length is observed for an atop, hcp, and fcc mixed structure at 3/4 ML coverage. Analysis of the adsorption free energy reveals that the chlorine cover-age of 3/4 ML is the most thermodynamically stable over the widest range of chlorine chemical potential and that the covercover-age of 1 ML is thermodynamically unstable. The electronic charge density distributions, the change in the work function induced by adsorption, and the cor-responding electrostatic dipole moment are also calculated. Atop-site adsorption is shown to induce charge transfer and the formation of a di-pole structure for low coverage, and the charge transfer decreases with increasing coverage. Surface bonding is investigated using the pro-jected density of states, and aluminum and chlorine 3p-orbitals are shown to be important in Al-Cl bond formation.
[doi:10.2320/matertrans.M2017101]
(Received March 23, 2017; Accepted July 13, 2017; Published September 25, 2017)
Keywords: density functional theory, halogen adsorption, corrosion, electrochemical structure
1. Introduction
Aluminum and its alloys are increasingly being used in electric, fuel-cell-powered, and hybrid vehicles to achieve vehicle weight reduction. The replacement of traditional steel and cast iron with lighter aluminum in the automotive industry is one of the most important factors contributing to the reduction of environmental pollution and the improve-ment of fuel economy. Aluminum generally exhibits good corrosion resistance through the formation of a passive ox-ide film. However, the surface is prone to localized corrosion in corrosive environments such as those found in vehicles. Pitting or crevice corrosion is caused by the presence of ag-gressive anions, such as Br−, Cl−, I−, SO
42−, and NO3−, in the electrolyte on the metal surface1–6). Chloride ions play a crucial role in the atmospheric corrosion of metals because they are found in seawater, tap water, and airborne salts. Cl−
in the electrolyte can penetrate the natural oxide film, and the localized breakdown of the oxide film induces the direct reaction of Cl− with the bare aluminum surface7–9). Fissures in the passive film are repaired immediately; however, repas-sivation is hindered by the presence of a sufficient amount of Cl−, which subsequently leads to pit nucleation9). The neces-sary Cl− condition to maintain pit activity on an aluminum
surface is known to be 3 mol/dm3,4). Hence, obtaining in-sight into the atomic-scale features that control the chemis-try at the electrolyte/aluminum interface is important to un-derstand pit propagation.
Density functional theory (DFT)10) is a powerful theoreti-cal tool for elucidating the chemitheoreti-cal nature of materials on the atomic scale. Many DFT investigations have been pub-lished on the surface structure of halogen adsorption onto a metal surface, especially for noble metals11–25). Optimization of the adsorption structures of Cl−, Br−, and I− as well as
their harmonic vibration frequencies on the (100) surface of Cu, Ag, and Au have been studied by Ignaczak and Gomes17). In addition, the energetics, electronic structure,
and vibrational frequency of F, Cl, Br, and I adsorption onto the (111) surface of Cu, Rh, Pd, Ag, Pt, and Au have been investigated by Migani and Illas19). The chlorine adsorption and desorption mechanisms and the electronic structure of chlorine on Cu(111) have been investigated in detail by Peljhan and Kokalj24) and by Pavlova et al.21) Few studies have focused on chlorine adsorption onto an aluminum sur-face. Mitsutake et al. showed that the dissociative adsorption of Cl2 molecules on Al(100) proceeds spontaneously with its bonding being ionic26). The Cl2/Al(111) etching reaction se-quence under ultrahigh vacuum was investigated by Grassman et al.27) They revealed that atop-site adsorption preferentially occurs for chlorine atoms, which is different from the adsorption typically observed on a noble metal sur-face. Although it has been presumed that the calculation should account for the effect of the electric potential of the solution at the solution/metal interface because pitting or crevice corrosion is an electrochemical phenomenon, Koper observed identical trends for the binding energies of halides and halogen atoms adsorbing onto metal surfaces18). In the light of this result, Zhu and Wang examined the structures of F−, Cl−, Br−, and I− adsorbing onto 29 types of metal
sur-faces in an integrated manner22). In clarifying the pitting process of aluminum, Liu et al. noted that the repassivation process is hindered by the existence of Cl− because of the
stronger interaction of Al-Cl than Al-O28).
Here, we present a DFT study using the projector aug-mented wave (PAW) periodic slab model on the behavior of chlorine chemisorption on clean Al(111), which mimics chlorine adsorption onto an aluminum surface at the bottom of pitting corrosion. Our calculations are performed using the framework previously discussed by Peljhan and Kokalj24).
2. Computational Details
First-principles DFT calculations based on the frozen-core PAW method of Blöchl29) were performed using the Quantum-ESPRESSO package30). All the molecular * Corresponding author, E-mail: [email protected]
graphics were produced using the XCrySDen31) graphical package. Electron exchange and correlation were described by the Perdew̶Burke̶Ernzerhof (PBE)32) form of the generalized gradient approximation (GGA). For the plane wave set, a kinetic energy cutoff of 47 Ry was used (400 Ry for the charge-density cutoff), and the Methfessel-Paxton33) smearing size was fixed at 0.02 Ry. The k-point meshes in the Brillouin zone integration were sampled by 12 × 12 × 1 for the (1 × 1) surface supercell and 9 × 9 × 1 for the (√3× √3)R30◦ and (2 × 2) surface supercells. The Al(111) surface was modeled by a supercell with a periodic slab con-sisting of five-layers of aluminum separated by a vacuum layer of approximately 20 Å thickness, which reduced the interactions between repeating slabs. A five layer slab was used in the calculations, in which the three topmost layers were allowed to relax while the bottom two layers were fixed at their bulk positions.
In our calculations, the surface energy σ for N atoms is given by
σ= 1
2(Eslab−NEbulk), (1) where Eslab is the total energy of the slab and Ebulk is the ref-erence total energy per atom of the bulk crystal. The factor of 1/2 accounts for the two surfaces in the slab supercell.
The bond length Eb is defined as the difference between the total energy of the adsorbate/substrate system ECl/slab and the total energy of the isolated adsorbate ECl or substrate
Eslab for their ground-state structures:
Eb= 1
n[ECl/slab−(Eslab+nECl)], (2) where n is the number of adsorbed chlorine atoms per super-cell at each coverage Θ. The total energy of an isolated chlo-rine atom is obtained from a spin-polarized calculation using a larger supercell to account for the chlorine atom having one unpaired electron in its outermost electronic shell. The average chemisorption energy for the dissociative adsorption of chlorine is
Echem=1n ECl/slab− Eslab+n2ECl2 , (3)
where ECl2 is the total energy of an isolated Cl2 molecule and its bond strength E0 is given by E0 = ECl2 − 2ECl. The to-tal chemisorption energy per unit area is
εtotchem= 1
A ECl/slab− Eslab+ n
2ECl2 = n
AEchem, (4) where A is the surface area spanned by the supercell.
The charge transfer between the adsorbate and substrate is characterized by the differential charge density distribution. The differential charge density Δρ is defined as
∆ρ=(ρCl/slab−ρslab)− n
i=1
ρCli, (5)
where ρCl/slab, ρslab, and ρCli are the charge densities for the Cl/Al(111) slab, clean Al(111) slab, and Cli of the ith iso-lated adsorbate, respectively.
The difference in the charge density induced by adsorp-tion on the surface creates an electrostatic dipole moment.
The dipole moment is related to the change in the adsorbate- induced work function by the Helmholtz equation
µ= A0∆Φ
4πΘ , (6)
where ΔΦ and μ are in units of hartree and e bohr, respec-tively, Θ is the adsorbate coverage in terms of ML, and A0 is the area of the (1 × 1) surface unit cell. A positive value of μ represents an inward-pointing dipole from the negative ad-sorbate to the positive surface.
3. Results and Discussion
3.1 Basic properties: Al bulk and Al(111)
Before constructing the model of adsorption on the sur-face slab, the basic properties of the aluminum and the chlo-rine molecule were calculated. For the isolated Cl2 mole-cule, the bond length and bond strength were determined to be 2.00 Å and 2.88 eV, respectively, without the zeropoint energy correction. These values are consistent with the val-ues of 2.05 Å and 2.69 eV previously obtained by GGA cal-culations24) and the experimental values of 1.99 Å and 2.48 eV, respectively34). For bulk aluminum, the lattice con-stant a0 is 4.04 Å and the bulk modulus B0 is 79.2 GPa, cal-culated using the Birch̶Murnaghan equation of state35). The corresponding experimental values at room temperature are a0 = 4.02 Å34) and B0 = 81.3 GPa36). These values are suitable for constructing adsorption models. Surface relax-ation is characterized as the change Δdij in the spacing be-tween layers i and j versus the equilibrium layer spacing a0/√3 for the (111) surface. The surface relaxation of layers
Δd12 and Δd23 of the clean Al(111), the work function Φ, and the surface energy σ were calculated. A comparison of these results with experimental and previously calculated values from the literature is presented in Table 1.
3.2 Energetic properties: Adsorption onto Al(111) Structure optimizations with a Cl atom on Al(111) were performed for Θ of 1/4, 1/3, 1/2, 3/4, and 1 ML. For the calculation, Cl atoms were placed 3 Å above Al(111) and the loci of Cl atoms and the three uppermost Al layers were fully optimized (Fig. 1(a)). The Cl adsorption sites on the surface are shown in Fig. 1(b). The calculated bond length
case of 1/2 ML, which had a hexagonal void structure. It is reasonable to expect that negatively charged atoms avoid each other because of lateral repulsion due to electrostatic interaction. For the optimized Cl atom in the case of 1/4 ML, the largest displacement in the normal direction of the surface was observed for an Al atom bonded by the Cl
atom at a distance dAl = 0.41 Å above the terrace plane. This value is in excellent agreement with the previous value cal-culated by Grassman et al.38) The overlayer structure will be discussed in detail in section 3.3 in terms of the electronic properties.
Echem defined in eq. (3) as a function of coverage is shown Table 1 Comparison between relaxation calculation values and experimental values of geometrical and mechanical parameters of Cl2 molecule, Al bulk,
and Al(111). ∆d12 is the relaxation of the surface layer and ∆d23 is that of the subsurface layer.
Property Present study Previous GGA cal. Experiment
Cl2 molecule
l0 (Å) 2.00 2.0024) 1.99
E0 (eV) 2.88 2.8524) 2.48
Al bulk
a0 (Å) 4.04 4.04248), 4.05116) 4.0249)
B0 (GPa) 79.2 70.548) 81.349)
Al(111) 1×1 √3×√3R30◦ 2×2
Φ (eV) 4.13 4.10 4.11 4.08548), 4.0722), 4.0416) 4.2622), 4.4850), 4.2451)
σ (J/m2) 0.86 0.90 0.88 0.7550) 1.1651), 1.1452)
∆d12 (%) +1.06 +1.59 +1.21 +1.0648) +1.7±0.353)
∆d23 (%) −0.22 −0.37 −0.26 −1.5348) +0.5±0.753)
Fig. 1 (a) Initial slab model in which Cl atom is placed 3 Å above the Al(111) surface. (b) On-surface high-symmetry sites for Cl adsorption on Al(111). (c)–(g) Optimized surface structure for chlorine for coverages of 1/4, 1/3, 1/2, 3/4, and 1 ML, respectively. All the surface structures have centered hon-eycomb structures except for that for 1/2 ML, which has a honhon-eycomb void structure.
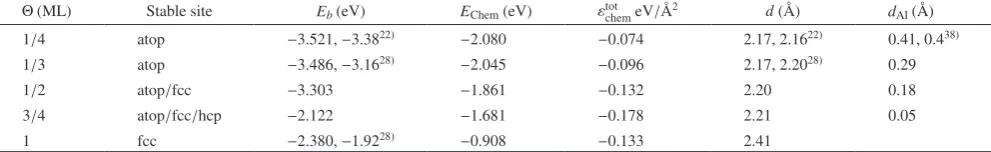
Table 2 Calculated structures, bond length in eV, chemisorption energy in eV, and total chemisorption energy in eV/Å2 for on-surface chlorine atom as a
function of coverage Θ. d is the nearest-neighbor distance between the adsorbate and the surface aluminum in Å. dAl is the lift of the adsorbate above the terrace plane in Å.
Θ (ML) Stable site Eb (eV) EChem (eV) εtotchem eV/Å2 d (Å) dAl (Å)
1/4 atop −3.521, −3.3822) −2.080 −0.074 2.17, 2.1622) 0.41, 0.438)
1/3 atop −3.486, −3.1628) −2.045 −0.096 2.17, 2.2028) 0.29
1/2 atop/fcc −3.303 −1.861 −0.132 2.20 0.18
3/4 atop/fcc/hcp −2.122 −1.681 −0.178 2.21 0.05
[image:3.595.46.553.96.260.2] [image:3.595.108.494.292.509.2] [image:3.595.52.548.608.684.2]in Fig. 2. The magnitude of the energy decreases with in-creasing Θ. All the calculated structures are exothermic (i.e.,
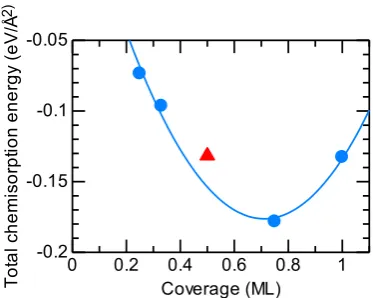
Eb < 0). The highest coverage state, 1 ML, is obtained for the (1 × 1) unit cell and is confirmed by breaking the sym-metry using the (2 × 2) unit cell calculation, giving the same structure and Echem. To discuss the stability for the higher- coverage cases, the total chemisorption energy normalized by the surface unit area εtotchem, defined by eq. (4), is plotted in Fig. 3 as a function of Θ. In this plot, εtotchem for 1/2 and 1 ML coverages have similar values (−0.063 and −0.064 eV/Å2, respectively), whereas the exothermicity of εtotchem increases up to 3/4 ML coverage and decreases thereafter. Being near the bottom of the fitting curve of the second-order polyno-mial (blue curve), the 3/4 ML configuration is the most ther-modynamically stable. To determine the effect of the tem-perature and chlorine partial pressure on the chemisorption energy, the adsorption free energy is discussed in terms of
ab initio atomistic thermodynamics39,40). The surface free energy γ is defined as
γ=G−(nAlµAl+nµCl)
A , (7)
where G is the Gibbs free energy of the system, nAl is the number of aluminum atoms in the supercell, and μAl and μCl are the chemical potentials of aluminum and chlorine atoms,
respectively. The adsorption free energy γads is defined as the difference between the surface free energy before and after adsorption, γads = γCl/Slab − γSlab. Then, the difference, ΔG, before and after the adsorption of the Gibbs free energy can be approximated as the difference between the total energies before and after adsorption by
∆G=GCl/Slab−GSlab≈ECl/Slab−ESlab, (8)
where GCl/Slab and GSlab are the Gibbs energies of the ad-sorption system and Al(111), respectively. We set the zero reference state of μCl to be the total energy of chlorine in an isolated molecule, i.e., μCl = ECl2 /2 = 0. Hence, the adsorp-tion free energy γads without substitutional adsorption is given by
γads= n(Echem−µCl)
A , (9)
[image:4.595.75.262.399.535.2]where Echem is the chemisorption energy defined in eq. (3). Figure 4 shows γads as a function of the chemical potential of the chlorine atom μCl. The thermodynamically most stable structure at a given μCl corresponds to the lowest-energy line γads. The horizontal dotted line at γads = 0 meV/Å2 corre-sponds to a clean aluminum surface. The clean Al(111) is the most stable structure for μCl < −2.08 eV, which is where the blue line and horizontal dotted line intersect. Upon in-creasing the chemical potential of chlorine in the range of −2.08 eV < μCl < −1.94 eV, the 1/4 ML configuration (blue line) becomes more stable than the clean surface. Thereafter, for −1.93 eV < μCl < −1.49 eV, the 1/3 ML configuration (green line) is the most stable structure, and for −1.49 eV < μCl < −1.32 eV, the 1/2 ML configuration (orange line) is the most stable structure. Over a wide range of μCl > −1.32 eV, the 3/4 ML configuration (red line) is the most fa-vorable structure. This characteristic does not appear when the 1 ML configuration (gray line) has the lowest value for the entire region; therefore, the chlorine coverage of 1 ML is thermodynamically unstable.
Fig. 2 Average chemisorption energy, Echem in eV, of Cl adsorbed on
Al(111) as a function of coverage.
Fig. 3 Total chemisorption energy per surface unit area, εtotchem in eV/Å2,
of on-surface Cl as a function of coverage. The red triangle represents the structure for 1/2 ML coverage. The blue curve represents the second- order polynomial fitting.
Fig. 4 Adsorption free energy γads for Cl/Al(111) structures as a function
of Cl chemical potential μCl. The horizontal dotted line at γads = 0 eV/Å2
[image:4.595.323.529.575.734.2] [image:4.595.75.262.593.742.2]3.3 Electronic properties: Adsorption onto Al(111) surface
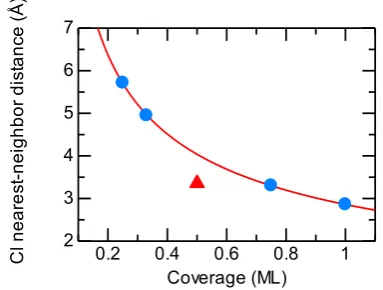
To investigate the electronic stability of the adsorption layer, the Löwdin population41), the change in the work function ΔΦ, and the corresponding dipole moment μ were calculated. Halogen atoms are negatively charged when ad-sorbing on a transition metal surface because of the differ-ence in electronegativity. The differdiffer-ence in electronegativity between Cl and Al is 1.55 on the Pauling scale, which is considerably larger than that between Cl and Cu (1.62) or between Cl and Au (0.62)34). The charge on the adsorbate was determined by Löwdin population analysis as imple-mented in the Quantum ESPRESSO package30). The calcu-lated net charges ˜qA of atoms as a function of Θ are listed in Table 3 and plotted in Fig. 6(a). The net charge decreases linearly with increasing coverage except for the 1/2 ML case (red triangles). The charge in the 1/2 ML structure is smaller than that expected from the interpolation line (blue line). This finding is attributed to differences in the surface structure of atoms and the nearest-neighbor distance dnn. The Cl atoms have the maximum lateral distance dnn because of their repulsive interaction. However, all the overlayer struc-tures except for that in the 1/2 ML case have a centered honeycomb structure (Fig. (c), (d), (f), (g)) with the maxi-mum lateral nearest-neighbor Cl-Cl distance. The 1/2 ML structure has a honeycomb void structure (Fig. (e)). The dif-ference in dnn causes a difference in the strength of the lat-eral repulsive interaction. In genlat-eral, the maximum near-est-neighbor distance of atoms at the high-symmetry points on an fcc(111) surface is given by
dmax nn (Θ)=
dAl
√
Θ, (10)
where dAl is the bulk Al-Al nearest-neighbor distance (2.86 Å). Figure 5 shows the actual nearest-neighbor dis-tance between atoms dnn and the maximum nearest-neighbor distance between atoms dmax
nn (red curve) as a function of coverage. dnn for 1/2 ML with a honeycomb void structure is smaller than the optimal distance dmax
nn given by eq. (10). Therefore, the Cl charge on the 1/2 ML structure flows back to the Al surface because of the stronger repulsive interac-tion, and the charge for the case of 1/2 ML in Fig. 6 (red tri-angle) is smaller than that expected from the interpolation line. To explain the dependence of the net Cl charge on the coverage with consideration of differences in the overlayer structure such that adsorbates are not located at high-sym-metry points, Peljhan and Kokalj introduced the effective Cl-Cl nn distance as the geometric mean of the actual and ideal Cl-Cl nn distances at a given coverage24) as
deff
nn = dnndmaxnn . (11) The Löwdin net charge of Cl as a function of deff
nn is pre-sented in Fig. 6(b). This plot consistently shows that the 1/2 and 3/4 ML cases have different charges in Fig. 6(a) despite having almost the same nn distance, as observed in Fig. 5. In addition, the decreasing Löwdin net charge of Cl as a func-tion of deff
nn indicates the weakening of the Al-Cl bond with the increase in the Al-Cl distance, as can be seen in Table 2.
To further clarify the surface electronic structure, we cal-culated the change in the work function and the correspond-ing electrostatic dipole moment induced by the adsorption of chlorine atoms. The adsorption of electronegative adsor-bates, such as halogens, onto metal surfaces has been ob-served to change in the work function20,22,42–46). Roman et
al. proposed a mechanism that can explain the change in the work function and the formation of an electrostatic dipole moment when a halogen is adsorbed on a metal substrate16). They considered the adsorption of F, Cl, Br, and I into vari-ous metal surfaces. However, the discussion on Cl adsorp-tion onto aluminum was for an fcc site and the coverage was fixed at 1/9 ML. The adsorption-induced change in the work function and the surface electrostatic dipole moment are re-lated by the Helmholtz equation presented in eq. (6). The calculated change in the work function ΔΦ and the corre-sponding dipole moment μ as a function of coverage are listed in Table 3 and plotted in Fig. 7(a) and 7(b), respec-tively. The obtained value for the 1/4 ML structure, 1.071 eV, is in good agreement with the value of 1.08 eV ex-perimentally measured by Bermudez and Glass47). As ob-served in Fig. 7(a), the largest ΔΦ is observed for the 1/3 ML configuration; thereafter, the value decreases with increasing coverage when Θ > 1/3. In Fig. 7(b), the corre-sponding induced dipole moment μ is plotted as a function of the effective distance deff
nn defined in eq. (11). Figure 7(b) explains the dependence of the magnitude of the dipole mo-ment on the Cl-Cl lateral distance. According to the discus-sion of the mechanism of the change in the work function upon halogen adsorption by Roman et al., a different change in the work function is caused by the charge transfer associ-ated with ionic interactions16). To visualize the analysis of
Table 3 Calculated change in work function, Löwdin net charge, and di-pole moment in atomic units, e bohr/Cl atom; 1e bohr = 2.54 D.
Θ (ML) ∆Φ (eV) ˜qA μ (a.u.)
1/4 1.071 0.403 0.177
1/3 1.131 0.386 0.142
1/2 0.804 0.309 0.066
3/4 0.646 0.275 0.036
1 0.033 0.246 0.001
[image:5.595.330.522.589.734.2] [image:5.595.45.289.712.787.2]Fig. 7 (a) Adsorption-induced change in work function as a function of coverage and (b) electrostatic dipole moment for chlorine atom on Al(111) as a function of the effective distance deff
nn fitted with second-order polynomial (black curve). The data for the 1/2 ML structure (honeycomb void structure) are indicated by red triangles.
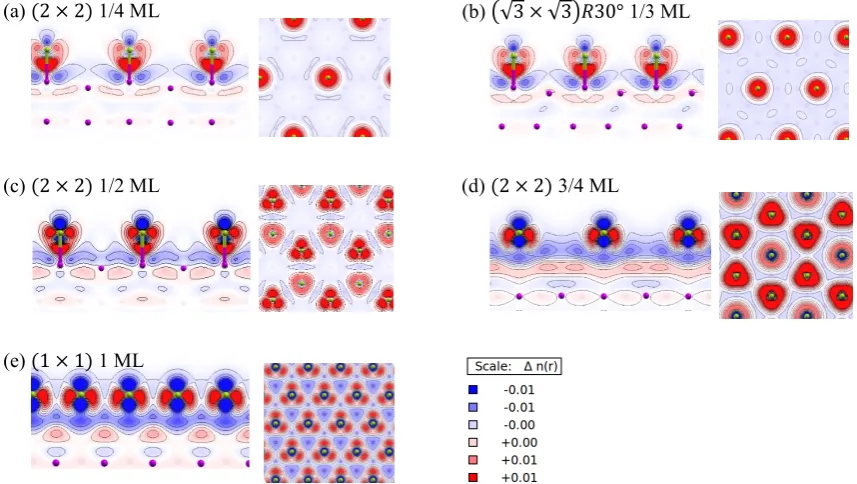
Fig. 8 Side- and top-view contour plots of the differential charge density Δρ for coverages of 1/4, 1/3, 1/2, 3/4, and 1 ML. The blue regions represent charge-deficit regions, while the red regions represent charge-excess regions; hence, charge flows from the blue to red regions. The contours are drawn on a linear scale from −0.01 to 0.01 e/a3
0 with an increment of 0.004 e/a30, where a0 is the Bohr radius. The top-view contour plane is (a) 1.088 Å, (b)
1.084 Å, (c) 0.926 Å, (d) 0.896 Å, and (e) 0.878 Å below the chlorine atom (i.e., the distance between the centers of surface aluminum and chlorine at-oms in the surface normal direction).
Fig. 6 (a) Löwdin net charge (in units of electron) of Cl atom adsorbed on Al(111) as a function of coverage. The 1/2 ML coverage (red triangles) was not included in the fit (blue line). (b) Löwdin net charge on Cl atom as a function of effective Cl-Cl nearest-neighbor distance deff
[image:6.595.107.492.70.222.2] [image:6.595.106.493.279.424.2] [image:6.595.83.512.491.733.2]this electron transfer, two-dimensional contour plots of the differential charge density Δρ, defined in eq. (5), for each coverage are presented in Fig. 8. Figure 8(a) and 8(b) reveal that charge accumulates below the atom and is polarized in the Al-Cl bond direction, constituting a dipole structure. Figure 8(c) demonstrates that the region with excess charge gradually moves up to the side of the atoms but is still polar-ized in the Al-Cl bond direction at 1/2 ML. Upon further in-creasing the coverage, the repulsion among the negatively charged Cl atoms becomes stronger. At 3/4 and 1 ML, the Al-Cl bond is weakened by the reduced charge transfer be-tween the adsorbate and substrate, resulting in depolariza-tion. The top-view plots imply that the well-separated charge distribution for the lower coverage is distorted, with the for-mation of lateral Cl-Cl bonds with the accumulation of charge between Cl neighbors with increasing coverage. At low coverages (1/4 and 1/3 ML), the chlorine atom is fur-ther away from the aluminum surface than for the ofur-ther cov-erages. This structure has a larger electric dipole moment, which leads to a larger change in the work function.
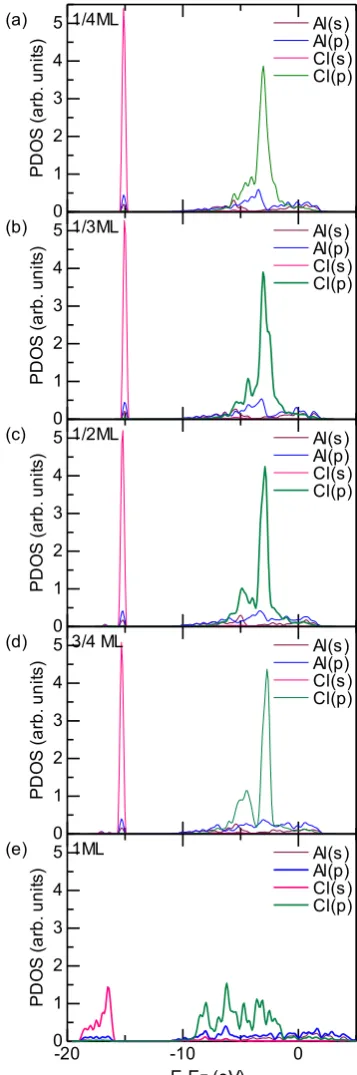
The projected density of states (PDOS) was calculated to analyze the structure of the bond between aluminum and chlorine atoms. Figure 9 presents the PDOS profile for the optimized position of Cl and surface Al in the nearest-neigh-bor position for coverages from 1/4 to 1 ML, where zero en-ergy is the Fermi level. In Fig. 9(a)–9(d), the Al-3p orbital exhibits slight hybridization with Cl-3s below −15 eV. In contrast, in Fig. 9(e), this hybridization peak is broadened and weakened. In addition, the intensity of the main peak of Al-3p at −3 eV for lower coverages decreases, whereas it split into several peaks for 1 ML. The neighboring peak of the main peak of Cl-3p near −4 eV, which represents Cl-3pz, interacts with Al-3p; the intensity of this peak decreases with increasing coverage and is extremely small for 3/4 ML and hardly observed for 1 ML. For the coverage of 1 ML, the PDOS changes completely, and there is no hybridization except for that around −7 eV. These results demonstrate that the Cl-3p orbital significantly contributes to Al-Cl bond for-mation. In addition, the coverage of 1 ML, for which all the peaks are broadened and less hybridization occurs, is elec-tronically unstable.
4. Conclusions
A systematic DFT study of atomic chlorine adsorption on the surface of Al(111) using the PAW potential was con-ducted, and the energetics and the thermodynamic and elec-tronic properties for chlorine coverages of 1/4, 1/3, 1/2, 3/4 and 1 ML were evaluated. Calculation of the chemisorption energies revealed that chlorine atoms most strongly adsorb at a mixed configuration of atop, hcp, and fcc sites for the 3/4 ML configuration. Analysis of the adsorption free en-ergy of the chlorine chemical potential demonstrated that the coverage of the 3/4 ML structure was the most thermody-namically stable over the widest range (−1.3 eV < μCl) of chemical potential. This analysis also implied that clean Al(111) is the most stable structure at chemical potentials below −2.1 eV. Furthermore, coverage of 1 ML was shown to be thermodynamically unstable because 1 ML does not take a stable phase in the entire range of the chemical
potential. Analysis of the electronic structure revealed that a large electrostatic dipole moment is observed at low cover-ages (1/4 and 1/3 ML) because of the large charge transfer from aluminum to chlorine atoms. The charge transfer de-creases upon increasing the effective distance between ad-sorbates. Analysis of the differential charge density and PDOS plots revealed that the surface chlorine 3p states mainly contribute to bond formation with aluminum and electronic instability in the case of 1 ML coverage. Our work is limited to a system in which water is absent at zero Fig. 9 Projected density of states (PDOS) profiles for chlorine atom for
[image:7.595.335.514.70.609.2]temperature, and the effect of water on chlorine adsorption deserves attention in future studies.
Acknowledgements
J.Y. would like to thank T. Kosako, T. Wakita, T. Suzuki, and S. Tanaka of the Yazaki Research and Technology Center for technical support and discussions.
REFERENCES
1) E. McCafferty: Introduction to Corrosion Science Springer New York, 2010.
2) G.S. Frankel: J. Electrochem. Soc. 145 (1998) 2186–2198.
3) Z. Szklarska-Smialowska: Corros. Sci. 41 (1999) 1743–1767.
4) M.C. Reboul, T.J. Warner, H. Mayer and B. Barouk: Corros. Rev. 15 (2011) 471–496.
5) E. McCafferty: Corros. Sci. 45 (2003) 1421–1438.
6) P.M. Natishan and W.E. O Grady: J. Electrochem. Soc. 161 (2014) C421–C432.
7) D. de la Fuente, E. Otero-Huerta and M. Morcillo: Corros. Sci. 49
(2007) 3134–3148.
8) R.T. Foley: Corrosion 42 (1986) 277–288.
9) P. Marcus, V. Maurice and H.H. Strehblow: Corros. Sci. 50 (2008) 2698–2704.
10) W. Kohn and L.J. Sham: Phys. Rev. 140 (1965) A1133–A1138.
11) T.A. Baker, C.M. Friend and E. Kaxiras: J. Am. Chem. Soc. 130
(2008) 3720–3721.
12) N.H. de Leeuw, C.J. Nelson, C.R.A. Catlow, P. Sautet, and W. Dong:
Phys. Rev. B 69 (2004) 045419.
13) K. Doll and N.M. Harrison: Chem. Phys. Lett. 317 (2000) 282–289.
14) P. Gava, A. Kokalj, S. De Gironcoli and S. Baroni: Phys. Rev. B 78
(2008) 165419.
15) F. Gossenberger, T. Roman and A. Groß: Surf. Sci. 631 (2015) 17–22.
16) T. Roman, F. Gossenberger, K. Forster-Tonigold and A. Groß: Phys. Chem. Chem. Phys. 16 (2014) 13630–13634.
17) A. Ignaczak and J.A.N.F. Gomes: J. Electroanal. Chem. 420 (1997) 71–78.
18) M.T.M. Koper: Mod. Asp. Electrochem 36 (2003) 51–130. 19) A. Migani and F. Illas: J. Phys. Chem. B 110 (2006) 11894–11906.
20) I.A. Pašti and S.V. Mentus: Electrochim. Acta 55 (2010) 1995–2003.
21) T.V. Pavlova, B.V. Andryushechkin and G.M. Zhidomirov: J. Phys. Chem. C 120 (2016) 2829–2836.
22) Q. Zhu and S.-Q. Wang: J. Electrochem. Soc. 163 (2016) H796–808.
23) H. Sellers, E.M. Patrito and P.P. Olivera: Surf. Sci. 356 (1996) 222–232.
24) S. Peljhan and A. Kokalj: J. Phys. Chem. C 113 (2009) 14363–14376.
25) B. Shen, Z. Fang, K. Fan and J. Deng: Surf. Sci. 459 (2000) 206–212.
26) K. Mitsutake, J. Yamauchi, A. Sakai and M. Tsukada: Surf. Sci. 324
(1995) 106–112.
27) T.J. Grassman, S.R. Bishop and A.C. Kummel: Microelectron. Eng.
86 (2009) 249–258.
28) M. Liu, Y. Jin, C. Zhang, C. Leygraf and L. Wen: Appl. Surf. Sci. 357
(2015) 2028–2038.
29) P.E. Blöchl: Phys. Rev. B 50 (1994) 17953–17979.
30) P. Giannozzi, et al.: J. Phys. Condens. Matter 21 (2009) 395502.
31) A. Kokalj: Comput. Mater. Sci. 28 (2003) 155–168.
32) J.P. Perdew, K. Burke and M. Ernzerhof: Phys. Rev. Lett. 77 (1996) 3865–3868.
33) M. Methfessel and A.T. Paxton: Phys. Rev. B 40 (1989) 3616–3621.
34) National Astronomical Observatory of Japan. Chronological Science Tables, Maruzen Publishing Co. Ltd. Tokyo 2015.
35) F.D. Murnaghan: Proc. Natl. Acad. Sci. USA 30 (1944) 244–247.
36) CRC Handbook of Chemistry and Physics 79th ed. CRC Press FL 1998.
37) I.A. Pašti, N.M. Gavrilov and S.V. Mentus: J. Serb. Chem. Soc. 78
(2013) 1763–1773.
38) T.J. Grassman, G.C. Poon and A.C. Kummel: J. Chem. Phys. 121
(2004) 9018–9030.
39) W.-X. Li, C. Stampfl and M. Scheffler: Phys. Rev. B 68 (2003) 165412-1–15.
40) K. Reuter and M. Scheffler: Phys. Rev. B 65 (2001) 035406.
41) P. Löwdin: J. Chem. Phys. 18 (1950) 365–375.
42) W. Erley: Surf. Sci. 114 (1982) 47–64.
43) E. Bertel, K. Schwaha and F.P. Netzer: Surf. Sci. 83 (1979) 439–452.
44) S.K. Jo and J.M. White: Surf. Sci. 261 (1992) 111–117.
45) P.S. Bagus, C. Wőll and A. Wieckowski: Surf. Sci. 603 (2009) 273–283.
46) A. Migani, C. Sousa and F. Illas: Surf. Sci. 574 (2005) 297–305.
47) V.M. Bermudez and A.S. Glass: J. Vac. Sci. Technol. A 7 (1989) 1961–1966.
48) A. Kiejna and B. Lundqvist: Phys. Rev. B 63 (2001) 085405.
49) R. Gaudoin and W. Foulkes: Phys. Rev. B 66 (2002) 052104.
50) J.L.F. Da Silva C. Stampfl and M. Scheffler: Surf. Sci. 600 (2006) 703–715.
51) F. R. De Boer, R. Boom, W. C. M. Mattens, A. R. Miedema, and A. K. Niessen: Cohesion in Metals North Holland Amsterdam 1989, pp.672. 52) W.R. Tyson and W.A. Miller: Surf. Sci. 62 (1977) 267–276.