Titanium Mesh/Rod Joined by Pulse Electric Current Sintering:
Effect of Heating Rate
Airu Wang and Osamu Ohashi
*Graduate School of Science and Technology, Niigata University, Niigata 950-2181, Japan
Ti mesh was bonded to a solid titanium substrate using pulse electric current sintering (PECS) to fabricate a porous surface of potential use in a titanium implant. We investigated the effect of heating rate on the bonding strength, deformation of the mesh and deformation of the entire construct. During the PECS process, there was a temperature gradient between the Ti mesh and Ti rod, which increased with increasing the heating rate. At the same bonding temperature, a rapidly heated mesh showed a higher temperature than when heating was slow, and caused the
strongest bonding. [doi:10.2320/matertrans.47.2348]
(Received May 8, 2006; Accepted July 5, 2006; Published September 15, 2006)
Keywords: Pulse electric current sintering, heating rate, titanium, tensile strength
1. Introduction
Titanium (Ti) and Titanium alloys are recognized as useful implantation materials because of their excellent mechanical properties, high specific strength, and high corrosion resist-ance. Recently, having a porous surface on a titanium or titanium-alloy implant has attracted increasing interest from numerous researchers. This is because the interconnected pores of such a surface can provide a framework for bone growth into the matrix of the implant, and thus anchor the prosthesis to the surrounding bone, preventing loosening of implants.1–3) The most commonly used porous surface is a sintered bead coating, consisting of one to four layers of Ti or Ti-6Al-4V beads attached to the surface of a Ti-6Al-4V implant.4–6) However, the process of sintering beads to a
substrate requires heating at about 1400C for 5–7 h, which
causes microstructural changes in titanium alloys that affect their mechanical properties.6)In addition, the precise control
of pore size and porosity is difficult.7) Therefore, a new
fabrication process is needed.
Pulse electric current sintering/bonding (PECS or PECB), also called spark plasma sintering or plasma activated sintering,8–14)has received much attention in the recent years because of its many advantages compared with other sintering/bonding methods such as the hot pressing and hot isostatic pressing (HIP) processes. In the PECS process, a pulse of electric current flows directly through the sintered/ bonded materials, yielding a very high heating efficiency. In general, a heating rate up to 1500C/min can be achieved
using the PECS process, compared with50{80C/min for the
conventional sintering/bonding process.
In the PECS process, the heating rate is an important factor. It affects the properties of the sintered/bonded specimens. Conflicting reports have been published on the effects of heating rate on grain growth in ceramic powders treated with PECS.15–17)However, no reports have appeared
on the effect of heating rate on the sintering/bonding of metallic materials with PECS.
In the present study, Ti mesh was bonded to a solid titanium substrate with PECS to produce a porous surface on
titanium. We investigated the effect of heating rate on the bonding strength, the deformation of the mesh and deforma-tion of the entire structure. The results are discussed with reference to the mesh temperature and the temperature distribution around the joints.
2. Experimental Methods
Commercially pure (CP) Ti mesh (grade 1, TAMAGAWA Co., Ltd, Niigata, Japan) was used in the present study. The hole size was650320mm2, thickness 93mm, and porosity 61.8%.
In order to evaluate the bonding strength, joints were prepared with one piece of Ti mesh sandwiched between two Ti rods. The CP Ti rod (grade 2) used was machined into a cylinder with a diameter of 12 mm and a length of 30 mm. The surface to be bonded was machined on a lathe. Bonding experiments were performed using a PECS apparatus (PLASMAN, SSAlloy Co., Ltd, Hiroshima, Japan). Figure 1 shows a schematic diagram of the PECS apparatus (Fig. 1(a)) and a magnified photo of the Ti mesh (Fig. 1(b)).
In the PECS process, the mesh/rod sandwich was placed between two electrodes with graphite spacers, and electrical current was applied to heat the constructions. This PECS apparatus can supply pulsed electric current and direct
(a) (b)
Fig. 1 (a) Schematic diagram of the PECS apparatus; (b) magnified photo
of Ti mesh.
*Corresponding author, E-mail: [email protected]
[image:1.595.304.550.601.757.2]current. In this study, the latter was used. Bonding experi-ments were carried out in a vacuum of103Pa. Top and
bottom electrodes were pressed together at 0.9 MPa, which is the minimum for this PECS apparatus. The control temper-ature (TC) was measured by a K-type thermocouple, welded
to the Ti rod about 1 mm from the Ti mesh. The heating from room temperature to bonding temperature (TB) was
con-trolled by the applied electrical current. Heating rates of 60, 200, 400, 950 and 1500C/min were used. Holding time at TB was 0 min, that is to say, when the control temperature
reachedTB, the electric current was shut off, and the unit was
rapidly cooled down. Bonding temperatures of 750C and
800C were chosen. Figure 2 shows the temperature histories for heating rates of 60 and 950C/min at 750C, measured by the K-type thermocouple.
Deformation of the joints was quantified by eq. (1) using the length of the constructions (Ti mesh sandwiched between two Ti rods) before (L1) and after bonding (L2).
ðL1L2Þ
L1
100% ð1Þ
Deformation of the mesh was quantified by eq. (2) using the thickness of the mesh before (h1) and after bonding (h2).
ðh1h2Þ
h1
100% ð2Þ
Tensile tests of the bonded joints were carried out using an autograph tester (Model AG-250KNG; Shimadzu Corpora-tion, Kyoto, Japan) at room temperature. A tensile velocity of 1 mm/min was used. Tensile strength was calculated using the measured tensile load and the area of a circle with a diameter of 12 mm.
The fractured surfaces and cross sections were examined with a scanning electron microscope (SEM) (Model JSM-6400, JEOL, Tokyo, Japan) and an optical microscope (Model ECLIPSEM600P, Nikon, Tokyo, Japan).
3. Results
In order to investigate the effect of heating rate on bonding strength, joints were made from an assembly of one piece of Ti mesh sandwiched between two Ti rods, bonded at temperatures of 750 and 800C with heating rates of 60, 200, 400, 950 and 1500C/min. Figure 3 shows the relationship
between tensile strength and heating rate for bonding temperatures of 750 and 800C. It can be seen that tensile
strength increases with increasing heating rate at each bonding temperature except for 60C/min. For the joint
made at 750C with a heating rate of 950C/min, the tensile
strength was about 99.4 MPa. The porosity of the Ti mesh used was 61.8%. The contact area between the Ti mesh and the Ti rod was 38.2% of the area of a circle with a diameter of 12 mm. Thus the bonding strength between Ti mesh and Ti rod was about 302.4 MPa when the Ti-mesh did not deform, equal to the strength of the parent material, which is
240{340MPa for grade 1 Ti. For joints made with a heating rate of 1500C/min, the calculated bonding strength between
Ti mesh and Ti rod seems to exceed the strength of the parent material.
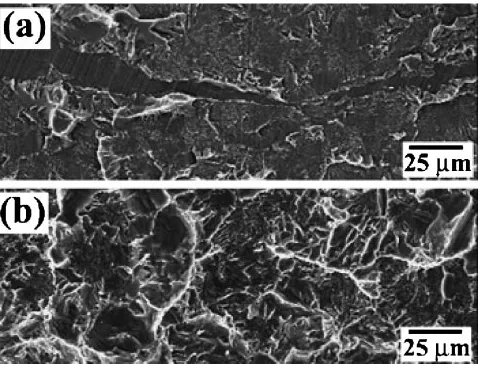
After tensile testing, microstructures on the fractured surface of joints were examined with SEM. Figures 4(a) and (b) show SEM micrographs of the fractured surfaces of the bonded joints heated at 60 and 1500C/min. The
1500C/min surface exhibits dimples over the entire
frac-tured surface; the ductile fracture characteristic of strong bonding. The same fracture type was also observed on 950C/min surfaces. However, large dimples were few on
0 200 400 600 800 1000 1200
0 500 1000 1500 2000
Temperature,
T /
°
C
Time, t / s
Heating Rate: 950°C/ min
Heating Rate: 60°C/ min Ti-Mesh-Ti
Bonding Conditions: 0.9 MPa, 0 min, 750°C, in Vacuum
Fig. 2 Temperature histories with heating rates of 60 and 950C/min.
0 100 200 300 400
0 500 1000 1500 2000
750°C
800°C
Tensile Strength,
Heating Rate, R H
Ti-Mesh-Ti
Bonding Conditions: 0.9 MPa, 0 min, in Vacuum Bonding Temperature
/ (°C/min)
σ
/
MPa
Fig. 3 Relationship between tensile strength of joints and heating rate for
bonding temperatures of 750 and 800C.
Fig. 4 SEM micrographs of the fractured surface at 750C. (a) The
fractured surface of a 60C/min joint; (b) The fractured surface of a
[image:2.595.57.282.73.219.2] [image:2.595.313.542.74.222.2] [image:2.595.308.548.270.453.2]the fractured 60C/min surface, appearing only in localized
areas. This indicates that strong bonding did not occur. For the fractured surfaces with 200 and 400C/min, the similar
fracture type with that of 60C/min was observed.
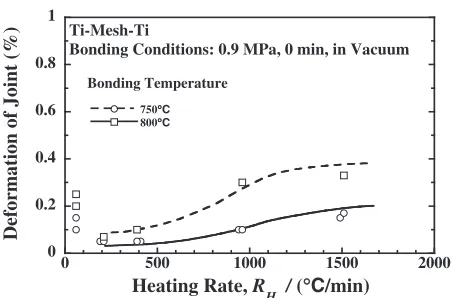
To investigate the effect of heating rate on joint deforma-tion, the constructions length was measured before and after bonding. The deformation of the bonded joints was eval-uated. Figure 5 shows the dependence of joint deformation on the heating rate for both bonding temperatures. Joint deformation increased with increasing heating rate, except for the condition in 60C/min. It is noteworthy that the
deformation of the bonded joints heated at 1500C/min is
matched only by those heated at 60C/min. This suggests
that it is possible to achieve strong bonding without large deformation by using the PECS process with a rapid heating rate.
To study the effect of heating rate on deformation of the mesh, cross-sections of the 750C bonded joints were
examined with an optical microscope. Figures 6(a) and (b) show optical micrographs of cross sections of the bonded joints heated at 60 and 1500C/min, respectively. The thickness of the original mesh was 93mm. In the 60C/min case, the mesh thickness after bonding was 86mm, showing
little deformation. In contrast, the mesh thickness decreased to 61mm in the 1500C/min case, a 34% deformation.
Figure 7 shows the dependence of mesh deformation on heating rate for a bonding temperature of 750C. The mesh
deformation increases with increasing heating rate. For the bonded joints heated at 1500C/min, the mesh deformation
was twice as large as at 60C/min. On the other hand, at a
bonding temperature of 750C the deformation of the bonded
joints heated at 1500C/min was similar only to that of the
60C/min case (Fig. 5). Deformation was notably less in the
joints heated at 200C/min than in the 60C/min joints. Comparing Fig. 5 with Fig. 7, it is clear that both mesh and rod deformed significantly at a heating rate of 60C/min. In
contrast, when the heating rate was over 200C/min the
deformation of the bonded joints was concentrated in the mesh and the rod deformation was small.
4. Discussion
To determine why the mesh deformation increased with increasing heating rate, and why the joint deformation was concentrated in the mesh by rapid heating, we investigated the mesh temperature and the temperature distribution along the joints.
First, the mesh temperature (TM) was measured, using a
K-type thermocouple welded at the mesh position (see Fig. 8). Actually measuring the temperature of the mesh was difficult because the diameter of the terminal of the thermocouple was about 300mm, while the mesh thickness was only about 93mm. Thus the measured temperature was the average temperature of the area around the mesh, though we call it the mesh temperature.
Simultaneously, a control temperature (TC) was also
measured by a K-type thermocouple welded to the rod about 1 mm away from the Ti mesh. Figure 8 shows the depend-ence of mesh temperature on heating time for heating rates of 60 and 950C/min. At a heating rate of 60C/min, the mesh
temperature (TM) was about30{50C higher than the control
temperature (TC) over the entire heating period. However, at
a heating rate of 950C/min, the change in mesh temperature (TM) exhibited three stages. At the first moment of current
flow, the mesh temperature quickly climbed to a maximum
0 0.2 0.4 0.6 0.8 1
0 500 1000 1500 2000
750°C
800°C
Deformation of Joint (%)
Heating Rate, R
H / (°C/min)
Ti-Mesh-Ti
Bonding Conditions: 0.9 MPa, 0 min, in Vacuum
Bonding Temperature
Fig. 5 Relationship between deformation of joints and heating rate for
bonding temperatures of 750 and 800C.
Fig. 6 Cross sections including mesh and rod joints: (a) heating rate of
60C/min; (b) heating rate of 1500C/min.
0 10 20 30 40 50
0 400 800 1200 1600 2000
Deformation of Mesh (%)
Heating Rate, RH / (°C/min)
Ti-Mesh-Ti
Bonding Conditions: 0.9 MPa, 750°C, 0 min, in Vacuum
Fig. 7 Relationship between mesh deformation and heating rate for
[image:3.595.56.282.71.220.2] [image:3.595.313.541.73.230.2] [image:3.595.48.291.274.456.2](Tmax), then decreased, then climbed again. When the control
temperature reached the bonding temperature (TB) of 750C,
the final mesh temperature (TF) was 860C. Similar behavior
was observed at other heating rates.
Then we evaluated the maximum temperatureTmaxat first
moment and mesh temperatureTFat final moment for every
heating rate used. We also calculated the difference between the maximum and control temperatures (Tmax¼Tmax
TC) and between the final mesh temperature and the bonding
temperature (T ¼TFTB). Figure 9 shows the
relation-ship of these temperature differences and the heating rate. It can be seen that both temperature differences increased with increasing heating rate. This indicates that there was a temperature gradient between the mesh and a point about 1 mm away on the rod. This temperature gradient increased with increasing heating rate. The existence of such a temperature gradient in the PECS process has also been demonstrated in the sintering of metals and ceramics.18–20)
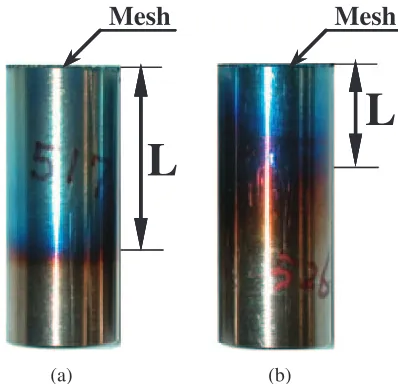
In general, when titanium is heated in a vacuum of about 1 Pa, its surface hue changes because of oxidation, darkening with increasing temperature and time. When the temperature is over 700C, the titanium surface becomes blue. Utilizing this phenomenon, we investigated the temperature distribu-tion along the joints.
Bonding experiments at heating rates of 60, 200, 400, 950 and 1500C/min were carried out in a vacuum of 1 Pa.
Bonding temperatures of 800 and 850C were used in the
present study. Figures 10(a) and (b) show photographs of samples heated to 850C at rates of 60 and 400C/min. For
the 60C/min sample, 2/3 of the length of the rod near the
mesh is colored blue, as shown in Fig. 10(a). It can be presumed that the temperature dropped from 850 to 700C within about 20 mm. However, the fact that only 1/3 of the rod length turned blue, as shown in Fig. 10(b), indicates that the temperature dropped from 850 to 700C within about
10 mm. Using the same method, the length of the blue area L, as indicated in Fig. 10, was measured for various samples treated with different heating rates. Figure 11 shows the dependence of the length of the blue area on the heating rate. It can be seen that the blued length decreased with increasing heating rate. When the heating rate was over 950C/min, the
blue area was almost unnoticeable, regardless of the bonding temperature. This is a further indication that the temperature gradient along the joint increased with increasing heating rate.
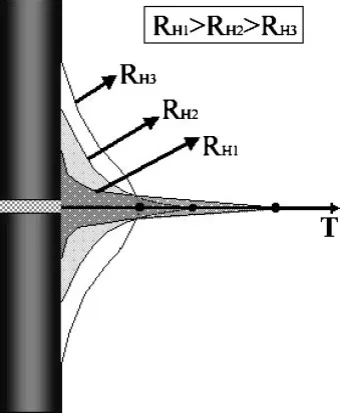
Based on these results, we can sketch the temperature distribution along the joints during the PECS process (Fig. 12). The mesh temperature was higher than the bonding temperature measured by the thermocouple welded about 1 mm away from the edge of the mesh. With rapid heating, the mesh temperature was higher than with slow heating even if the bonding temperature was the same. This explains why the mesh deformation increased with increasing heating rate and why the tensile strength increased with increasing heating rate.
Furthermore, the bonding strength between the Ti mesh and the Ti rod exceeded the strength of the parent material when the heating rate was 1500C/min (Fig. 3). The reason
is thought to be as follows. Because the mesh has a larger deformation, the contact area between the mesh and the rod should be greater than 38.2% of the area of the circle. However, in calculating the bonding strength, the increased contact area was ignored, making the apparent bonding
0 200 400 600 800 1000
0 100 200 300 400 500 600 700 800
0 10 20 30 40 50 60 70 80
Temperature,
T /
°
C
Heating Time, t H/ s
Heating Time, t H / s
Heating Rate: 950 °C/ min
60 °C/ min
TM
TC
Heating Rate:
TM
TC
Fig. 8 Dependence of mesh temperature on heating time for heating rates
of 60 and 950C/min.
0 200 400 600 800 1000
0 400 800 1200 1600 2000
Difference of Temperature,
Heating Rate, R
H / (°C/min) ∆Tmax
∆T Ti-Mesh-Ti
Bonding Conditions: 0.9 MPa, 0 min, in Vacuum
∆
T
/
°
C
Fig. 9 Relationship between temperature difference and heating rate.
L
L
Mesh
Mesh
[image:4.595.324.523.73.265.2](a) (b)
Fig. 10 Photos of samples heated at 850C in a vacuum of 1 Pa: (a) 60C/
[image:4.595.58.282.75.244.2] [image:4.595.57.283.302.457.2]strength higher than that of the parent material. Also, when a heating rate of 60C/min was used (Fig. 3), the tensile
strength of the joint was higher than that produced by a 200C/min rate. The reason is that at 200C/min the temperature gradient along the joints was larger than when the heating rate was 60C/min. Therefore only the mesh was heated, and the rod deformation was slight. But when the heating rate was a slower 60C/min, the temperature gradient
along the joints was small. The heated Ti rod was deformed and the area of the contact was enlarged. Because the increased area of the contact was ignored in the calculation of the bonding strength, a higher tensile strength was calculated. In the conventional sintering process, the beads and substrate are heated uniformly by a nearby heater. The substrate experiences the same temperature as the beads, and both the substrate and beads deform. In the PECS process, when the heating rate is as slow as 60C/min, the electric
current flowing through joints is small and the Ti mesh and Ti
rod are heated uniformly, as in the conventional sintering process. In contrast, when the heating rate is higher, a large electric current flows, and the electric current density in the Ti mesh is higher than that in the Ti rod. In addition, there is contact resistance between the mesh and rod, concentrating the increase in temperature in the mesh and at the interfaces between the mesh and the rod. The rod should experience a lower temperature than in the conventional sintering process, explaining why the deformation of the Ti rod is small.
5. Conclusions
Ti mesh was bonded to a solid titanium substrate using PECS to fabricate a porous surface on titanium suitable for an implant. We investigated the effect of heating rate on the bond strength of the joints, deformation of the mesh and deformation of the joint. The heating rate had a significant effect on the temperature distribution along the structures. There was a temperature gradient from the Ti mesh to the Ti rod that increased with increasing heating rate. For the same bonding temperature, the mesh temperature under rapid heating was higher than with slow heating. Strong bonding can be achieved by rapid heating due to the concentration of heat at and near the mesh the deformation of the rod was reduced.
REFERENCES
1) C. A. Engh: J. Bone Joint Surg. Am. B69(1987) 45–55.
2) G. Jiang and D. Shi: J. Biomed. Mater. Res.43(1998) 77–81.
3) P. N. De Aza, Z. B. Luklinska, C. Santos, F. Guitian and S. De Aza:
Biomaterials24(2003) 1437–1445.
4) J. D. Bobyn, R. M. Pilliar, H. U. Cameron, G. C. Weatherly and
G. M. Kent: Clin. Orthop. Relat. R.149(1980) 291–298.
5) R. M. Pilliar: Clin. Orthop. Relat. R.176(1983) 42–51.
6) V. Amigo, M. D. Salvador, F. Romero, C. Solves and J. F. Moreno:
J. Mater. Process. Tech.141(2003) 177–122.
7) A. Curodeau, E. Sachs and S. Caldarise: J. Biomed Mater. Res. (Appl.
Biomater.)53(2000) 525–535.
8) G. Q. Xie, O. Ohashi, K. Chiba, N. Yamaguchi, M. Song, K. Furuya
and T. Noda: Mater. Sci. Eng. A359(2003) 384–390.
9) H. Furuhata and O. Ohashi: J. Jpn. Inst. Met.67(2003) 448–451.
10) Y. Zhou, K. Hirao, Y. Yamauchi and S. Kanzaki: Scripta Mater.48
(2003) 1631–1636.
11) T. Nagae, M. Yokota, M. Nose, S. Tomida, T. Kamiya and S. Saji:
Mater. Trans.43(2002) 1390–1397.
12) U. Anselmi-Tamburini, S. Gennari, J. E. Garay and Z. A. Munir: Mater.
Sci. Eng. A394(2005) 139–148.
13) M. Omori: Mater. Sci. Eng. A287(2000) 183–188.
14) J. R. Groza and A. Zavalianggos: Mater. Sci. Eng. A287(2000) 171–
177.
15) Z. Zhen, Z. Zhao, H. Peng and M. Nygren: Nature417(2002) 266–269.
16) L. A. Stanciu, V. Y. Kodash and J. R. Groza: Metall. Mater. Trans. A32
(2001) 2633–2638.
17) Y. Zhou, K. Hirao, Y. Yamauchi and S. Kanazaki: J. European Ceram.
Soc.24(2004) 3465–3470.
18) G. Q. Xie, O. Ohashi, N. Yamaguchi, M. Song, K. Mitsuishi, K. Furuya
and T. Noda: J. Mater. Res.19(2004) 815–819.
19) G. Q. Xie, O. Ohashi, T. Sato, N. Yamaguchi, M. Song, K. Mitsuishi
and K. Furuya: Mater. Trans.45(2004) 904–909.
20) U. Anselmi-Tamburini, S. Gennari, J. E. Garay and Z. A. Munir: Mater.
Sci. Eng. A394(2005) 139–148.
0 10 20 30
60 200 400 950
850°C 800°C
Length of discolored area,
L/
mm
Heating Rate, R
H / (°C/min) Ti-Mesh-Ti
Bonding Conditions: 0.9 MPa, 0 min, 1 Pa
[image:5.595.58.284.74.232.2]Bonding Temperature
Fig. 11 Dependence of length of discolored area on heating rate.
Fig. 12 Schematic diagram of temperature distribution along the joints for
[image:5.595.84.258.279.486.2]