Multi-Layered Potts Model Simulation of Morphological Changes
of the Neck during Sintering in Cu-Ni System
*1Takeshi Yamashita
*2Tomoki Uehara
*3and Ryuzo Watanabe
*4Department of Materials Processing, Graduate School of Engineering, Tohoku University, Sendai 980-8579, Japan
A mathematical model is developed in this study to simulate the morphological change of the sintering neck by neck growth and the Kirkendall void formation in the Cu-Ni interdiffusion system. The fluxes of materials and vacancy are analyzed for estimating excessive-deficient vacancy regions. The Multi-Layered Potts Model (MLP Model) is used as the mathematical model. The MLP Model is an improved model of the traditional Potts Model which can treat multiple materials transportation mechanisms such as interdiffusion system. The Potts Model uses a two dimensional (2-d) array to describe a 2-d microstructure, on the contrary, the MLP Model uses a three dimensional (3-d) array which stacks several 2-d arrays. The MLP Model of present study could treat an interdiffusion and an intrinsic diffusion coefficient as a function of the local alloy component. The morphological change and analyzed materials and vacancy fluxes of the simulation results are compared with the experimental results, then good agreements is observed.
(Received June 7, 2004; Accepted November 4, 2004)
Keywords: Monte Carlo method, interdiffusion, intrinsic diffusion coefficient, material flux analysis, excess-deficiency vacancy analysis
1. Introduction
Sintering in alloy system involves two concurrent proc-esses: one is capillarity-driven atom diffusion that results in the neck growth between contact particles, and the other is chemically driven inter diffusion that results in the formation of the groove and hump in and near the neck. Kuczynski1–3) first reported such a morphological changes of the sintering necks in various alloy systems, and pointed out that this characteristic morphological change of the sintering neck was attributed to the Kirkendall effect, i.e. to the unequal diffusion fluxes of two kinds of atoms.3) Watanabe et al.4)
investigated the morphological change of the neck geometry in Cu-Ni alloy system using a wire bundle model, and by EPMA analysis of the concentration distributions across interwire necks. From the experimentally determined con-centration-distance curves they estimated the diffusion fluxes and their divergences, which would show the creation or annihilation of vacancies resulting from the unequal diffusion fluxes.5) They found that the morphological change in the sintering necks in Cu-Ni system is well explained by the formalism of diffusion equations for the Kirkendall effect. While they determined the places of positive and negative maximums of the vacancy generation in the neck region and estimated qualitatively the vacancy flow from the neck interior to the neck free surface and vice versa, they did not exactly traced their flow paths. This investigation was attempted to get a view more in detail of the vacancy flow involved in the morphological change in the Cu-Ni sintering system using Potts model simulation that may allow us to treat such kind of problem with a great versatility.6)
The fluxes of the Cu and Ni atoms and the vacancy satisfy the relationship in eq. (1):7)
JCuþJNiþJVa¼0 ð1Þ
where JCu and JNi are the materials fluxes of Cu and Ni respectively, andJVais the vacancy flux. The material flux of Cu is much larger than that of Ni (jJCuj>jJNij) due to the larger diffusion coefficient in the Cu rich region and the Ni rich region. The interdiffusion occurred at the interface of the wires, therefore, the excess vacancies were accumulated in the Cu wire region by the vacancies flow from the Ni wire surface. Then the excess vacancies were absorbed to the effective sink such as dislocation and grain boundaries, and the Kirkendall voids had formed at the interface of the wires and in the Cu wire region.
We are aiming at a predictive tool for the morphological changes by the Kirkendall Effect, when initial shapes and coupling materials of the model are defined discretionary. The holding temperature and its time are essential parameters for the simulation model. In the present paper, we reproduce a morphological change of a sintering neck and the formation of the Kirkendall voids by using a numerical simulation model. And we analyze the materials and the vacancy fluxes to compare the simulation results with the experimental results to examine the validity of the simulation model. The numerical simulation model was coded to reproduce the morphological change of the sintering neck including the Kirkendall Effect and an interdiffusion of two components, and a materials flux change due to an intrinsic diffusion coefficient change depend on local concentration of the component, and a change of a material flux path with the morphological change in result of the sintering neck and the Kirkendall Effect. The Potts Model8–13)is a useful simulation
model uses a probability theory and is able to treat a huge amount of mass transfer by moving atoms or molecules aggregate as a unit cell. And in the former study,9) we improved the Potts Model to handle multiple materials transportation mechanisms and the interactions in heteroge-neous system. We call the improved Potts Model as ‘‘Multi-Layered Potts Model’’ (MLP Model) derived from the layer stacked simulation matrix. We adopted and recoded the MLP *1This Paper was Presented at the Autumn Meeting of the Japan Institute of
Metals, held in Sapporo, on October 13, 2003 *2Graduate Student, Tohoku University.
*3Undergraduate Student, Tohoku University. Present address: Institute for Materials Research, Tohoku University, Sendai 980-8579, Japan *4Polytechnic College AOMORI, Goshogawara 037-0002, Japan
Model for treating the Kirkendall Effect and the morpho-logical change.
2. Simulation Model
2.1 Traditional Potts model
In former studies, a microstructural developments during sintering process by single materials transportation mecha-nism were considered for a liquid phase mass transfer and the Ostwald ripening.10,11) In addition a grain growth12)
con-trolled by impurities were performed. In these simulation models, the Potts Model used as numerical simulation models, has a two dimensional (2-d) simulation matrix and can compute a 2-d microstructural evolutions including more than two phases. The traditional method proposed by Srolovits13) was used for calculating interaction energy between adjacent sites and change these positions to evolve microstructure. These Potts Model simulations allocate integer numbers to distinguish crystal orientations and the grains and components included in the microstructure. The integer number allocated to a site was changed with exchange of the sites positions but the total variety of integers won’t change. And in general, the total variety of integers was less than a hundred. This is because processing power of a commercial computer could treat such number of integer numbers in a practical time. So, the traditional Potts Model can treat discrete state quantity and the expressible state quantity is limited. Additionally, the 2-d matrix for the 2-d microstructure could treat single state quantity for calculating interaction energy.
2.2 Multi-layered Potts model
The MLP Model can treat two more quantity state coinstantaneously by using multiple 2-d matrices, e.g. distinguish between A and B in heterogeneous system and the concentration transitions. Therefore, the MLP model has abilities to model multiple phases and vacancy flows, local concentration gradient of each phase by using actual number for a site state quantity. In addition, it can display easily the simulation results as graphical images easily after analyzing. In this study, four 2-d matrices are prepared to model a 2-d morphological change of the sintering neck of the Cu-Ni wires. Each matrix treated interdiffusion of the Cu and Ni considering the intrinsic diffusion coefficients depend on local materials concentration gradient, and the vacancy flux as a result of the Kirkendall Effect, and morphological changes of a sintering neck (neck growth and Kirkendall voids formation). The 2-d matrix is square matrix and takes the eight first adjacence sites into account for calculation, and reduces the computational effort by using symmetry property of the Cu-Ni wire model. A site which is adjacent to three more no material sites is defined as a surface site.
2.3 Algorithm for interaction diffusion
In the simulation model, materials transportation occur between a site and the eight first adjacent sites. The site is selected randomly from the simulation matrix and local concentration gradient is calculated as a driving force between each adjacent site. This simulation method is considered as the Monte Carlo method.11,12) The materials
fluxes are calculated according to the following Fick’s first law:
J¼ DdC
dl ð2Þ
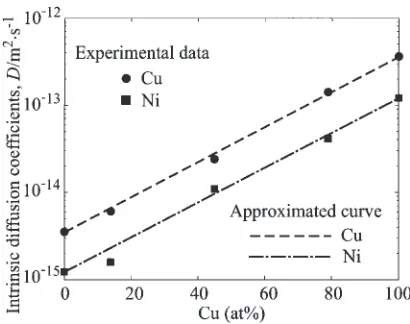
where J is the material flux, D is the intrinsic diffusion coefficient, anddC=dlis the concentration gradient between the adjacent site. The material flux is calculated between a randomly selected site and the eight first adjacent sites, so 2-d material flux is reproduced by using one dimensional Fick’s first law shown in eq. (2). The intrinsic diffusion coefficient, which depends on the material concentration of the site, is calculated from the average mole fraction between the selected site and the adjacent site. The material flow calculated from the material value and diffusion edge length which is the length of the site edge in this 2-d simulation model. The intrinsic diffusion coefficient depending on the concentration in the Cu-Ni alloy is calculated from the following approximate expression of the experimental data by Monma et al.14)The experimental data and the
approx-imation lines are shown in Fig. 1. The intrinsic diffusion coefficient of the Cu and Ni were calculated from eq. (3) and eq. (4):
DCu¼3:31015expð4:7102NCuÞ ð3Þ
DNi¼1:21013expð4:7102NNiÞ ð4Þ
whereDCu andDNi are intrinsic diffusion coefficient of Cu and Ni (m2s1),NCu andNNi are the average mole fraction (%) of the selected site and the adjacent site respectively. The surface diffusion affects the material flux at a surface site, therefore, the material flux is larger than at a internal site. This is taken into account when the material flux is calculated. An intrinsic diffusion coefficient which depends on a local material concentration is increased several times at the surface site which is defined above. In this simulation, an intrinsic diffusion coefficient is increased five times in order to reproduce the experimental morphological change.
After calculating the material flow of the all sites in the 2-d matrix, following expression modified eq. (1) to calculate mole fraction of vacancy at the selected site and the eight adjacent sites result in the Kirkendall Effect.
[image:2.595.323.528.595.757.2]NVa¼100 ðNCuþNNiÞ ð5Þ
whereNVa is mole fraction of the vacancy. The simulation
procedures mentioned above was executed to the Cu, Ni and vacancy layers repeatedly till all of the sites on the simulation matrix are selected. We defined these operations as one Monte Carlo Step (one MCS). By these operations, the mole fractions of the Cu, Ni and vacancy are considered a metastable state during one MCS.
2.4 Algorithm for making a vacancy
After calculating the vacancy mole fraction of the all sites in the vacancy layer with the operation of the interdiffusion of Cu and Ni, a surface site is transformed to a pore site, when the excessive vacancy concentration is over a threshold. In this simulation, the threshold of excessive vacancy concen-tration for making a pore site is set 5% excessive in order to reproduce the experimental morphological change.
In this model experience, the distance from the contact position of the Cu and Ni wire to the occurrence point of the Kirkendall groove is shorter than the distance of interdiffu-sion, therefore, the visible Kirkendall voids are observed only at the surface of the Cu wire. In the simulation model, therefore, only a surface site is possible to be transformed to a pore site and the Kirkendall groove will be formed. A site which is adjacent to three more pore sites is defined as a surface site.
On the contrary, at a deficiency vacancy site, the excess materials diffuse to the eight adjacent sites considering the material concentrations and the intrinsic diffusion coefficient. These two operations reproduce the morphological change depended on the vacancy concentration.
3. Experimental and Simulation Method
3.1 Specimen preparation
The specimen for the sintering experiment is shown in Fig. 2. The specimen consisted of Cu wire diameter of 0.25 mm and purity of 99.9%, and Ni wire diameter of 2.0 mm, length of 20 mm and purity of 99.9%. The Cu wire was twisted around the Ni core wire and the both ends were embedded to be fixed, then no stress was generated at the contact points of the Cu and the Ni wires.
3.2 Sintering procedure
The specimen was sintered in dry hydrogen for interaction diffusion, neck growth and making the Kirkendall void, the holding time were 1,3 and 10 hours at 1323 K. The specimen was mounted in an epoxy adhesive and cut perpendicular to the Ni wire axis, and the cross sections were ground by water
proof abrasive paper and finally polished with alumina paste. The specimen was analyzed on the cross sections by electron probe microanalyser (EPMA) using Kline of Cu. Accel-erating voltage was 20 kV, sample current was 20 nA and scanning rate was 20mm/s.
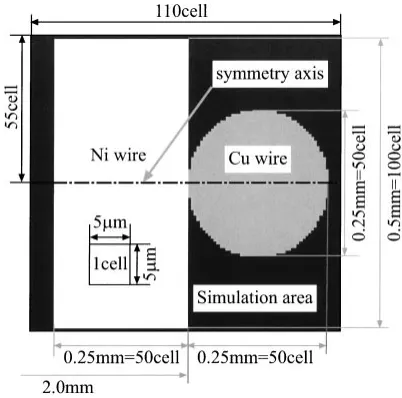
3.3 Initial arrangement for Cu-Ni sintering wire model A schematic illustration of a matrix arrangement for the sintering experiment is shown in Fig. 3. The simulation area consisted of110110¼12100 sites and the radius of the Cu wire was arranged with 50 cells, then the length of a square site was defined 5mm.
To reproduce interdiffusion, multiple materials fluxes depend on each material concentration should be treated independently. For this purpose, we applied the MLP model to the arranged matrix to treat concentrations of the Cu, Ni, vacancy and outline of the wires. A schematic illustration of the multi-layered matrices is shown in Fig. 4. The first layer treated the Cu concentration, the second treated the Ni concentration, the third treated the vacancy concentration. The initial mole ratio of vacancy was set106in pure Cu and Ni sites. And for visualizing the outline changes of the wire, the fourth layer represented total material concentration by adding up materials concentrations in a site correspond to the same position of the first and the second layer. These four layers reproduced an interdiffusion depended on local materials and vacancy concentrations, morphological change of the wire outline with void formations and material depositions by the Kirkendall Effect. And an interactional effect of the outline change and a change of diffusion path was also reproduced by the multilayer. The center line shown in Fig. 3 was the symmetrical axis, therefore intended area for calculation was lower half of the model to reduce the computational effort.
3.4 Analysis of materials and vacancy fluxes
Materials fluxes of the Cu and Ni and vacancy flux were analyzed from the results of one-dimensional materials concentration analysis by the EPMA and the simulation Fig. 2 Side view of twisted Cu-Ni wires for sintering experiment.
[image:3.595.325.526.72.271.2] [image:3.595.66.270.691.768.2]results using eq. (1) and eq. (2). And to estimate the area where vacancy was excessive or deficient, the divergence of these fluxes were calculated using eq. (6).
divJVa¼ divfðJCuþJNiÞg
¼d=dxðJCuþCNiÞ ð6Þ
4. Results and Discussions
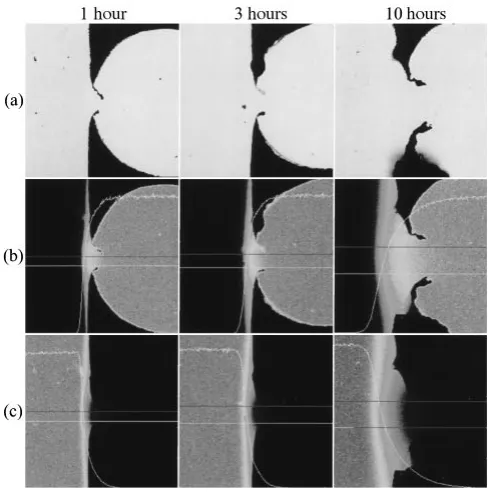
4.1 Neck growth and formation of Kirkendall void The BSE images and the X-ray analysis of element concentration by the EPMA are shown in Fig. 5. A normal neck growth and additional morphological change, i.e. the Kirkendall groove formation were observed in Fig. 5(a). The Kirkendall groove grew into the Cu wire deeply with increase of holding time, and Ni atom accumulation made humps at the surface of Ni wire in contrast. And interdiffusion of the Cu and Ni through the interface of the wires were observed in Figs. 5(b), (c).
The outline and contour plot of Cu and Ni concentration of
the simulation result are shown in Fig. 6. A neck growth near the initial interface in early stage, and the Kirkendall groove grew in middle and later stage were reproduced and shown in Fig. 6(a). This groove prevented the neck growth during the increase of MCS. And the growth of humps at the surface of Ni wire by materials accumulation were also reproduced. And interdiffusion of the Cu and Ni through the interface of the wires was also reproduced and shown in Figs. 6(b), (c). The diffusion distance of the Cu was longer than that of Ni because of the higher intrinsic diffusion coefficient of Cu than Ni depended on the local materials concentration.
The relationship between the diameter of the smallest sintering neck and MCS is shown in Fig. 7. The sintering neck at the interface of the Cu and Ni wire grew in the early stage by materials flux, however it had stable diameter in the middle stage and became small in the later stage. This is the result of the Kirkendall void formation at the surface of the sintering neck. This result suggests that the void formation frequency at the surface of the Cu wire was higher in the later Fig. 4 Schematic illustration of the MLP model for twisted Cu-Ni wires.
Fig. 5 Microstructure and element area distribution images of Cu, Ni for cross section of sintering neck in the wires analyzed by EPMA at 1327 K. (a) BSE images (b) CuK(c) NiK.
Fig. 6 Outer shapes and constant concentration lines at various Monte Carlo steps (MCS). (a) outline drawing (b) Cu concentration distribution (c) Ni concentration distribution.
[image:4.595.304.549.72.315.2] [image:4.595.67.268.75.197.2] [image:4.595.46.290.503.749.2] [image:4.595.326.527.636.771.2]stage than in the middle stage. In the later stage, the site which had higher vacancy concentration than the critical level had appeared frequently by the vacancy flow from the inside of Cu wire to the surface.
By comparing the analyzed results of the experiment and the simulation, these morphological change mechanisms of the sintering neck can apply to the experimental system. This vacancy flow will be analyzed in detail in two dimensional analysis in our future study.
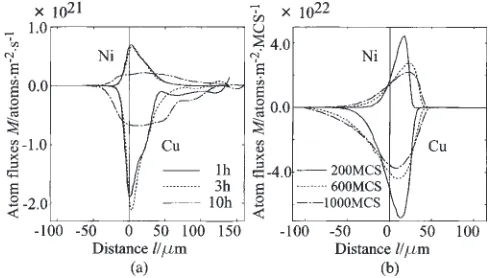
4.2 Material fluxes and excess-deficiency vacancy Analysis results of the materials and the vacancy fluxes, excess-deficiency vacancy concentration of the experimental result and the simulation result are plotted in Fig. 8 and Fig. 9 respectively. The simulation time scale (MCS) and the real time scale are not associated in the Potts Model, thus, the vertical scales of Fig. 8 and Fig. 9 are different fundamen-tally. The analyzed results from the experiment were waved in the Cu region, but it was not observed in the simulation results. This difference resulted from a measurement fluctu-ation of the EPMA system.
The transverse of the each plot shows the distance from the initial interface of the Cu and Ni wire. The positive value of the plot means material flows to the right direction and negative value of the plot means to the left direction in Fig. 8. These two plots of the experimental results and the simulation results show that Ni diffused to the direction of
the Cu wire and Cu diffused to the direction of the Ni wire. The intrinsic diffusion coefficients of Cu and Ni follow the relationship between the Cu concentration in Cu-Ni system and the intrinsic diffusion coefficient shown in Fig. 1. The intrinsic diffusion coefficient was much higher in a Cu rich site than in a Ni site, the absolute value of the Cu flux was higher than the Ni in all holding time and MCS. The positive value of the plot means that excess vacancy were accumu-lated and the negative value of the plot means that defective vacancy and excess materials are existing as a result of inhomogeneous vacancy flow shown in Fig. 9.
The present experimental results of the divergence of vacancy flux are 10 times as large as that reported by Watanabeet al.4)The intrinsic diffusion coefficient of Cu and Ni depend on holding temperature. The values at 1323 K14) are about twice as large as at 1273 K15)in whole range of the composition. Therefore the present experimental results are same order as Watanabe’s results with consideration of the difference of the intrinsic diffusion coefficient.
The peak points and the value of the Cu and Ni flux shifted to the direction of Cu and decreased with increase of MCS. In the Cu and Ni alloy system, concentration difference near the initial interface of the Cu and Ni wire is a driving force to interdiffusion materials. The highest concentration difference of Cu shifted from the initial interface to the direction of Cu wire by the interdiffusion, and the peak value decreased. The peak position shifted according to the point where product of the material concentration difference and the intrinsic diffusion coefficient depended on the material concentration had maximal value with the interdiffusion progress.
The excess vacancy disappeared at the Kirkendall void and made a groove in the Cu wire and destitution vacancy disappeared at materials humps near the initial interface at the surface of Ni wire. In the plot of materials fluxes from the experimental result shown in Fig. 8(a), holding time was 10 hours, there were not only broad and remarkable peaks observed. This plot transition was result from the morpho-logical change of the sintering neck by neck growth and the Kirkendall groove formation, and the interdiffusion area was widely spread in the Cu and Ni region. In addition, the plots of divergence of vacancy flux shown in Fig. 9(a), were so fluctuating that it was difficult to distinguish where the points indicate the vacancy was excessive or deficient.
On the contrary, in the simulation results shown in Fig. 8(b), the inhomogeneous morphological change near the sintering neck was insignificant, so the analyzed plots reflected the materials and vacancy fluxes by interdiffusion depended on the local material concentrations and intrinsic diffusion coefficient.
Monte Carlo simulation based on the multi-state kinetic Potts model requires coordination between MCS and real time for evaluating a simulation result quantitatively. The parameters for coordination are different in each simulation model, for example, Raabe16) has associated them by
maximum occurring grain boundary mobility, maximum occurring driving force, and lattice parameter of the simulation grid. In our future study, we will associate the coordination between the MCS and the real time, by measuring depths of Kirkendall groove at various holding time and lattice parameter of the simulation grid.
Fig. 8 Instantaneous atom fluxes of Cu and Ni determined from eq. (1) with distance from initial contact point. (a) experimental results (b) simulation results.
[image:5.595.46.291.413.552.2] [image:5.595.48.290.621.758.2]The morphological changes, materials and vacancy fluxes, and the divergence of vacancy flux were reproduced qualitatively by the simulation using MLP model. The simulation results should be evaluated quantitatively after associating coordination between the MCS and the real time. These results are brought under review in detail by analyzing the simulation results. However, these analyzed results were suggested by the line analysis of EPMA, so two dimensional vacancy flux should be analyzed for estimating the point where the groove and humps were generated. This vacancy flow will be analyzed in detail in two dimensional analysis in our future study to predict the position and the growth direction of the Kirkendall groove in the Cu-Ni system.
5. Summary
By using the Multi-Layered Potts Model (MLP model), we succeeded in reproducing the morphological changes by the neck growth and the Kirkendall void formation in the Cu-Ni system. The simulation model could treat intrinsic diffusion coefficient depended on a local alloy composition in the interdiffusion system. And the MLP Model could also treat the alloy composition change in multiple systems by interdiffusion, where the diffusion paths changes affected the materials and vacancy fluxes. The analyzed plots of materials and vacancy fluxes and divergence of the vacancy flux from the simulation results were in good agreement with the experimental results. In addition, there was no measure-ment fluctuation for materials concentration and no inhomo-geneous morphological change of the neck in the simulation results. So these advantages of the simulation model make
the problem of position determination of excessive-deficien-cy vacanexcessive-deficien-cy much easier than in the experiment by using the vacancy flux analysis.
It is noted that, this vacancy flux will be analyzed in detail in 2-d analysis in our future study to predict the position and the growth direction of the Kirkendall groove in the Cu-Ni system.
REFERENCES
1) G. C. Kuczynski and P. F. Stablein: Proc. 4th Int. Symp. on Reactivity of Solids, (Elsevier, 1960) pp. 91.
2) P. F. Stablein and G. C. Kuczynski: Acta Metall.11(1963) 1327–1337. 3) G. C. Kuczynski: Proc. Int. Conf. on Sintering and Related Phenomena, University of Notre Dame, 1965, ed. by G. C. Kuczynskiet al., (Gordon and Breach, 1967) pp. 685.
4) R. Watanabe, H. Nagai and Y. Masuda: Sci. of Sintering11(1979) 31– 58.
5) P. G. Shewmon:Diffusion in Solids, (MacGraw-Hill, 1963) pp. 128. 6) P. Das and R. Choudhury: J. Nucl. Mater.187(1992) 272–277. 7) A. Smigeksjas and E. Kirkendall: Trans. Metall. Soc. AIME171(1947)
130–142.
8) F. Y. Wu: Rev. Mod. Phys.54(1982) 235–268.
9) T. Yamashita and R. Watanabe: J. Jpn. Soc. Powder Powder Metallurgy
50(2003) 821–827.
10) H. Matsubara: Compu. Mater. Sci.14(1999) 125–128.
11) M. R. Dudek, J.-F. Gouyet and M. Kolb: Surf. Sci.401(1998) 220–226. 12) I. Ohnuma, K. Ishida and T. Nishizawa: Philos. Mag. A79(1999)
1131–1144.
13) G. N. Hassold, I.-W. Chen and D. J. Srolovitz: J. Am. Ceram. Soc.73
(1990) 2857–2864.
14) K. Monma, H. Suto and H. Oikawa: J. JAPAN Inst. METALS 28
(1964) 192–196.