Crystal Alignment of Titanium under Simultaneous Imposition
of Electric Current and Magnetic Field
Yasuhiko Sakaida
*, Kazuhiko Iwai and Shigeo Asai
Department of Materials,Physics and Energy Engineering, Nagoya University, Furo-cho, Chikusa-ku, Nagoya 464-8603
It is well known that the transport of atoms, ions and holes in a material is induced by electromigration. This implies that electromigaration can control the structure of a material. In this study, an electric current was applied to a titanium sample that was subjected to a static magnetic field to investigate the effects of the electric current and the static magnetic field on crystal alignment in titanium.
An intensity ratio of (002) peak to (100) peak in XRD analysis was introduced as a crystal alignment index.
Because the magnetic susceptibility of titanium in the c-axis is larger than what it is in the a-axis, titanium crystals having a c-axis parallel to the magnetic field are stable from the viewpoint of magnetization energy. However, the numbers of these crystals decreased after the experiment. On the other hand, the c-axis of the titanium crystals aligned themselves itself to become perpendicular to the direction of flow of the electric current to reduce the Joule loss in the sample, because the specific resistance in the c-axis was larger than that in the a-axis. This agrees with the experimental result.
Therefore, in this experiment the titanium crystals in the sample aligned themselves to reduce the Joule loss even though the magnetic energy was larger than the thermal fluctuation in this experiment. [doi:10.2320/matertrans.MI200703]
(Received April 26, 2007; Accepted July 27, 2007; Published October 25, 2007)
Keywords: electromigration, electric current, magnetic field, crystal alignment, titanium
1. Introduction
The imposition of an electric current on electrically conductive materials such as metals and alloys induces electromigration and thermal strain in the materials, leading to deterioration and loss of continuity in electric circuits. Until now, these phenomena have been investigated mainly from the viewpoint of the reliability of integrated circuits, because the electric current density in LSI (large-scale integrated circuit) and ULSI (ultra-large scale integrated circuit) has drastically increased of late. For example, simulations and computer models,1)temperature dependence of electromigration,2)and transformation behavior of solder alloys,3) have been performed. In these studies, copper, aluminum, and solider alloys have been treated as the test materials usually used in integrated circuits.
Conversely, an electric current has the potential to control the structure of a material because the transport phenomena of atoms, ions, and holes in a material can be controlled through electromigration. For example, electromigration has been applied to refining of an electrically conductive material.4,5)
The use of a magnetic field is well known as a powerful tool for controlling crystal alignment for crystallographically anisotropic materials.6–8)Therefore, the simultaneous impo-sition of a magnetic field and an electric current might induce crystal alignment. However, the effect of the simultaneous imposition of an electric current and a magnetic field on crystal alignment had not been discussed until now.
In this study, an electric current was applied to a titanium sample that was subjected to a static magnetic field to investigate the effect of the electric current and the static magnetic field on crystal alignment in the sample.
2. Experimental Procedure
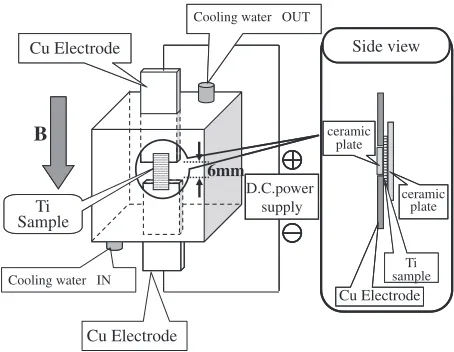
Titanium was chosen as a sample because it exhibits an anisotropic nature in electric conductivity and magnetic susceptibility as a result of its hexagonal crystallographic structure. The experimental apparatus used is shown in Fig. 1. A piece of titanium foil measuring10mm5mm
2mm (purity: 99.6%) was positioned between two copper electrodes set 6 mm apart. The titanium foil was pressed between ceramic plates to suppress its motion, even though the Lorentz force was not essentially induced in the sample because of the parallel imposition of an electric current and a static magnetic field. These items were placed in a box in which ion-exchanged water was supplied during the experi-ment to prevent increase in the sample temperature due to the Joule loss. The box was positioned in the bore of a superconducting magnet that generated a static magnetic field in the vertical direction. A DC current of 1.0 A was supplied to the titanium sample via the copper electrodes, and
D.C.power supply
B
Side view
ceramic plate ceramic
plate
6mm
Cu Electrode Cooling water OUT
Cu Electrode
Cooling water IN
Ti sample
Ti Sample
Cu Electrode
Fig. 1 Experimental apparatus.
*Graduate Student, Nagoya University
Special Issue on Structural and Functional Control of Materials through Solid-Solid Phase Transformations in High Magnetic Fields
[image:1.595.313.540.591.767.2]the intensity of the magnetic field was 5 T. The magnetic field and the electric current was supplied for7:2104s (20 h).
3. Result
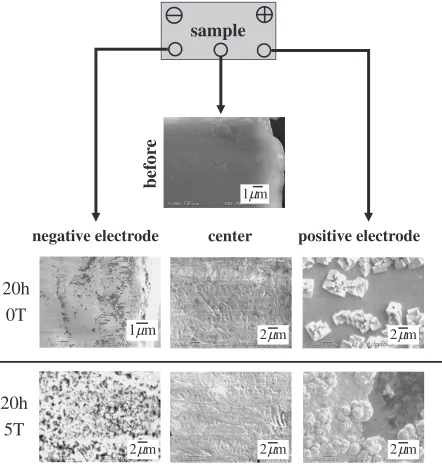
SEM images (Fig. 2) of the sample surface were taken at the central region, at the negative electrode region, and at the positive electrode region to examine precipitated materials observed on the surfaces of the titanium sample and the copper electrodes. When the magnetic field was not supplied, precipitates with a faceted surface were observed at in the positive electrode region, whereas many voids were formed at the negative electrode region. At the central region, many grooves were observed, although these were not observed before the experiment. When the magnetic field was applied, precipitates were also observed at the positive electrode region, and the shape of these precipitates was different from those when no magnetic field was applied. This implies that
the magnetic field affected the oxidation behavior of copper. At the negative electrode region, a concave-convex surface was formed and it had a rougher surface than in the case when no magnetic field was imposed. Many grooves were observed at the central region, as was the case of the sample without the magnetic field.
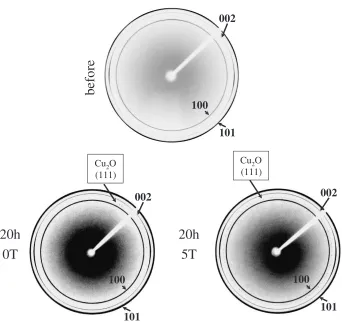
Debye rings observed on each sample are shown in Fig. 3. The white line in a radial direction at ¼45 degrees is a shadow caused by the XRD analyzer. Three peaks of (100), (002), and (101) were mainly observed in all samples. The precipitate observed in Fig. 2. is CuO2, because its weak peak was detected in the XRD result as shown in Fig. 3.
Cross-sectional profiles at ¼0 degree and at ¼180
degrees were averaged for the evaluation of the crystal alignment in the sample. Additional profiles at ¼90
degrees and at¼270degrees were also averaged. Here, the former is called the vertical profile while and the latter is called the horizontal profile in this paper. When the c-axis of
bef
or
e
positive electrode
negative electrode
center
sample
20h
0T
20h
5T
m
1
µ
m
2
µ
m
1
µ
2
µ
m
m
2
µ
m
2
µ
m
2
µ
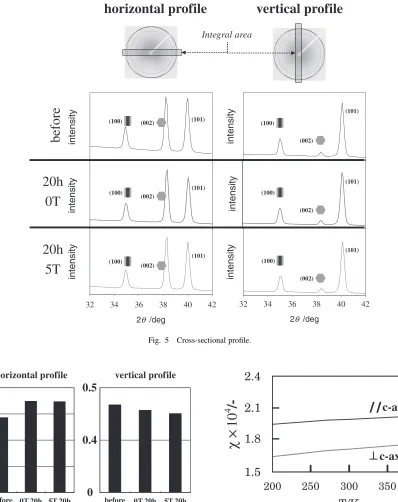
[image:2.595.79.521.72.539.2]the crystals in the sample was parallel to the electric current direction as shown in Fig. 4. (C), c-plane peaks were observed in the vertical profile, whereas a-plane peaks were observed in the horizontal profile. In contrast, a-plane peaks were observed in the vertical profile and c-plane peaks were observed in the horizontal profile, if the c-axis of the crystals in the sample was parallel to the width direction as shown in Fig. 4. (B). When the c-axis of the crystals in the sample were parallel to the thickness direction as shown in Fig. 4.(A), only a-plane peaks were observed in the horizontal profile and in the vertical profile. The experiment results are shown in Fig. 5. Before the imposition of the electric current, the main peak was (002) in the horizontal profile, although it was weak in the vertical profile. This shows that the number of crystals under condition (C) in Fig. 4. was less than the number of crystals under the other two conditions. This might have been caused by the rolling process used to produce the thin titanium foil, since the c-axis of the large parts of the crystals in the sample is perpendicular to the direction of current flow. After the imposition of the electric current, the tendency of the profiles is that the main peak in the horizontal profile is (002), although it is weak in the vertical profile, similar to that prior to the experiment and it does not depend on the imposition of the magnetic field.
An intensity ratio of (002) peak to (100) peak was introduced as a crystal alignment index. The calculated result is shown in Fig. 6. The index in the horizontal profile increased when an electric current was imposed, but it was not affected by the imposition of a magnetic field. In contrast, the index in the vertical profile slightly decreased when an
before
20h
0T
20h
5T
100
002
101
100
002
101
100
002
101
Cu2O
(111)
Cu2O
(111)
Fig. 3 Debye rings for every sample.
X-ray
A (c-axis
//thickness
direction)
X-ray
Ti
Sample
X-ray
B (c-axis
//width
direction)
I
C (c-axis
//I)
[image:3.595.127.469.66.388.2] [image:3.595.305.549.441.770.2]electric current was imposed. This result suggests that titanium crystals under the condition shown in Fig. 4. (C) decreased, and those under the condition in Fig. 4. (B) increased in the sample.
4. Discussion
Because the magnetic susceptibility of titanium in the c-axis was larger than that in the a-c-axis (Fig. 7), the adsorption of migrating titanium ions or atoms on a titanium crystal with a c-axis parallel to the magnetic field might occur from the viewpoint of magnetization energy. Then, magnetization energy difference per unit volume, UM can therefore be calculated by the following equation:
UM¼
0
2 jHj
2
where0 is magnetic permeability in a vacuum,is the magnetic susceptibility difference between magnetically-easy axis and magnetically-hard axis, andHis the intensity of the external magnetic field.
The calculated magnetization energy difference was 300 J/ m3for titanium. On the other hand, thermal fluctuation (kBT, kB: Boltzmann constant, T: absolute temperature) was approximately 1021J when T¼300K. Therefore, the minimum crystal size in which the magnetization energy difference was larger than the thermal fluctuation was calculated as 3:1108m under these experimental
condi-horizontal prof
ile
Integral area
32 42
2θ /deg 2θ /deg
(100) (002) (101)
intensity
42
(100)
(002)
(101)
intensity
(100)
(002)
(101)
(100)
(002)
(101)
intensity
intensity
(100) (002)
(101)
(100) (002)
(101)
intensity
intensity
20h
0T
20h
5T
before
40 38 36
34 32 34 36 38 40
vertical prof
ile
Fig. 5 Cross-sectional profile.
horizontal profile vertical profile
0.5
0.4
0
0
1
2
before 0T,20h 5T,20h before 0T,20h 5T,20h
(100)
(002)
/
-Fig. 6 Intensity ratio of (002) peak to (100) peak.
c-axis
200
T/K
χ ×
×
10
4
/-c-axis
2.4
1.5
1.8
2.1
400
350
300
250
[image:4.595.280.525.67.595.2] [image:4.595.98.496.73.575.2]tions if the interfacial energy was neglected. This condition might be satisfied for most of crystals in the sample; however, magnetically stable crystals decreased when an magnetic field was imposed during the experiment.
On the other hand, the c-axis of the titanium crystals aligned themselves to become perpendicular to the electric current direction to reduce the Joule loss in the sample, because the specific resistance in the c-axis was larger than that in the a-axis as shown in Fig. 8. The Joule loss difference per unit volume, UEwas then calculated using the following equation:
UE¼jJ2j
where is the specific resistance difference between electrically-easy axis and electrically-hard axis, and J was current density.
The calculated Joule loss difference was 3:5108J/m3 for titanium. This value is about 106 times larger than the calculated magnetization energy difference per unit volume. Therefore, from the viewpoint of energy, it is possible to align crystals to be stable in the electric current direction, where they are not stable in the magnetic field direction. This agrees with the experimental result. This is the reason the
titanium crystals in the sample aligned to reduce the Joule loss, even though the magnetization energy difference was larger than the thermal fluctuation.
5. Conclusion
To investigate the effect of an electric current and a static magnetic field on crystal alignment, an electric current was applied to titanium samples that had crystallographic anisotropy in electric and magnetic properties under con-ditions with and without a static magnetic field. The titanium crystals aligned to reduce the Joule loss even though the aligned direction was unstable from the viewpoint of the magnetization energy.
Acknowledgement
This work was partially supported by JSPS Asian Core Program ‘‘Construction of the World Center on Electro-magnetic Processing of Materials’’, and Iron and Steel Institute of Japan.
REFERENCES
1) S. Shingubara, I. Utsunomiya and T. Fujii: The IEICE Transactions. C-II,J78-C-II(1995) 294–304.
2) Aris Christou: Electromigration and Electronic Device Degradation, (Wiley-Interscience 1993).
3) F. Y. Hung, C. J. Wang, T. S. Lui and L. H. Chen: Mater. Trans.46
(2005) 1820–1824.
4) K. Kuroda, Y. Horibe, T. Fujisawa and C. Yamauchi: J. Japan Inst. Metals.58(1994) 634–641.
5) H. Sano, T. Yoshida, K. Kuroda, T. Fujisawa and C. Yamauchi: Shigen-to Sozai.115(1999) 54–58.
6) J. Akiyama, M. Hashimoto, H. Takadama, F. Nagata, Y. Yokogawa, K. Sassa, K. Iwai and S. Asai: Mater. Trans.46(2005) 203–206. 7) J. Akiyama, M. Hashimoto, H. Takadama, F. Nagata, Y. Yokogawa, K.
Sassa, K. Iwai and S. Asai: Mater. Trans46(2005) 2514–2517. 8) J. Akiyama, H. Asano, K. Iwai and S. Asai: Journal of the Japan Institute
of Metals.71(2007) 108–112.
c-axis
c-axis
ρ
10
7
/m
250
T/K
4
6
8
2
200
300
350
400
Ω
×
[image:5.595.67.276.71.212.2]