In-Situ
Observation for Weld Solidification in Stainless Steels
Using Time-Resolved X-ray Diffraction
Mitsuharu Yonemura
1, Takahiro Osuki
1, Hidenori Terasaki
2, Yuichi Komizo
2,
Masugu Sato
3and Akiko Kitano
31Corporate Research and Development Laboratories, Sumitomo Metal Industries, Ltd., Amagasaki 660-0891, Japan
2Joining and Welding Research Institute, Osaka University, Ibaraki 567-0047, Japan
3Industrial Application Division, Japan Synchrotron Radiation Research Institute, Sayo-gun 679-5198, Japan
Characterizing of directional solidification mode of Fe–Cr–Ni alloys during welding was performed using intense synchrotron radiation probe. Consequently, the crystal growth in the rapid solidification process was revealed in detail and the peak profile was systematically analyzed in order to acquire the essential information for controlling the weld microstructure. Then, the crystallization timing of the primary and secondary phases was discussed. Furthermore, the possibility of the lattice rotation to commensurate (i) each dendrite and (ii) crystallites in the dendrites is suggested.
(Received September 2, 2005; Accepted December 22, 2005; Published February 15, 2006)
Keywords: welding, steels, phase transformation, rapid solidification, in situ time-resolved X-ray diffraction
1. Introduction
In fusion welding process, a material is melted by heat source and rapidly cooled to a room temperature. Then, the crack, known as solidification crack, is suffered in the weld metal, by the thermal strain in the solidification temperature range in which ductility remarkably decrease during weld-ing.1–4) The solidification crack is a significant problem during welding of austenite stainless steels, particularly in fully austenitic and stabilized compositions. Narrowing the temperature range in which ductility extremely decreases is effective for the prevention of the crack.5) Therefore, the
decrease of the element content dropping of the solidus temperature which ductility extremely decreases (BTR: brittle temperature range) is very important. However, some elemental additions are indispensable to keep the character-istics of the base metal. So the solidus is raised by controlling the solidification behavior such as the crystallization timing and the crystallization of the heterogeneous phases for the improvement of the solidification crack.6–9) For the better controlling, time-series prediction of the elemental compo-sition, and the crystallization timing is extremely important in the solidification process.
It was difficult to observe the microstructure transition of weld metals dynamically, under the rapid cooling of more than 500C/s. So the solidification morphology of the weld
metal has been estimated by the SEM observation of microstructure, using the liquid-tin quenching method.10–12)
In late nineties, Elmer et al.13–15) has been used a intense
synchrotron radiation as a probe and directly revealed the phase mapping around the heat spot, during pure titanium welding. After that, Babuet al.investigated the primary weld solidification in the Fe–C–Al–Mn weld steel16–18) using the
Time-Resolved X-Ray Diffraction (TRXRD) technique. Their remarkable results were devoted to the heat effect zone. In contrast, several researchers observe the real-time observation of dendrites in alloys using the synchrotron microradiograph in the real space.19–21) However, it is impossible to obtain the quantitative information such as
phase transformation and preferred orientation of crystal in the real space.
Our interest is details of the weld solidification phenomena in the directional solidification process, under rapid cooling. Solution to our interest will greatly be facilitated by the development of original TRXRD methods due to movement of the heat spot. It make possible to determine the phase-transformation behavior of the directional solidification of weld metals in the steep thermal gradients and at the high cooling rates. The dendrite growth of the weld metal is extremely important for the welding. However, the dendrite growth due to movement of the heat source would be unable to catch using the established technique of stationary heat spot.13–18) In this study, austenite stainless steels under
welding conditions of a practical manufacturing process were investigated using the Spatially-Resolved X-Ray Diffraction (SRXRD) method for post weld characterization and TRXRD method forin-situweld observation. The crystallo-graphic information of the and phases in directional solidification was obtained.
2. Experiments
Two samples of Fe–Cr–Ni alloys were prepared: auste-nitic-ferritic solidification mode (AF mode) with the chemi-cal composition of Fe–20%Cr–14%Ni and a ferritic-auste-nitic solidification mode (FA mode) with the chemical composition of Fe–20%Cr–11%Ni. The solidification, refer-red to as the FA mode, starts with primaryferrite and then changes to eutectic solidification as the liquid composition is enriched in nickel and reaches the eutectic valley. In AF mode, the solidification starts with primary austenite, followed by eutectic solidification in the later stage as the liquid is enriched in chromium and the composition reaches the eutectic valley.22)
The XRD experiments were performed on the BL46XU beam line with the undulator, at the SPring-8. The experi-ment was approved by the Japan Synchrotron Radiation Research Institute (Hyogo, Japan).23)The photon energy of
Materials Transactions, Vol. 47, No. 2 (2006) pp. 310 to 316
12 KeV was chosen to maximize the intensity and the number of peaks into the2window of the detector. The diffraction line was recorded in the imaging plate (IP), with the wide angular range and the wide dynamic range. This camera was a flat board type and was fixed on an automatic stage, behind the slit of the width of 25mm.24)The wavelength determined
by the Rietveld refinement of the LaB6 standard sample is
0.10285 nm.25,26)The camera-length estimated from
relation-ship between the moving angle and the interval of direct spots is 479.88 mm. Then, the measured angular range is from about 30 to about 70 since the recording range on the IP
plate is 400 mm.
The solidification process was confirmed by two kinds of techniques: (i) Spatially-Resolved X-Ray Diffraction (SRXRD) for the liquid-tin quenched metals of weld. (ii) Time-Resolved X-Ray Diffraction (TRXRD) for the weld metal continuously heated and cooled in welding thermal cycle. The SRXRD technique is a post weld characterization method using synchrotron radiation, while the TRXRD technique is anin-situweld observation.
2.1 SRXRD for the liquid-tin quenched weld metals
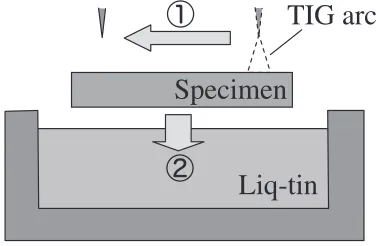
In the liquid-tin quenching method, liquid tin at 300C was
poured over the solidifying weld pool to quench the solid-ification behavior of the alloy, as shown in Fig. 1. The TIG arc welding with the current of 100 A, arc voltage of 150 V and welding speed of 2.5 mm/s was conducted on the surface of test pieces (4.0 mm thick, 50 mm wide and 100 mm long). Metallographic work was performed at the weld center, near the surface so that the solidification rate of the observed region was equivalent to the welding scan speed. An aqueous solution of 30 vol pct nitric acid and 10 vol pct hydrochloric acid was used as an etchant to reveal the microstructure. Then, SEM observation was performed with the energy dispersive X-ray analysis (EDX).
In the SRXRD, the diffraction profiles were continuously recorded with the IP, at each distance from the weld pool. The position of the weld pool of quenched metal corresponds to the arc position. The distance from the weld pool corresponds to the cooling temperature distribution. The focused monochromatic beam was passed through 30
200mm slit, at an incident angle of 20. The direction of
30mmwidth is parallel to the crystal growth direction on the specimen, in which steep thermal gradients exists.
2.2 TRXRD for the weld metal continuously heated and
cooled in welding thermal cycle
In the TRXRD, the time series transition of the diffraction patterns in the solidification process of welding was measured. The welding torch was vertically moving to an X-ray incident beam. The experimental set-up is summarized schematically in Fig. 2. The recording by the IP camera was synchronized with the moving of the arc torch, at the scan speed of 1.5 or 1 mm/s. During welding, the IP was also moved parallel to the scan direction of the arc torch and took diffraction profiles continuously. Moreover, a black sheet was pasted in front of the IP slit because the diffraction pattern on the IP had been erased by the fluorescence of welding arcs. The solidification speed is controlled by the arc power and the scan speed of the torch. The power was maintained constant at 1.5 kVA (150 A, 10 V) for all of the welds, and high pure argon was used as a shielding gas. The rising temperature on the back of the specimen was prevented by a water-cooled copper plate. In addition, the temperature of the weld metal was measured continuously by the thermocouple in order to associate it with the diffraction profiles on the IP. The welding assembly (torch and base material) were tilted at 20 angle with respect to the
horizontal direction to prevent blocking of the diffracted X-rays. The 9-mm-wide fusion zone was formed on the surface of the steel plate. The focused monochromatic beam size was set wide: thew100l300mm, and it make possible to obtain the week X-ray intensity in the initiation of solidification.
3. Results and Discussion
3.1 SRXRD
In order to elucidate the transition of microstructures, the diffraction pattern for solidification microstructure quenched
Liq-tin
TIG arc
Specimen
Fig. 1 Schematic illustration of quenching solidification method of weld metal using liquid-tin. The experimental procedure is as follows; at first, TIG arc welding with the current of 100 A, arc voltage of 150 V and welding speed of 2.5 mm/s was conducted on the surface of test pieces with 4.0 mm thick, 50 mm wide and 100 mm long. Then the test piece was rapidly dropped into liquid tin bath heated at about 473 K when TIG arc reaching to the center of the specimen.
Water-cooled copper plate IP slit (2.5mm) IP scan
Arc Torch scan (~1mm/s)
Synchrotron radiation (12KeV)
Power:10V, 150A
=20° θ
Cooling water To cooling tower
50°
Specimen (12mmt)
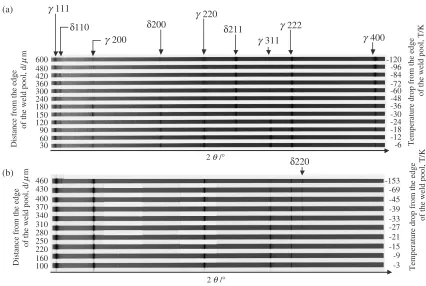
[image:2.595.306.546.66.234.2] [image:2.595.73.261.586.709.2]by liquid-tin was measured at each distance from the weld pool. Therefore, each distance from the weld pool corre-sponds to the temperature distribution during welding. The microstructure transition in the solidification process can be determined by measuring the diffraction profile as a function of the distance from the edge of the weld pool. The microstructure for the welding is a directional solidification that the dendrites mainly grows up to the h001i direction, toward a heat spot. Thecircle was fluctuated to exclude the influence of the preferred orientation of crystal by the directional solidification as much as possible. Figure 3 shows the change of the diffraction profile for the (a) FA mode and the (b) AF mode in each distance from the edge of the weld pool. The left axes are distance from the edge of the weld pool. The temperature drop from the edge of weld pool was derived using the relationship between the temperature and the elapsed time that were pre-examined experimentally as shown in the right axis.30) The horizontal axis is the
diffraction angle from about 30 to about 70. The interval
of diffraction angle at the horizontal axis is unequal and extends gradually toward the edge of the IP because IP was arranged in the flat. The Bragg peaks for each phase were calculated using the lattice constant refined by the Cohen’s analytical method; 0.286 nm for the body centered cubic (bcc) phase and 0.358 nm for the face centered cubic (fcc) phases.31)Here, it should be noted that changes of the lattice constant are unable to observe by X-ray diffraction for liquid-tin quenched because steep thermal gradients exist in the material.
As the result of the FA mode shown in Fig. 3(a), the
phase (fcc) andphase (bcc) were identified. The diffraction
peaks in the normal toh001isuch as200and110naturally appear since the primary phase grows up to h001i. Furthermore, the diffraction peaks of the primary phase and the secondary phase have coexisted at 30mm suggest-ing crystallization of the secondary phase within a temperature drop less than 6C. Therefore, the secondary
phase is mainly eutectic of h001i== h001i from the coexistence of200 and200. Moreover, the diffraction of
111,222, and311also appears in the early stage of the solidification. Appearance of these diffractions attributes to the fluctuation in the incident to ½110 and½310
respec-tively as ½001 is assumed to be a direction of the crystal
growth. It means that the dendrite which approximated by the rotation projectile grows towards toh001ias radius direction
h100i,h110iandh310i. That is, it is considered that the radius
vector of the eutectic turns without restraint, in the initiation stage of the solidification. These diffraction intensities decrease gradually as the solidification progresses. In con-trast, the diffraction intensities of 112and 400 increase gradually from 90mm. It should be noted that these diffraction peaks almost agreed to 110== 111, which is known as the K–S relationship rotating of112== 400 by 54.7. Consequently, the appearance of the K–S relationship
corresponds to (i) the growth by peritectic reaction ofphase on the primaryphase and (ii) the solid phase transformation from phase to phase after the competitions between the dendrites of phase and phase that have grown by the eutectic. Since the phenomena occurred at comparatively low temperature and the diffraction intensity of eutectic decreas-ed, it is considered that the solid phase transformation is ultimately predominant. To the above-mentioned, the for-111
δ110
200
δ200
220
δ211 222
400 311
γ
γ
γ
γ
γ γ
30 60 90 120 150 180 240 300 360 420 480 600
Distance from the edge of the weld pool, d/
(a)
-6 -12 -18 -24 -30 -36 -48 -60 -72 -84 -96 -120
δ220
100 160 220 250 280 310 340 370 400 430 460
(b)
Temperature drop from the edge
of the weld pool, T/K
-3 -9 -15 -21 -27 -33 -39 -45 -69 -153
Temperature drop from the edge
of the weld pool, T/K
Distance from the edge of the weld pool, d/
2 /°
2
θ
θ/°
µ
m
µ
m
Fig. 3 Change of the diffraction profile for (a) the FA mode and (b) the AF mode in each distance from the edge of the weld pool. The left axes are distanced from the edge of the weld pool. The temperature drop from the edge of weld pool was converted from a left axis by the relationship between the temperature and the elapsed time that were preexamined experimentally as shown in the right axis.
[image:3.595.83.509.71.357.2]mation of the more stable coherent interface becomes predominant with the solidification progress after the nucleus was arbitrarily generated and grown from the liquid phase in the early solidification.
On the other hand, in the AF mode as shown in Fig. 3(b), the diffraction peak of the secondary220phase appeared in the temperature drop of about 20C and this indicates the
preferred orientation ofh110i. This means that the growth of the secondaryphase is predominant to theh001idirection. That is, it is expected that thephase is also a eutectic in the AF mode. Moreover, the crystallization of the secondary
phase is delayed compared with that in the FA mode. In order to correspond to the extension of the ductility decrease temperature range (BTR), the delay of the crystallization for the secondary phase may correspond to the fact that the solidification crack in the AF mode is sensitive compara-tively than that in the FA mode.32) The K–S relationship appeared in the FA mode was not observed in the AF mode. These results correspond to the result of the microstructure observation by the scanning electron microscope (SEM) and the simulation of the numerical model.30)
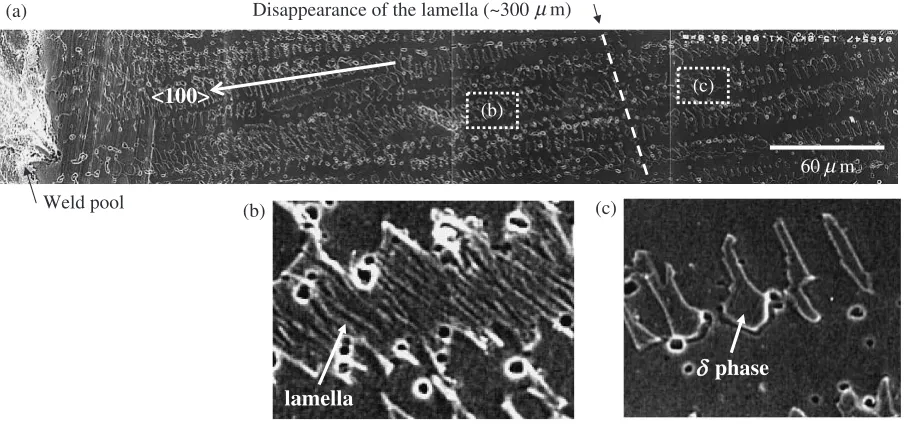
Figure 4 shows the example for the SEM observation of the AF mode austenite system measured in Fig. 3(b). The weld pool at the high temperature is on the left hand side in Fig. 4(a). The dendrites grow up to the left hand side in Fig. 4(a) at the low temperature. The lamella is observed between dendrites of the primaryphase, until 300mmfrom the edge of the weld pool. The microstructure of the lamella relates with the liquid phase in the quench process.33,34)
Therefore, it means that the secondary phase has not appeared yet. Such solute partitioning during solidification can lead to the micro-segregation and to the formation of non-equilibrium phases at the latter stages of the solid-ification. Such Scheil-like behavior is common in welds. On the other hand, the crystallization of phase from 300mm
could be confirmed by the disappearance of the lamella and
chromium detection by EDX. Naturally, these results correspond to those of the X-ray diffraction. These results for the growth mode of the secondary phase may also correspond to those of the microstructure observation of the liquid-tin quenched metal by Inoueet al.11,12)
3.2 TRXRD
In order to observe the crystal growth of the primary phase in detail, the directional microstructure transition under the rapid cooling was dynamically measured using the original TRXRD technique for welding. The diffraction pattern was continuously measured on the IP during welding. It was difficult to simultaneously observe the primary phase and the secondary phase under the large crystal preferred orientation and eutectic growth of the secondaryphase as indicated by the results of the SRXRD. Therefore, the diffraction pattern of the phase measured with¼ 30
was multiplied with that of the phase measured by the
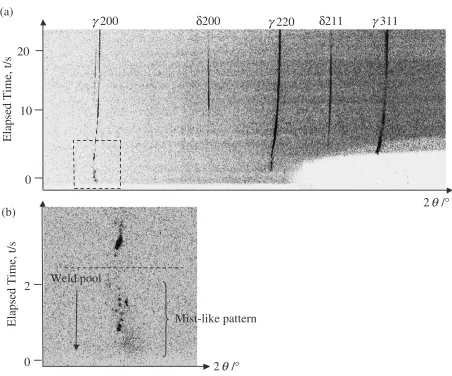
¼30at the same specimen. Figure 5 shows the change of the diffraction pattern for the primary phase and the secondary phase in the AF mode austenite system. The normal axis is the elapsed time that the torch leaves the measuring point. It also corresponds to the temperature of weld metals that is measured during welding. The horizontal axis is the diffraction angle on the IP arranged in a flat as well as a spatially resolved X-ray diffraction. The bright contrast at a high angle in the early solidification in the figure is the shadow of the torch. The elemental composition of the measured specimen is identical with that measured in Fig. 3(b).
As shown in Fig. 5(a), the curved diffraction patterns of the primaryphase are observed in the solidification process, suggesting the enhancement of the crystallinity. This phe-nomenon was not observed in the results of the spatially resolved X-ray diffraction as shown in Fig. 3. It is impossible to catch the crystallinity in the microstructure after the
60µm
Weld pool
Disappearance of the lamella (~300
<100>
(c)(b)
(a)
(b) (c)
δ
phase
lamella
µm)
[image:4.595.74.526.75.287.2]solidification like liquid tin quenched metal as suspected. In contrast, the curvature of the diffraction profiles is not observed in the secondaryphase though the crystallinity of
phase enhances greatly even after the appearance of211. It is considered that the growth-mode and the thermal ex-pansion of two phases greatly affect the displacement of the lattice spacing. That is, it is difficult for the secondary phase to grow up epitaxially at the high temperature that the lattice spacing of the primary phase changes greatly. Therefore, the eutectic growth of the secondaryphase may be probable in the AF mode. Next, the diffraction pattern of 200 in the vicinity of the weld pool is shown in Fig. 5(b). The diffraction pattern of random spots in the weak broad pattern like mist was observed before the crystal growth of dendrites as indicated in Fig. 5(b). The contrast of the random spots is considered to correspond to the blink of diffraction intensity due to rotation of the isometric crystallite that would become the nucleus for dendrites. Further, a weak broad pattern like mist at high temperature would be considered to correlate with the nucleation. That is, the phenomena in the vicinity of the critical nucleus may be observed averagely as weak broad patterns that are scattered by the wide distribution of the lattice spacing and the atomic distance. The lattice spacing of
the random spot pattern of200is about 0.129 nm. It should be noted that this lattice spacing corresponds to about twice the ionic radius of Fe. Therefore, the possibility of weak bonding like an ionic bond is suggested in the early stage of the solidification. After the crystal growth of dendrites, the diffraction pattern changed into the curve with the elapsed time as shown in Fig. 5(a).
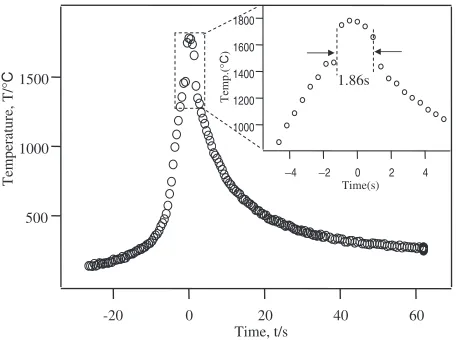
Next, the result of the temperature measurement is shown in Fig. 6. The horizontal axis is the elapsed time that the torch leaves the measuring point, and the normal axis is the temperature. This distribution is one of cases that the thermocouple did not react with molten steels and contacted enough with molten steels. Consequently, the steep thermal gradient in a temperature, rising and cooling, was observed. Further, two discontinuous points are observed in the profile at high temperature. This time spacing is 1.86 seconds at the torch scan speed of 1.5 mm/s. It is considered to be the temperature distribution in the weld pool in order to correspond to the temperature in the weld pool from 1500 to 1800C.35)
Figure 7 shows the time series transition of the micro-structure for the primary phase in the AF mode with the temperature measured in Fig. 6, in detail. The changes of the
Elapsed Time, t/s
0
20
10
Weld pool
200
220
311
γ
δ
200
γ
δ
211
γ
(a)
(b)
2
θ
/
°
2
θ
/
°
0
2
Mist-like pattern
Elapsed Time, t/s
Fig. 5 Change of the diffraction pattern for the primaryphase and the secondaryphase in the AF mode austenite system. The normal axis is the elapsed time that the torch leaves the measuring point. The horizontal axis is the diffraction angle on the IP arranged in a plane as well as the spatially resolved X-ray diffraction. The rectangular in Fig. 5(a) is extended in Fig. 5(b).
[image:5.595.71.523.69.445.2]diffraction pattern for200and220is shown in Fig. 5. The horizontal axis is the elapsed time that corresponds to the normal axis in Fig. 5, and the normal axis is the lattice spacing that corresponds to the horizontal axis in Fig. 5. The upper part of the normal axis is a low angle side. The zero second means the location of the center in the weld pool that has the highest temperature of about 1800C due to the
temperature distribution in Fig. 6. The temperature in the figure indicates the maximum diffraction intensity. Conse-quently, the weld pool/matrix interface is about 1630C, and
the crystal growth of the dendrites starts from about 1410C.
Furthermore, the maximum diffraction intensity of200and
220 appears periodically from 1400 to 800C in each
pattern and the maximum of the diffraction intensity of200
appears between those of220. The lattice rotation under the rapid cooling is expected. These phenomena are considered the rotation that centers on the growth direction of dendrites or the vibration of the tip of dendrites in the normal to the
[image:6.595.56.284.71.241.2]growth direction. This may be also corresponded to the lattice rotation suggested by the spatially resolved X-ray diffraction. Figure 8 shows the temperature dependency of the lattice constant and the multiplied fluctuation angle. The rotation of dendrites was defined as a multiplied fluctuation angle. Here, the multiplied fluctuation angle was assumed to have a rotation from 200 to 220 as expected from the exper-imental result. The discontinuous point of about 1400C is
considered to be due to the crystallization of the primary
phase. Afterwards, the multiplied fluctuation angle is synchronized with the displacement of the lattice constant. That is, the crystallinity enhances the accompanying of the lattice rotation. Here, one idea of the lattice rotations under rapid cooling is known as the edge dislocation model in the crystal growth.36) Due to the edge dislocation model, an
excess vacancy in the thermal equilibrium state is super-saturated under cooling quickly from high temperature, they cohere, and the secondary defect of the dislocation etc. is generated. Moreover, the crystal grains to cancel the disadvantage of the surface energy are rotated. As a result of the edge dislocation, it generates the microstructure with the high density edge dislocation that is known as the Lineage structure and the striation with the gap angle of crystals.37,38) We are in process of considering the crystallites’ rotation in the dendrites under rapid cooling, based on the Lineage structure. To the above-mentioned, the possibility of the lattice rotation of the primary phase in the AF mode is suggested in order to commensurate (i) each dendrite and (ii) the crystallites in the dendrites. We are carrying out investigations into crystal growth in detail with the informa-tion of nucleainforma-tion using a two dimensional detector with high time resolution excluding the influence of the preferred orientation of crystal. Further, in order to measure the temperature distribution, we will perform the simultaneous temperature measurement by the thermocouple and the high speed radiation thermometer for the high reliability to characterize the weld.
4. Conclusion
The directional crystal growth in the rapid solidification
1.86s 1500
1000
500
Temperature, T/
°
C
60 40
20 0
-20
Time, t/s
1800
1600
1400
1200
1000
Temp.(
°
C
)
−4 −2 0 2 4
Time(s)
Fig. 6 The temperature distribution of the fusion zone measured with the diffraction profiles using the thermocouple. The horizontal axis is the elapsed time that the torch leaves the measuring point, and the normal axis is the temperature.
1630°C
1410°C
1220°C
1060°C
940°C
970°C
1080°C
890°C
830°C
(a)
(b)
Weld pool
d/nm
d/nm
Elasped time, t/s
60 50 40 30 20
x10
3
Fig. 7 The relationship between the diffraction pattern of thephase and the temperature. (a)200and (b)220shown in Fig. 5. The horizontal axis is the elapsed time that corresponds to the normal axis in Fig. 5, and the normal axis is the lattice spacing that corresponds to the horizontal axis in Fig. 5. The upper part of the normal axis is a low angle side. The temperature in figure indicates the temperature of a maximum value of the diffraction intensity.
Solidification of γphase 0.367
0.366
0.365
0.364
0.363
0.362
0.361
Lattice constant, d/nm
1400 1200 1000 800 600 Temperature, T/°C
250
200
150
100
50
0
Multiplied fluctuation angle (a.u.)
[image:6.595.312.542.74.215.2] [image:6.595.54.285.317.467.2]process was caught using the Spatially-Resolved X-Ray Diffraction method for post weld characterization and Time-Resolved X-Ray Diffraction method for in situ weld observation.
The following findings were obtained from the observation of the phase transformation in the rapid solidification process during welding.
(1) In the ferritic-austenitic solidification mode,andare mainly eutectic in first stage and peritectic in the late stage.
(2) In the ferritic-austenitic mode, the second phase appears until there is a temperature drop of 6C.
(3) In the austenitic-ferritic solidification mode,andare eutectic in the first stage.
(4) In the austenitic-ferritic solidification mode, the second phase appears at a temperature drop of about 20C. (5) The primaryphase generates the nucleus up to about
1450C in the ferritic-austenitic solidification mode,
and the dendrites grow up with the enhancement of the crystallinity from about 1400C.
(6) The possibility of the lattice rotation of the primary
phase in the austenitic-ferritic solidification mode is suggested in order to commensurate (i) each dendrite and (ii) the crystallites in the dendrites.
Acknowledgements
The author would like to express their thanks to Mr. Inoue and Mr. Miyabe at Sumitomo Metals Industries, Ltd. for the technical support. The synchrotron radiation experiments were performed at the Spring-8 with the approval of the Japan Synchrotron Radiation Research Institute (JASRI) (Proposal No. 2004A0257-NI-np-TU).
REFERENCES
1) Y. Arata, F. Matsuda and S. Saruwatari: Trans. JWRI.3(1974) 79–88. 2) Z. Sun: Mater. Sci. Eng. A154(1992) 85–92.
3) S. A. David, J. M. Vittek and T. L. Hebble: Weld. Res. (1987) 289s– 300s.
4) V. Shankar, T. P. S. Gill, S. L. Manan and S. Sundaresan: Sadhana28
(2003) 359–382.
5) J. C. Borland: Br. Weld. J.7(1960) 508–512.
6) F. Matsuda, K. Nakata, K. Tsukamoto and T. Uchiyama: Trans. JWRI
13(1984) 57–66.
7) B. Mintz: Ironmaking & Steelmaking27(2000) 343–347.
8) Y. Kimura, Y. Mishima and C. T. Liu: Intermetall9(2000) 1069–1078.
9) K. C. Hwang, S. Lee and H. C. Lee: Mater. Sci. Eng. AA254(1998) 282–295.
10) S. Kou and Y. Le: Metal. Trans. A13(1982) 1141–1152.
11) H. Inoue, T. Koseki, S. Ohkita and T. Tanaka: ISIJ International35
(1995) 1248–1257.
12) H. Inoue, T. Koseki, S. Ohkita and M. Fuji: Sci. Technol. Weld. J.5
(2000) 385–396.
13) J. W. Elmer, J. Wong and T. Ressler: Metall. Mater. Trans. A23A
(2001) 1175–1187.
14) J. Wong, M. Froba, J. W. Elmer, P. A. Waide and E. M. Larson: J. Mater. Sci.32(1997) 1493–1500.
15) J. W. Elmer, T. A. Palmer, S. S. Babu, W. Zhang and T. Debroy: Weld. J.83(2004) 244–255.
16) S. S. Babu, J. W. Elmer, J. M. Vitek and S. A. David: Acta Materia.50
(2002) 4763–4781.
17) S. S. Babu, J. W. Elmer and S. A. David: Quintana MA, Proceedings of Mathematical, Phys. Eng. Sci.458(2002) 811.
18) S. A. David, S. S. Babu and J. M. Vitek: Miner. Meta. & Mater. Soc.55
(2003) 14.
19) B. Li, H. D. Brody and A. Kazimirov: Phys. Rev. E70(2004) 062602. 20) R. H. Mathiesen, L. Arnberg, F. Mo, T. Weitkamp and A. Snigirev:
Phys. Rev. Lett.83(1999) 5062–5065.
21) R. H. Mathiesen and L. Amberg: Acta Mater.53(2005) 947–956. 22) E. Folkhard: Welding metallurgy of stainless steels, (New York,
Springer, 1984), pp. 1.
23) Homepage of SPring-8,http://www.spring8.or.jp/e/.
24) A. Taniyama, M. Arai, T. Takayama and M. Sato: Mater. Trans.45
(2004) 2326.
25) R. A. Young:The Rietveld Method, (Oxford University Press, Oxford, 1995), pp. 1.
26) F. Izumi and T. Ikeda: Mater. Sci. Forum321–324(2000) 198–203. 27) T. Ichitani and T. Yaguchi: Microsc. Res. Technol.35(1996) 320–333. 28) R. M. Langford and A. K. Petford-Long: J. Vac. Sci. Technol. A19
(2001) 2186–2193.
29) J. P. McCaffrey, M. W. Phaneuf and L. D. Madsen: Ultramicroscopy87
(2001) 97–104.
30) T. Osuki, M. Yonemura, K. Ogawa, Y. Komizo and H. Terasaki: Preprints of the national meetings of Japan welding society76(2005) 24 [in Japanease].
31) B. D. Cullity and S. R. Stock: Elements of X-ray diffraction third edition, (Prenrice hall, New Jersey, 2001).
32) K. Nishimoto, S. Natsume, K. Ogawa and O. Matsumoto:Welding of stainless steels, (Sanpou, Tokyo, 2001).
33) T. Koseki and M. C. Flemmings: Metal. Mater. Trans. A27(1996) 3226–3240.
34) T. Koseki, T. Matsumiya, W. Yamada and T. Ogawa: Metal. Mater. Trans. A25(1994) 1309–1321.
35) K. Andou and M. Hasegawa:Phenomena of welding arc, (Sanpou, Tokyo, 1973).
36) A. Ohkawa:Crystal growth, (Syokabo, Tokyo, 1977).
37) S. V. Panin, V. E. Panin, V. G. Durakov and S. A. Belyaev: Trenie i Iznos24(2003) 71.
38) F. L. Vogel, W. G. Pfann, H. E. Corey and E. E. Thomas: Phys. Rev.90
(1953) 489–490.