First Principles Calculation of CO and H
2Adsorption on Strained Pt Surface
Akihide Kuwabara
1, Yohei Saito
2, Yukinori Koyama
2, Fumiyasu Oba
2,
Katsuyuki Matsunaga
1;2and Isao Tanaka
1;21
Nanostructures Research Laboratory, Japan Fine Ceramics Center, Nagoya 456-8587, Japan 2Department of Materials Science and Engineering, Kyoto University, Kyoto 606-8501, Japan
First principles calculations are carried out to analyze adsorption of CO and H2molecules on a Pt (111) surface and the effect of surface strain on the adsorption energy. A CO molecule is more adsorptive on the Pt (111) surface than a H2molecule under an ordinary condition. Surface expansion enhances CO poisoning on a Pt (111) surface. On the contrary, a compressive strain reduces adsorptive strength of a CO molecule. Similar tendency is also found in adsorption of a H2 molecule on the bridge, fcc-hollow, and hcp-hollow sites. However, H2 adsorption on the top site is less affected by the strain. As a consequence, the difference of adsorption energies between CO and H2molecules becomes smaller when compressive strain is introduced into the Pt (111) surface. Based on thermodynamics, surface coverage ratio is quantitatively evaluated with taking into account the effect of surface strain and partial pressure of gas phase. It is revealed that compressive strain improves probability of H2adsorption on Pt surface. [doi:10.2320/matertrans.MB200817]
(Received May 20, 2008; Accepted July 24, 2008; Published October 8, 2008)
Keywords: first principles calculation, metal surface, adsorption, electrode
1. Introduction
A polymer electrolyte fuel cell (PEFC) is expected as a clean source of electricity which can generate electrical power from H2 and O2 gases and emit only H2O.
Applica-tions of PEFC cover wide areas such as electric vehicles and mobile devices because of high density of electrical power and low working temperature. Several problems, however, should be solved before achieving commercialization of PEFC. Electrode is one of the most challenging tasks. Basically, Pt is used for both of anode and cathode sides of PEFC. At the anode side, H2gas is adsorbed on surfaces of Pt
electrode and is transformed into protons and electrons through catalysis promoted by Pt. A problem is caused by an impurity gas of CO the fuel gas contains. Even if contam-ination is the order of ppm, CO molecules almost fully cover the surface of Pt electrode and prevent H2 fuel gas from
reacting on Pt surface.1)Such loss of a catalytic function by a
CO gas is known as CO poisoning. Alloying of Pt with transition metals2)is mainly adopted as a method to improve resistance against CO poisoning. Recently, surface strain is studied as a new factor to control adsorption of gas molecules on metal surfaces.3–8) It is meaningful to understand the effect of surface strain on adsorption reaction because surface strain occurs by surface segregation in alloys.
A main purpose of the present study is to investigate the effect of surface strain on adsorption behavior in a metallic system. For a simple analysis, we are first focusing on adsorption of H2and CO molecules on a Pt surface.
2. Computational Methodology
2.1 Ground state calculation
Ground state calculation was carried out by VASP code9,10) based on density functional theory (DFT).11) Electron-ion interaction was represented by the projector augmented wave (PAW) method.12) The generalized gradient approx-imation (GGA)13)is chosen for formalism of the exchange-correlation term. Configurations of valence electrons are
5d96s1 for Pt,1s1 for H,2s2 2p2 for C, and2s2 2p4 for O.
Basis functions include plane waves up to kinetic energies of 400 eV.
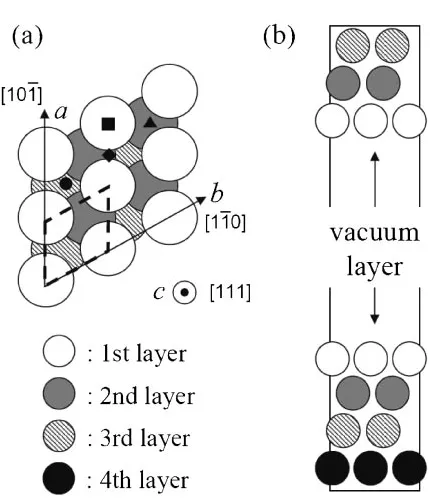
In the present study, a (111) surface of Pt is studied. Figure 1 shows our slab model. This model is 22 of a (111) surface primitive unit constructed from an optimized unit cell of Pt bulk (a¼3:977A˚ ), and includes 2 surfaces, 7 layers of Pt, and a vacuum layer with a thickness of 17 A˚ .
k point sampling in the Brillouin zone was based on the Monkhorst-Pack scheme14) and mesh size of the sampling was771. This set satisfies that convergence of calculated surface energy against number of sampling points becomes
Fig. 1 (a) A top and (b) side view of the Pt (111) slab model in this study. In the panel (a), a red broken line indicates a unit cell of the (111) plane. Adsorption sites of top, bridge, fcc-hollow, and hcp-hollow are shown as filled marks, , , and , respectively.
[image:1.595.319.534.319.568.2]lower than 1 meV/A˚2. Before adsorption, structural
relaxa-tion was carried out for a clean surface. In order to keep a bulk-like region in the slab model, atomic positions of 3 layers in the middle were always fixed during geometry optimization. Relaxation for a clean surface was stopped after that Hellmann-Feynman forces become smaller than 0.02 eV/A˚ . In calculations of adsorption, a molecule was put in a vacuum region with an initial distance of 2 A˚ between the molecule and the first layer of Pt surface. All atomic positions except the 3 layers in the middle of the slab were optimized with the same condition as that for the clean surface.
In order to analyze the effect of a surface strain on adsorp-tion behavior, strained-surface models were constructed. Lattice constants of a surface unit cell in the aandb direc-tions, [1011] and [1110] as is shown in Fig. 1, respectively, were simultaneously expanded (or shrunk) with the same strain,"."is given as
"¼l=l0 ð1Þ
wherel0is a lattice constant under an ordinary condition and lis a change in the length of the lattice constant. Strains in the [1011] and [1110] direction,"½1011and"½1110, vary from6% to +2% and"½1011 is always equal to"½1110. The stable lattice constant in thecdirection, [111], of the Pt (111) surface unit cell needed to be determined for each of strain in theaand
b directions. For this purpose, total energy calculations of several surface models with varying a distance between atomic layers were performed at a respective strain in thea
andbdirections. Figure 2 shows a relationship between"½111
and"½1011.
2.2 Adsorption Gibbs free energy and coverage ratio
Now, we are focusing on the following adsorption reaction of a gas species ofion a surface ofX,
vadsþiðgÞ !iads ð2Þ
vads is a vacant adsorption site on a surface and iads is an adsorbed species ofi. Fractions of the sites ofvads andiads, [vads] and [iads], can be represented by the adsorption Gibbs free energy per one adsorbate particle,Giads;X, as
½iads
½vads¼exp
Giads;X kBT
: ð3Þ
Derivation of eq. (3) is shown in Appendix section. Accord-ing to a limit of total site number,
½vads þX i
½iads ¼1: ð4Þ
We finally obtain coverage ratio byias
i¼
exp
G
i;X ads kBT
1þX
i
exp
G
i;X ads kBT
: ð5Þ
In eq. (5), [iads] is expressed as i. In order to evaluate a
surface coverage ratio, we have to know a value of Giads;X.
Giads;X is given by the following equation,
Giads;X ¼GXi ðGXsurfþG i
gasÞ: ð6Þ
GXi is a Gibbs free energy of a surface adsorbed by a gas
molecule (or atom). GX
surf andGigas are Gibbs free energies
of a clean surface and a gas molecule (or atom), respectively. In this description, adsorptive species shows negativeGiads;X. When adsorption strength becomes stronger,Giads;X becomes more negative. Equation (6) indicates thatGiads;X depends on a chemical potential of a gaseous phase. Assuming that the gaseous phase is an ideal gas,Gigas at a temperature (T) and a partial pressure (pi) is expressed as
Gigas¼Ggasðp;TÞ þkBTlnpi
p; ð7Þ
where G gasðp
;TÞ is a standard Gibbs free energy of the
gaseous phase at a temperatureTand a standard pressure p,
1 atm.G gasðp
;TÞcan be given by enthalpy and entropy as
Ggasðp;TÞ ¼Hgas ðp;0KÞ þHgas ðp;TÞ
TSðp;TÞ: ð8Þ
H
gasðp;0KÞandHgasðp;TÞare an enthalpy at 0 K and a
temperature dependence term of the enthalpy, respectively.
Sðp;TÞ is an entropy. In this study, we assumed that a
total energy of a gas molecule obtained by DFT calculation (Egasi ) can be substituted for H
gasðp;0KÞ. If the values of
Hgas ðp;TÞandSðp;TÞwere referred from the tables of thermochemical data,15)Gigasat any given temperatures and partial pressures of a gas phase can be obtained through DFT calculations. In the present study, GXi andGXsurf are
substituted for the total energies of DFT calculations using a slab model with clean and adsorbed surfaces, EXi and
EX
surf, respectively. Thus, the effects of vibrational entropies
for these terms are not taken into account on the assumption that temperature dependence of GXi and GXsurf are
neg-ligible compared to that of Gi gas. G
i;X
ads of eq. (6) can be
rewritten as
Giads;X ¼GXi
GXsurfþHgas ðp;0KÞ
þHgasðp;TÞ TSðp;TÞ þkBTln pi
p
¼
fEXi ðEXsurfþE i gasÞg
Hgas ðp;TÞ TSðp;TÞ þkBTln pi
p
: ð9Þ Fig. 2 A plot of elongation of atomic layer distance in the [111] direction
[image:2.595.67.273.69.245.2]The first term in eq. (9) is an energy difference between before and after adsorption, which can be obtained by DFT calculations. We simply call this term as ‘‘adsorption energy’’. It should be emphasized that this term is distin-guished from the adsorption Gibbs free energy,Giads;X, in this study. The second term is temperature and partial pressure dependence in Gi
gas. Finally, we can simply express eq. (9)
as the following,
Giads;X ¼Eads,DFTi;X GigasðT;pÞ: ð10Þ
Giads;X is clearly dependent on a temperature and a partial pressure of a gas phase.iis affected by a temperature and
a partial pressure because of the dependence of Giads;X on these parameters.
3. Results and Discussion
3.1 Adsorption of a CO molecule
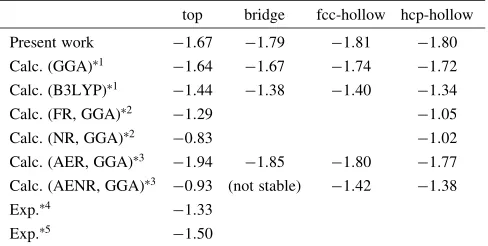
In the adsorption of a CO molecule on Pt (111) surface, the C atom side directly contacts with Pt surface. The direction of C-O bonding is vertical to the (111) plane of Pt. Table 1 summarizes our results of adsorption energy of a CO molecule (ECO,Ptads,DFT) on different adsorption sites. From the viewpoint of symmetry, there are 4 different adsorption sites on Pt (111) surface as shown in Fig. 1. They are called as ‘‘top’’, ‘‘bridge’’, ‘‘fcc-hollow’’, and ‘‘hcp-hollow’’. In the experiment, the top site is the most stable site for CO adsorption.20) However, our calculation shows that the hollow site is the lowest adsorption energy. Similar contra-dictions have been widely reported in the DFT study about CO adsorption on Pt surface.21)Kresseet al. have recently
reported that preference of CO adsorption on Pt surface can be correctly predicted by the GGAþU method.22) Their
calculation reveals that the energy gap between the highest occupied molecular orbital (HOMO) and the lowest unoccu-pied molecular orbital (LUMO) of a CO molecule should be accurately estimated for CO adsorption on a Pt surface. Doll has proposed a similar conclusion through hybrid functional calculations.16) Philipsen et al. compared relativistic and
non-relativistic calculations based on a frozen core approx-imation. As is shown in Table 1, they found that relativistic calculation is successful to reproduce preference of CO adsorption on Pt similar to experiments.17)Orita et al.also
performed all electron relativistic (AER) calculation and have concluded that lower Fermi energy in AER calculations is attributed to the correct estimation of the site dependence of CO adsorption.23)Failure in preference of adsorption site
by the ordinary DFT calculations is thought to result from the overestimation of interaction between Pt 5d state and 2
orbital, which is the LUMO, of a CO molecule. Accurate prediction of adsorption site of CO molecule is beyond our main purpose in the present article. The calculated adsorption energy at the top site has an error of 0:170:34eV in comparison with experimental reports.18,19) With regard to CO adsorption, we focus only on CO adsorption at the top site in the latter part of this article.
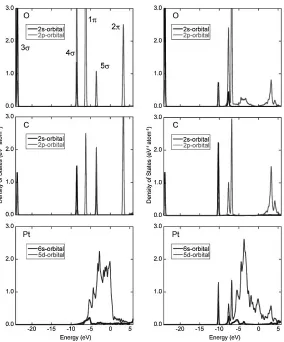
Figure 3 shows projected local density of states (DOS) of C, O, and Pt atoms at the 1st layer of a slab obtained from Pt slab models including a CO molecule. The CO molecule is put into a vacuum layer far from the surface and is adsorbed on the top site of a Pt (111) surface in Fig. 3(a) and (b), respectively. With regard to Fig. 3(b), only the DOS of the Pt atom bound with the C atom are shown. Fermi energy is set to be 0 eV in these graphs. As shown in Fig. 3(a), DOS from C and O atoms indicate strong localization and are overlapped with each other because they form molecular orbitals. These molecular orbitals are labeled as3,4,1,
5, and2from lower to higher energy.5and2are the HOMO and the LUMO, respectively, of an isolated CO molecule. No interaction can be found between the CO molecule and Pt substrate in Fig. 3(a) because the CO molecule is far away from the Pt surface in our clean-surface model. Absorption of the CO molecule on the Pt surface obviously changes DOS profiles. The orbitals of CO molecule hybridize with Pt 5d and 6s states. The hybrid-ization shifts4,1and5orbitals to lower energy. DOS of Pt have sharp peaks at the same energy as these orbitals of the CO molecule. With regard to the LUMO of2orbital, unoccupied states located at 3 eV become broaden due to interaction with Pt 5d. In addition, the 2 orbital has extra gap states between5to 0 eV.
3.2 Adsorption of a hydrogen atom
Our calculations show that a H2 molecule is always
dissociated into two H atoms on Pt surface through geometry optimization. This is independent on where H2 molecule is
initially located on a Pt (111) surface. Based on this result, adsorption of a hydrogen atom is alternatively calculated for the purpose of reducing calculation times related to disso-ciation of a H2molecule. Adsorption energy of a H2molecule
as expressed in eq. (10), EH2,Pt
ads,DFT, is calculated by the
following equation,
EH2,Pt
ads,DFT¼2EPt-H ðEPtþH2þEPtÞ; ð11Þ
whereEPt-H,EPtþH2, andEPtare the energy of a Pt slab with
an adsorbed H atom, a Pt slab with a H2 molecule in a
vacuum layer, and a pure Pt slab.
Table 2 shows calculated adsorption energies of a H2
[image:3.595.48.292.652.775.2]molecule on each of adsorption sites. Adsorption energies on the top, bridge, and hcp-hollow sites are almost same. The most stable adsorption site is the fcc-hollow site. This is coincident with the experimental result.27)As is mentioned before, the relativistic calculations are successful to evaluate
Table 1 Adsorption energy of a CO molecule on the Pt (111) surface. All of the values in this table are expressed by a unit of eV. FR, NR, AER, and AENR mean full relativistic, non-relativistic, all electron relativistic, and all electron non-relativistic calculations, respectively.
top bridge fcc-hollow hcp-hollow
Present work 1:67 1:79 1:81 1:80 Calc. (GGA)1 1:64 1:67 1:74 1:72 Calc. (B3LYP)1 1:44 1:38 1:40 1:34
Calc. (FR, GGA)2 1:29 1:05
Calc. (NR, GGA)2 0:83 1:02
Calc. (AER, GGA)3 1:94 1:85 1:80 1:77 Calc. (AENR, GGA)3 0:93 (not stable) 1:42 1:38
Exp.4 1:33
Exp.5 1:50
preference site of CO adsorption.17,23) With regard to H2
adsorption, Olsen et al. reported that their relativistic calculations have contradiction with the preferable site of hydrogen on Pt.25) Similar to the adsorption energy of a
CO molecule, the adsorption energy of a H2 molecule is
overestimated in comparison with an experimental report.26)
With regard to a difference of the adsorption energies between CO and H2 molecule, the value of our calculation,
0.64 eV, is fairly comparable to that of experiment, 0.55– 0.72 eV.
Figure 4 show projected local DOS of H and Pt atoms at the 1st surface layer before and after hydrogen adsorption on Pt (111) surface. The H2 molecule is put into a vacuum
region far from the surface in the model corresponding to Fig. 4(a). Adsorption site of a hydrogen atom is the fcc-hollow site. In Fig. 4(b), only the local DOS of the Pt atoms bonding with an adsorbed H atom are shown. Chemical
bonding changes in adsorption of a H atom seems to be simple compared to the adsorption of a CO molecule. When the H2molecule is far from Pt surface, there is a sharp peak
attributed to a bonding molecular orbital of H2 at around 4eV. After adsorption and dissociation into H atoms, the peak of H 1s shifts down to 8eV and becomes broader. This is due to hybridization with Pt5d and6s.
3.3 Strain effect on adsorption energy
Figure 5 shows dependence of the adsorption energy on surface strain. As shown in Fig. 5(a), the adsorption energy of a CO molecule obviously shows negative linear relation-ship to the surface strain. Compressive surface strain makes the adsorption energy of a CO molecule less negative, namely CO adsorption becomes weaker. With regard to adsorption of a H2molecule, compressive strain also reduces
adsorptive abilities on the bridge, fcc-hollow, and hcp-hollow sites. On the contrary, adsorption of a H2 molecule on the
top site is less affected by the strain. The most stable adsorption site for a H2 molecule changes from the
fcc-hollow to the top site when compressive strain is larger than 2%. As a result, the difference of adsorption energy between CO and H2 molecules (Eads) depends on the surface strain. Eads is defined as
Eads¼min½Eads,DFTH2,Pt E CO,Pt
ads,DFT: ð12Þ
As shown in Fig. 5(c), Eads are always positive values
[image:4.595.158.442.68.410.2]within a whole range of strain. Adsorptive ability of a CO
Table 2 Adsorption energy of a H2molecule on the Pt (111) surface. All of the values in this table are expressed by a unit of eV.
top bridge fcc-hollow hcp-hollow
Present work 0:97 0:94 1:03 0:95
Calc.1 0:90 0:98 0:90
Calc. (SR, GGA)2 0:42 0:33 Calc. (NR, GGA)2 0.19 0:09
Exp.3 0:78
1Ref. 24)2Ref. 25)3Ref. 26)
[image:4.595.44.293.480.556.2]molecule is always higher than a H2molecule. However, the
difference becomes smaller with increasing of compressive strain. Compressive strain is expected to suppress CO poisoning somehow.
In order to quantitatively estimate the effect of surface strain on CO poisoning, surface coverage ratio of CO
Fig. 4 Projected local density of states from Pt slab models (left side) with clean Pt surfaces and a H2molecule in a vacuum layer and (right side) with a H-adsorbed surface.
Fig. 5 Plots of CO adsorption energy,ECO,Pt
ads,DFT, H2adsorption energy, EH,Ptads,DFT, and difference between adsorption energies of CO and H2, EH,Ptads,DFTEads,DFTCO,Pt , to surface strain.
[image:5.595.137.459.72.324.2] [image:5.595.327.524.370.674.2] [image:5.595.75.266.373.746.2]molecules and H atoms,COandH, are evaluated by eq. (5).
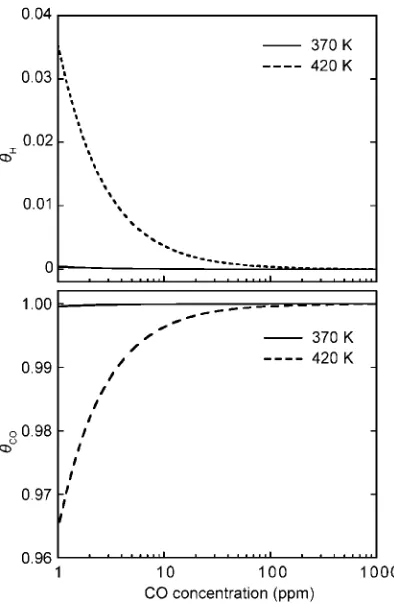
Figure 6 shows dependence ofHandCOon a concentration
of CO gas in an atmosphere at 370 and 420 K. The results are obtained from the calculations of slab models without surface strain. The partial pressure of H2 is set to be 1 atm.
Even if the CO concentration is 1 ppm, Pt surface is fully covered by CO molecules at 370 K. A higher temperature of 420 K slightly increases the coverage ratio of H atoms and the coverage ratio of H atoms reaches only 3.5% at most. Temperature effect seems to be negligible under the ordinary condition. Figure 7 is graphs of relationship betweenHand
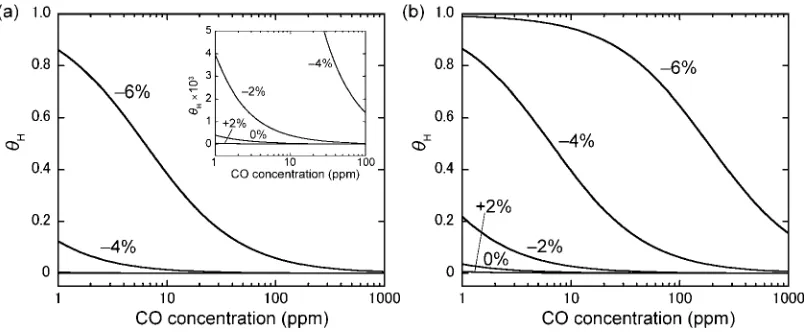
CO concentrations on strained Pt surfaces at 370 and 420 K.
Hincreases with increasing of compressive surface strains.
The compressive strain of 6% results inHof 40 and 80% at
CO concentrations of 10 and 1 ppm, respectively, at 370 K. If the temperature becomes 420 K,His more improved with
compressive strain on surface. The compressive strain is well effective to suppress CO-poisoning. Schalapka et al. has reported that hetero-epitaxial Pt layer grown on Ru(0001) becomes less reactive to CO molecules.28) They concluded
that compressive strain acting on Pt layer is attributed to decrease of CO adsorption. Our results are coincident with their experimental results.
Improvement of H by compressive strains is attributed
to decreasing adsorption energy, namely less negative
Eads,DFTCO,Pt . As mentioned before, the interaction between CO and Pt mainly results from hybridization of Pt 5d state with the 2 LUMO of a CO molecule. Needless to say, surface strain never affects the electronic structure of a CO molecule. Therefore, it is reasonable to suppose that weak-ening of CO adsorption is originated from the electronic state of the Pt surface. In Fig. 8, energy levels of weight centers of Pt 5d states in Pt clean surface models are plotted as a function of surface strain. The energy level of Pt 5d is measured from that of the2orbital of a CO molecule in a vacuum layer. Relative energy of the Pt5d to the2orbital has linear relation to the surface strain. The energy level of Pt
5dstate becomes deeper to the2orbital with compressive strain. A deeper Pt 5d state is unlikely to interact with the
2orbital. It can be supposed that down shift of Pt5dstates with surface compression leads to reduce the adsorption energy of a CO molecule on Pt surface.
4. Conclusion
Total energy calculations based on density functional theory have been performed to investigate adsorption mechanism of CO and H2 molecules on strained Pt (111)
surfaces. The influence of surface strain on the adsorption has been quantitatively estimated by surface coverage ratio of CO and H2 molecules. Our calculation reveals that a CO
molecule becomes less adsorptive on Pt surface when compressive strain is applied to the surface. Surface strain also affects adsorption of H2 similarly to the case of CO
except that the adsorption of H2 at the top site is less
influenced. As a result, difference of adsorption energy between CO and H2molecule become smaller with
increas-ing of compressive strain. The calculation of CO and H coverage ratio shows that Pt surface is fully covered by CO molecules under the ordinary condition. The phenomenon of CO poisoning is well reproduced. The surface ratio of H atoms is less than 0.1% even at 1 ppm CO in a gas phase. Compressive surface strain of 6% improve surface cover-age ratio of H2up to 40% under the condition of 10 ppm CO
and 100 K. The present results strongly indicate that surface
Fig. 7 Plots of H coverage ratio on strained Pt(111) surfaces to CO concentration in atmospheres at (a) 370 and (b) 420 K.
[image:6.595.324.528.288.460.2]strain is an important parameter to control adsorption of gas molecules on Pt surface.
Acknowledgment
This work was financially supported by the New Energy and Industrial Technology Development Organization (NEDO) of Japan.
Appendix
We consider a surface of metalXwhere a total number of adsorption site isN. Now,nsites are occupied by adsorbate particles of a gaseous speciesi. Thus, a number of free sites is Nn. Total difference of a Gibbs energy from a clean surface is
G¼nGadsi;X TSconf ðA:1Þ
Gi
adsis a Gibbs free energy to form one adsorbate particle of i on the surface ofX.Sconf is an entropy of configuration
and is given as
Sconf¼kBlnW; ðA:2Þ
where W is a number of configurations. When n sites is occupied and (Nn) sites is free, the number of config-uration is
W ¼ N!
n!ðNnÞ!: ðA
:3Þ
Sconfcan be expressed as
Sconf¼kBflnN!lnn!lnðNnÞ!g: ðA:4Þ
Equation (A·3) can be rewritten by the Stirling’s formula,
lnX!¼XlnXX, as
Sconf¼kB½NlnNN ðnlnnnÞ
fðNnÞlnðNnÞ ðNnÞg
¼kBfNlnN ðNnÞlnðNnÞ nlnng ðA:5Þ
Finally, eq. (A·1) becomes
G¼nGiads;X
kBTfNlnN ðNnÞlnðNnÞ nlnng ðA
:6Þ
If a thermal equilibrium condition is achieved, G as a function ofnhas a local minimum, namely@G=@n¼0.
@G
@n ¼G
i;X
adskBTln
Nn
n ¼0
n
Nn¼exp
Giads;X
kBT !
ðA:7Þ
Equation (A·7) can be expressed by fractions of occupied sites, [iads] (¼n=N), and of free sites, [vads] (¼ ðNnÞ=N),
as
n
Nn ¼
n=N ðNnÞ=N ¼
½iads
½vads ¼exp
Giads;X kBT
!
ðA:8Þ
REFERENCES
1) H. Igarashi, T. Fujino and M. Watanabe: J. Electroanal. Chem.391
(1995) 119–123.
2) H. Igarashi, T. Fujino, Y. Zhu, H. Uchida and M. Watanabe: Phys. Chem. Chem. Phys.3(2001) 306–314.
3) M. Mavrikakis, B. Hammer and J. K. Norskøv: Phys. Rev. Lett.81
(1998) 2819–2822.
4) M. Mavrikakis, P. Stoltze and J. K. Norskøv: Catalysis. Lett.64(2000) 101–106.
5) S. Sakong and A. Groß: Surf. Sci.525(2003) 107–118.
6) J. R. Kitchin, J. K. Norskøv, M. A. Barteau and J. G. Chen: Phys. Rev. Lett.93(2004) 156801.
7) R. Otero, F. Calleja, V. M. Garcı´a-Sua´rez, J. J. Hinarejos, J. de la Figuera, J. Ferrer, A. L. Va´zquez de Parga and R. Miranda: Surf. Sci.
550(2004) 65–72.
8) M. Tsukada and H. Kasai: Phys. Rev. B73(2006) 155405. 9) G. Kresse and J. Furthmu¨ller: Phys. Rev. B54(1996) 11169–11186. 10) G. Kresse and J. Furthmu¨ller: J. Comput. Mater. Sci.6(1996) 15–50. 11) W. Kohn and L. J. Sham: Phys. Rev. A140(1965) 1133–1138. 12) P. E. Blo¨chl: Phys. Rev. B50(1994) 17953–17979.
13) J. P. Perdew, K. Burke and M. Ernzerhof: Phys. Rev. Lett.77(1996) 3865–3868.
14) H. J. Monkhorst and J. D. Pack: Phys. Rev. B13(1976) 5188. 15) M. W. Chase Jr.: NIST-JANAF Thermochemical Tables 4th ed. (The
American Institute of Physics for The National Institute of Standards and Technology, New York, 1998).
16) K. Doll: Surf. Sci.573(2004) 464–473.
17) P. H. T. Philipsen, E. van Lenthe, J. G. Snijders and E. J. Baerends: Phys. Rev. B56(1997) 13556–13562.
18) E. G. Seebauer, A. C. F. Kong and L. D. Schmidt: J. Vac. Sci. Technol.
5(1987) 464–468.
19) H. Steininger, S. Lehwald and H. Ibach: Surf. Sci.123(1982) 264– 282.
20) M. O. Pedersen, M. L. Bocquet, P. Sautet, E. Laegsgaard, I. Stensgaard and F. Besenbacher: Chem. Phys. Lett.299(1999) 403–409. 21) P. J. Feibelman, B. Hammer, J. K. Nørskov, F. Wagner, M. Scheffler,
R. Stumpf, R. Watwe and J. Dumesic: J. Phys. Chem. B105(2001) 4018–4025.
22) G. Kresse, A. Gil and P. Sautet: Phys. Rev. B68(2003) 073401. 23) H. Orita, N. Itoh and Y. Inada: Chem. Phys. Lett.384(2004) 271–
276.
24) Y. Okamoto: Chem. Phys. Lett.405(2005) 79–83.
25) R. A. Olsen, G. J. Kroes and E. J. Baerends: J. Chem. Phys.24(1999) 11155–11163.
26) K. Christmann: Surf. Sci. Rep.9(1988) 1–163.
27) K. M. Lui, Y. Kim, W. M. Lau and J. W. Rabalais: Appl. Phys. Lett.75
(1999) 587–589.
![Fig. 2A plot of elongation of atomic layer distance in the [111] directionto a surface strain in a (111) plane.](https://thumb-us.123doks.com/thumbv2/123dok_us/344094.532529/2.595.67.273.69.245/elongation-atomic-layer-distance-directionto-surface-strain-plane.webp)