Influence of Cyclic Loading on Inhomogeneous Deformation Behavior Arising
in NiTi Shape Memory Alloy Plate
*1Go Murasawa
1;*2, Satoru Yoneyama
2, Toshio Sakuma
3and Masahisa Takashi
41
Department of Mechanical Engineering, Yamagata University, Yonezawa 992-8510, Japan
2Department of Mechanical Engineering, Osaka Prefecture University, Sakai 599-8531, Japan
3Department of Human Wellbeing and Assistive Engineering, Oita University, Oita 870-1192, Japan
4Department of Mechanical Engineering, Aoyama Gakuin University, Sagamihara 229-8558, Japan
The aim of present paper is the investigation of relationship between inhomogeneous deformation behavior and macroscopic deformation behavior arising in SMA during cyclic loadings. Firstly, a test system was constructed on the basis of Digital Image Correlation in order to measure inhomogeneous deformation behavior. Secondary, measurements of the inhomogeneous deformation behavior (local strain distribution) arising in 50.5Ni49.5Ti plate were tried during cyclic tensile loading–unloading in the region of pseudoelastic temperature. From some results, it is seen that the inhomogeneous deformation behavior sensitively changes according to the state of loadings (i.e., number of cycle, history of loading and so on). Also, the macroscopic deformation behavior for SMAs is strongly affected by the inhomogeneous deformation behavior. It is very important for application of SMA to investigate the relationship between macroscopic deformation behavior and inhomogeneous deformation behavior.
(Received August 22, 2005; Accepted December 15, 2005; Published March 15, 2006)
Keywords: NiTi shape memory alloy, pseudoelasticity, inhomogeneous deformation behavior, digital image correlation, cyclic loading
1. Introduction
Many fabrications, evaluations and applications have been conducted for shape memory alloy (SMA) since 1963.1–13) On new material field, NiTi alloy, Cu alloy, Fe alloy and so on have been developed as SMA. NiTi alloy is mostly used in these SMAs at the moment, and the studies about fabrication method of SMA have been conducted until now. On material evaluation field, considerable attention has been paid to the characteristics of SMA such as shape memory effect, pseudoelasticity and recovery stress.1–6)On application field,
European and American researchers tend to pay attention to Micro Electro Mechanical Systems (MEMS) as application of SMA.7) On the other hand, Japanese researchers are
seeking the usage of SMA in medical applications.
SMA shows the inhomogeneous deformation behavior like Lu¨ders band of steel or PLC effect of Al alloy.8–13) The deformation in the part where the inhomogeneous deforma-tion arises is very little for steel or Al alloy, but that of SMA is very large. Therefore, the effect of the inhomogeneous deformation behavior on macroscopic deformation behavior is remarkable for SMA. It is necessary for SMA to investigate the relationship between macroscopic deformation behavior and inhomogeneous deformation behavior.
In the present study, we attempt to investigate the relationship between inhomogeneous deformation behavior and macroscopic deformation behavior arising in SMA during cyclic loadings. The transition of macroscopic deformation behavior during cyclic loading has been well known for SMA since early times.14) Therefore, it is
considered that there exists the effect of cyclic loading on the inhomogeneous deformation behavior arising in SMA.
Firstly, a test system was constructed on the basis of Digital Image Correlation in order to measure inhomogeneous deformation behavior. Secondary, the measurements of the inhomogeneous deformation behavior (local strain distribu-tion) on NiTi plate were tried during cyclic tensile loading– unloading in the region of pseudoelastic temperature (60C) for this specimen.
From some experimental results, the inhomogeneous deformation behavior sensitively changes according to the state of loadings (i.e., number of cycle, history of loading and so on). Also, the macroscopic deformation behavior is strongly affected by the inhomogeneous deformation behav-ior. It is very important for application of SMA to investigate the relationship between macroscopic deformation behavior and inhomogeneous deformation behavior.
2. Material and Methods
2.1 Material
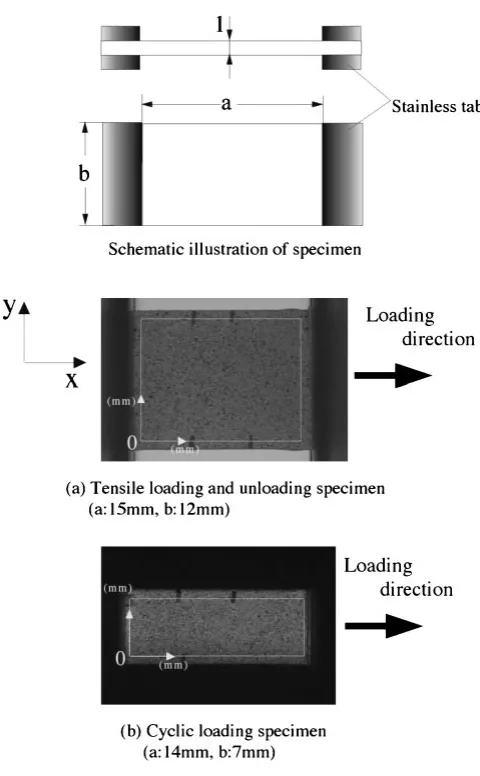
NiTi plate (50.5Ni49.5Ti [at%]) was used in the present study. Specimen configurations of NiTi plate were shown in Fig. 1. The heat-treatment for shape memory effect was given to this specimen for 30 min at 400C. Finish
temper-ature for Austenite transformation was about 50C after this
treatment. Random pattern was created on the surface of specimen by the spray of black and white in order to measure the displacement all over the surface of specimen by using Digital Image Correlation.15,16)
2.2 Measurement method of local strain distribution
The test system was constructed on the basis of Digital Image Correlation15,16) in order to measure the inhomoge-neous deformation behavior. The Digital Image Correlation is one of measurement methods that can measure the distribution of displacement all over the subject by using image processing. The test system can be divided broadly
*1This paper was Originally published in Japanese in J. Jpn. Inst. Met.69 (2005) 596–603.
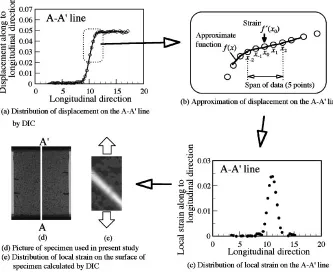
into three systems: (A) Image acquisition, (B) Digital Image Correlation (calculation of displacement), (C) Calculation of local strain. In the present study, the inhomogeneous deformation behavior arising in NiTi plate is evaluated from the local strain distribution. Figure 2 shows flow chart for whole process in Local Strain Distribution Measurement system. Also, the apparatuses used in each process are
[image:2.595.47.287.66.454.2] [image:2.595.112.482.596.770.2]specified in this figure. Firstly, the images used in Digital Image Correlation were taken at regular intervals during deformation of specimen [Fig. 2(A)]. Then, two images were selected every interval from the obtained images. Secondary, the displacement all over the surface of specimen can be calculated by comparing these two images (i.e., undeformed image and deformed image) in Digital Image Correlation [Fig. 2(B)]. Thirdly, the local strain all over the surface of specimen was calculated from the distribution of displace-ment [Fig. 2(C)]. The calculation method of local strain is following as shown in Fig. 3; (1) Approximate function of displacement–position of loading direction relation [Fig. 3(a)] is constructed from a result of Digital Image Correlation for one line on the surface of specimen. Approximate function is constructed within before and after 2 points of the points that you would like to calculate local strain [Fig. 3(b)]. (2) Local strain is mathematically calcu-lated from the approximate function obtained for all points [Fig. 3(c)]. (3) Distribution of local strain can be calculated by doing similarly for other several line on the surface of specimen [Fig. 3(e)]. These systems are constructed by using LabVIEW (National Instrument Co.). The inhomogeneous deformation behavior arising in material can be measured easily by using this system.
2.3 Experimental methods
Firstly, tensile loading up to just after stress induced martensite transformation and the subsequent unloading were performed for NiTi plate in the region of pseudoelastic temperature (60C). Furthermore, thermo-mechanical train-ing (tensile loadng, unloadtrain-ing and heattrain-ing up to finish temperature for Austenite transformation) was given to specimen before starting the loading and unloading test in order to stabilize the deformation behavior of NiTi. Secon-dary, cyclic tensile loading and unloading were performed in the region of pseudoelastic temperature (60C). In this test,
unloading was performed in the middle of stress induced martensite transformation during tensile loading. The number of cycles was 20 cycles. The mechanical loadings were performed at strain rate 0.5%/min. The test temperature was held with an environmental chamber. The images of speci-men were taken every 40 s during the mechanical loading.
Fig. 1 Schematic illustrations of NiTi plate and loading direction.
Fig. 2 Calculation of distribution of displacement and local strain by using Digital Image Correlation.
3. Results
3.1 Macroscopic stress–strain curve and
inhomogene-ous deformation behavior arising in NiTi plate
Figure 4 shows the macroscopic stress–strain curve of NiTi plate obtained from the tensile loading and unloading tests in the region of pseudoelastic temperature. As shown in this figure, NiTi plate shows the following deformation behavior in the tensile loading process: (1) Elastic deforma-tion of austenite phase (initial elastic region in stress–strain curve), (2) Deformation due to stress induced martensite transformation (flat region in stress–strain curve), (3) Elastic
deformation of stress induced martensite phase (second elastic region region in stress–strain curve). Also, the deformation behavior in the unloading process is following: (1) Elastic deformation of stress induced martensite phase, (2) Deformation due to austenite transformation, (3) Elastic deformation of austenite phase.
Next, the inhomogeneous deformation behaviors arising in NiTi plate during tensile loading and unloading are measured by using the measurement system for the inhomogeneous deformation behavior. Images are taken at each point within both process of 0–30 and 00–200in macroscopic stress–strain
curve. Time span between each point is 40 s. The inhomoge-neous deformation behavior arising in NiTi plate is evaluated from incremental local strain distribution at each point. The start point of propagation of phase transformation is indicated with arrows 1 and 2 in stress–strain curve. Also, the picture of specimen, calculated local strain area and loading direction are shown in Fig. 1(a). Figures 5 and 6 indicate local strain distribution on NiTi plate under tensile loading and unload-ing for each deformation stage in stress–strain curve. Horizontal and vertical axes show position of x and y
direction in Figs. 5 and 6, and local strain level can be perceived from the scale level in Figs. 5 and 6. As shown in Figs. 5 and 6, it is found that NiTi plate shows uniform deformation all over the surface of specimen under elastic deformation of austenite phase [(a) in Fig. 5]. Then, the inhomogeneous deformation behavior (namely, the nuclea-tion and propaganuclea-tion behavior of local strain) is observed to be generated during stress induced martensite transformation [(b) and (c) in Fig. 5]. This transformation propagates from the both ends to the center of the specimen. Also, the transformation propagates with a fixed angle against the loading direction of the specimen. Furthermore, NiTi plate
Fig. 3 Method of calculating distribution of local strain from distribution of displacement.
0 100 200 300 400 500
0 0.02 0.04 0.06 0.08 0.1
Strain
10
5
15 20
25 30
0’
5’ 10’ 15’
20’
t=40s ∆ =0.0033
NiTi plate
T=60°C(PE region)
Start point of propagation of phase transformation
Stress (MPa)
ε
[image:3.595.128.461.75.347.2] [image:3.595.52.291.392.588.2]shows uniform deformation after stress induced martensite transformation [(d) in Fig. 5]. On the other hand, a few differences are observed during unloading as compared with during tensile loading: The austenite transformation, also, propagates from the both ends to the center of the specimen as observed in the stress induced martensite transformation. However, the fixed propagating angle of austenite trans-formation (55.4 from tensile direction) has symmetrical
angle with that of stress induced martensite transformation (55:2 from tensile direction) as shown in Figs. 5 and 6.
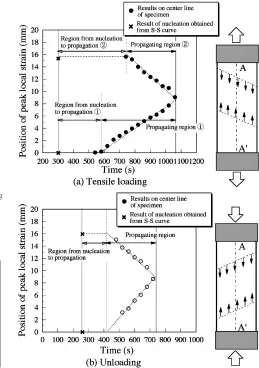
Figures 7(a) and (b) show position of peak local strain– time relation for the middle line (A–A0 line) on specimen
under tensile loading and unloading. Also, schematic illustrations of phase propagation are shown in Fig. 7. Symbol mark shows the nucleating point of phase transformation obtained from stress–strain curve. Symbol marks and show the peak points of local strain in each process of tensile loading and unloading. As shown in Figs. 7(a) and 4, it is found that the transformed phase propagation starts at the beginning point of flat region in stress–strain curve. The deformation generated at a position
of nucleation continues to increase until the phase trans-formation starts to propagate. The start point of phase propagation is different between upper and lower end of specimen as shown in Fig. 7(a). On the other hand, the region from nucleation to propagation of austenite transformation is smaller than that of stress induced martensite transformation. Also, the austenite transformation simultaneously propagates from the both end to the center of specimen. The average propagating speeds of phase transformation are 0.018 mm/s during tensile loading (stress induced martensite transforma-tion) and 0.026 mm/s during unloading (austenite trans-formation), respectively.
3.2 Influence of cyclic loading on inhomogeneous
[image:4.595.46.549.69.462.2]defor-mation behavior arising in NiTi plate
Figure 8 shows the macroscopic stress–strain curves of NiTi plate obtained from cyclic loading test (20 cycles) in the region of pseudoelastic temperature. Results of 1st, 2nd and 20th cycle are included in this figure. It is seen from Fig. 8 that the stress–strain curves change with increasing number of cycle, for example, stress level during stress induced martensite transformation decreases with increasing the number of cycle and so on. Also, the stress–strain curve shows steady state at about 20th cycle.
0 1 2 3 4 5 6 7 8 9 10 11 12
1 2 3 4 5 6 7 8 9 10 11 1213 14 -0.01 -0.005 0 0.005 0.01 0.015 0.02 0.025 0.03
0 1 2 3 4 5 6 7 8 9 10 11 12
1 2 3 4 5 6 7 8 9 10 11 1213 14 0
1 2 3 4 5 6 7 8 9 10 11 12
1 2 3 4 5 6 7 8 9 10 111213 14 0 1 2 3 4 5 6 7 8 9 10 11 12
1 2 3 4 5 6 7 8 9 10 11 1213 14
(c) 26-27 (d) 28-29
x direction (mm)
y direction (mm)
(a) 7-8 (b) 21-22
Fig. 5 Distribution of local strain on the surface of NiTi plate during tensile loading in the region of pseudoelastic temperature.
0 1 2 3 4 5 6 7 8 9 10 11 12
1 2 3 4 5 6 7 8 9 10 1112 13 14 0 1 2 3 4 5 6 7 8 9 10 11 12
1 2 3 4 5 6 7 8 9 10 111213 14
0 1 2 3 4 5 6 7 8 9 10 11 12
1 2 3 4 5 6 7 8 9 1011 12 13 14 0 1 2 3 4 5 6 7 8 9 10 11 12
1 2 3 4 5 6 7 8 9 10 111213 14 -0.035 -0.03 -0.025 -0.02 -0.015 -0.01 -0.005 0 0.005 0.01
(c) 13'-14' (d) 17'-18' (a) 1'-2' (b) 10'-11'
x direction (mm)
y direction (mm)
Fig. 6 Distribution of local strain on the surface of NiTi plate during unloading in the region of pseudoelastic temperature.
Fig. 7 Position of peak local strain as a function of time during tensile loading–unloading on A–A0line.
[image:4.595.288.547.72.440.2] [image:4.595.51.290.72.254.2] [image:4.595.51.290.307.486.2]Picture of specimen and loading direction for cyclic loading test are shown in Fig. 1(b). Figures 9, 10 and 11 show the stress–strain curves and the local strain distributions on the surface of specimen during the cyclic loading test. Also, timing of image acquisition is illustrated as symbol
mark in these stress–strain curves. Local strain is measured within white frame in Fig. 1(b). Distinctive results of the inhomogeneous deformation behavior are shown in Figs. 9, 10 and 11. From even a cursory examination obtained as Figs. 9, 10 and 11, the following facts emerge: the stress induced martensite transformation propagates from the one side toward the center of specimen during tensile loading. Also, the austenite transformation propagates from the point where stress induced martensite transformation propagates during tensile loading toward the opposite side of specimen during unloading. Furthermore, the local strain distribution along toxdirection (A–A0line) is shown in Fig. 12 in order
to investigate the influence of cyclic loadings on the inhomogeneous deformation behavior arising in NiTi plate in detail. From this figure we can see that the peak values of local strain decrease and the width of bands of phase transformation increase with increasing the number of cycles. Figure 13 represents the positions of peak local strain–time relation for the middle line (A–A0 line) on specimen under
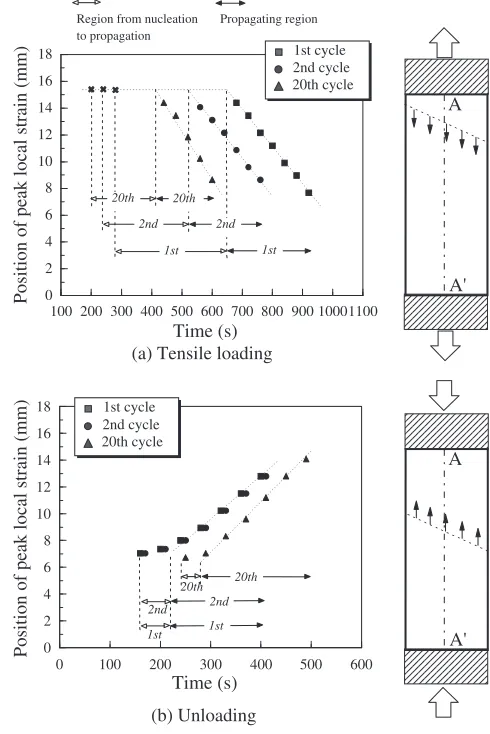
cyclic loadings (1st, 2nd and 20th). Also, schematic illustration of phase propagation is given in this figure. From Fig. 13(a) obtained by an examination during tensile
load-0 100 200 300 400 500 600
0 0.01 0.02 0.03 0.04 0.05 0.06 0.07 0.08 0.09
Strain
Stress (MPa)
NiTi plate
T=60°C(PE region)
1st cycle 2nd cycle 20th cycle
Fig. 8 Stress–strain curves of NiTi plate during cyclic loading.
0 1 2 3 4 5 6
2 3 4 5 6 7 8 9 10 11 12 13 0 1 2 3 4 5 6
2 3 4 5 6 7 8 9 10 11 12 13
0 1 2 3 4 5 6
2 3 4 5 6 7 8 9 10 11 12 13
(a) 4-5 (b) 17-18
(c) 21-22 0 1 2 3 4 5 6
2 3 4 5 6 7 8 9 10 11 12 13 0 1 2 3 4 5 6
2 3 4 5 6 7 8 9 10 11 12 13
(c) 10'-11' (d) 16'-17'
(A) Tensile loading
(B) Unloading x direction [mm]
x direction [mm]
0 1 2 3 4 5 6
2 3 4 5 6 7 8 9 10 11 12 13 (a) 0'-1' 0 1 2 3 4 5 6
2 3 4 5 6 7 8 9 10 11 12 13 (b) 6'-7' 0 100 200 300 400 500 600
0 0.01 0.02 0.03 0.04 0.05 0.06 0.07 0.08 0.09
Strain 10 5 15 20 NiTi plate
T=60°C(PE region) Start point of propagation of phase transformation
1st cycle 0’ 10’ 5’ 15’ Stress (MPa)
y direction [mm]
y direction [mm]
Fig. 9 Stress–strain curve and distribution of local strain on the surface of NiTi plate during 1st tensile loading–unloading in the region of pseudoelastic temperature. 0 1 2 3 4 5 6
2 3 4 5 6 7 8 9 10 11 12 13 0 1 2 3 4 5 6
2 3 4 5 6 7 8 9 10 11 12 13 0 1 2 3 4 5 6
2 3 4 5 6 7 8 9 10 11 12 13
0 1 2 3 4 5 6
2 3 4 5 6 7 8 9 10 11 12 13
0 1 2 3 4 5 6
2 3 4 5 6 7 8 9 10 11 12 13 0 1 2 3 4 5 6
2 3 4 5 6 7 8 9 10 11 12 13
0 1 2 3 4 5 6
2 3 4 5 6 7 8 9 10 11 12 13
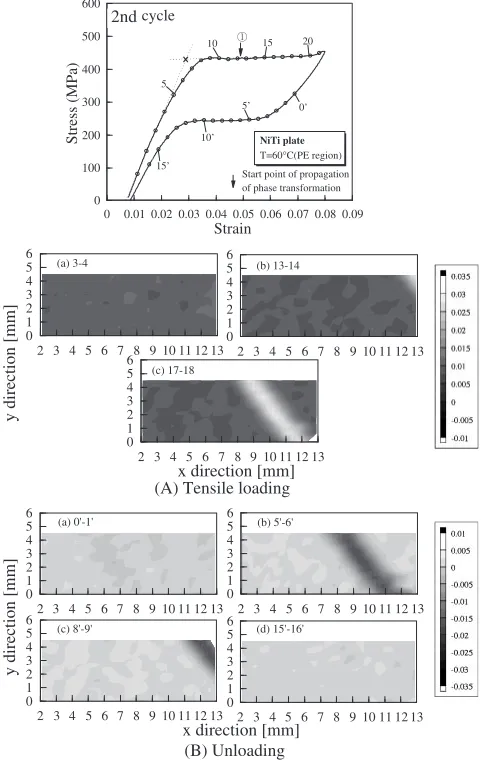
(a) 3-4 (b) 13-14
(c) 17-18
(a) 0'-1' (b) 5'-6'
(c) 8'-9' (d) 15'-16'
(A) Tensile loading
(B) Unloading x direction [mm]
x direction [mm]
0 100 200 300 400 500 600
0 0.01 0.02 0.03 0.04 0.05 0.06 0.07 0.08 0.09 Strain
10
5
15 20
NiTi plate
T=60°C(PE region)
2th cycle
Start point of propagation of phase transformation
0’ 5’ 10’ 15’ 2nd Stress (MPa)
y direction [mm]
[image:5.595.63.269.73.239.2]y direction [mm]
[image:5.595.307.548.75.455.2] [image:5.595.52.289.282.661.2]ings, it is seen that the start of phase propagation becomes earlier with increasing the number of cycles. The propagating speed becomes fast at 20th cycle as compared with 1st and
2nd cycle. On the other hand, as seen in Fig. 13(b), only result of 20th cycle is different in the start of phase propagation and the propagating speed during unloading. These differences of the inhomogeneous deformation behav-ior are strongly reflected as those of the stress–strain relations in cyclic test. Also, there exists the region that deformation generated at a position of nucleation continues to increase until propagation of phase transformation. This region becomes gradually small with increasing the number of cycle.
4. Discussion
NiTi plate shows nucleation and propagation of phase transformation during mechanical loadings. These nucleation and propagation behaviors change with the state of loadings (i.e., number of cycle, history of loading and so on) in the present research. These are very interesting phenomena as following discussions:
(1) The inhomogeneous deformation behavior of NiTi can be classified into three stages: (a) Nucleation of phase transformation, (b) Process between nucleation and propagation, (c) Propagation of phase transformation. Phase transformation can not propagate as soon as nucleates. Phase transformation propagates after the
0 1 2 3 4 5 6
2 3 4 5 6 7 8 9 10 11 12 13
0 1 2 3 4 5 6
2 3 4 5 6 7 8 9 10 11 12 13
0 1 2 3 4 5 6
2 3 4 5 6 7 8 9 10 11 12 13
0 1 2 3 4 5 6
2 3 4 5 6 7 8 9 10 11 12 13
0 1 2 3 4 5 6
2 3 4 5 6 7 8 9 10 11 12 13 0 1 2 3 4 5 6
2 3 4 5 6 7 8 9 10 11 12 13
(a) 3-4 (b) 11-12
(c) 14-15
(c) 9'-10' (d) 14'-15'
(d) 19-20
(A) Tensile loading
(B) Unloading x direction [mm]
x direction [mm]
0 1 2 3 4 5 6
2 3 4 5 6 7 8 9 10 11 12 13 (a) 0'-1' 0 1 2 3 4 5 6
2 3 45 6 7 8 9 10 11 12 13
(b) 6'-7' 0 100 200 300 400 500 600
0 0.01 0.02 0.03 0.04 0.05 0.06 0.07 0.08 0.09 Strain
10 5
15 20
Start point of propagation of phase transformation
NiTi plate T=60°C(PE region) 20th cycle 0’ 5’ 10’ 15’ Stress (MPa)
y direction [mm]
[image:6.595.50.289.73.455.2]y direction [mm]
Fig. 11 Stress–strain curve and distribution of local strain on the surface of NiTi plate during 20th tensile loading–unloading in the region of pseudoelastic temperature. -0.005 0 0.005 0.01 0.015 0.02 0.025 0.03 0.035
4 6 8 10 12 14
Peak position of 20th cycle Peak position of 2nd cycle Peak position
of 1st cycle
A A’
Position along to loading direction [mm]
Local strain
Fig. 12 Local strain along to loading direction during 1st, 2nd and 20th cycle. Time (s) 0 2 4 6 8 10 12 14 16 18
100 200 300 400 500 600 700 800 900 10001100 Region from nucleation
to propagation Propagating region A A' 20th 20th 2nd 2nd 1st 1st 0 2 4 6 8 10 12 14 16 18
0 100 200 300 400 500 600 20th 1st Time (s) A A' 1st 2nd 2nd 20th
(a) Tensile loading
(b) Unloading 1st cycle 2nd cycle 20th cycle 1st cycle 2nd cycle 20th cycle
Position of peak local strain (mm)
[image:6.595.302.547.74.441.2]Position of peak local strain (mm)
Fig. 13 Position of peak local strain as a function of time during 1th, 2th and 20th cycle on A–A0line.
[image:6.595.53.283.517.701.2]deformation at nucleation point has increased upto a certain magnitude. As the region between nucleation and propagation is larger, the larger local deformation will exist at the point of nucleation. There may exist plastic deformation in NiTi when the region between nucleation and propagation is large. Especially, the deformation at early cycle in the elevated temperature region (in the region of pseudoelastic temperature) tends to include plastic deformation at the beginning of phase transformation. Thethermo-mechanicaltrainings had better be given to specimen at low temperature before usage in order to get the stable properties without function loss.
(2) Peak value of local strain during stress induced martensite transformation decreases with increasing the number of cycle as well as stress level in stress– strain curve. From this result, it is understood that the phase after cyclic loading easily becomes stress induced martensite phase as compared with that before cyclic loading. In other words, the stress induced martensite transformation spends more the energy for propagation at early stage of cycles than at late stage of cycles. (3) It is reported by Inoueet al.that recovery strain depends
upon texture.17)Angle of phase propagation (or phase
propagating speed) may depend on texture of specimen, dislocation and so on. It is necessary to investigate these relationships from the viewpoint of inhomogeneous deformation behavior. Also, the form of phase prop-agation during austenite transformation changes ac-cording to loading history. We have to investigate these results in detail.
These inhomogeneous deformation behaviors strongly have an effect on macroscopic deformation behavior. Also, the inhomogeneous deformation behavior is very sensitive to the state of loadings. In the case under complicated loadings, it is very difficult to describe macroscopic deformation behavior of SMA only from the view point of macroscopic level.
5. Conclusion
In the present study, the test system was constructed on the basis of Digital Image Correlation in order to measure the inhomogeneous deformation behavior (local strain distribu-tion) of SMA. Measurements of inhomogeneous deformation behavior were tried during cyclic tensile loading–unloading test in the region of pseudoelastic temperature (60C).
The main results are as follows:
(1) Stress–strain curve of NiTi plate changes with increas-ing the number of cycle, for example, the stress level during stress induced martensite transformation de-creases with increasing the number of cycle and so on. Also, stress–strain curve shows steady state at about
20th cycle.
(2) It is found that the inhomogeneous deformation behav-ior of NiTi can be classified into three stages: (a) Nucleation of phase transformation, (b) Process be-tween nucleation and propagation, (c) Propagation of phase transformation. Phase transformation can not propagate as soon as nucleates. Phase transformation propagates after the deformation at nucleation point has increased up to a certain magnitude.
(3) We can observe that the peak values of local strain decrease and the width of bands of phase transformation increase with increasing the number of cycles. The nucleation of phase transformation becomes earlier with increasing the number of cycles. The region between nucleation and propagation becomes gradually small with increasing the number of cycle. The propagating speed becomes fast at 20th cycle as compared with 1st, 2nd cycle.
Acknowledgements
The present materials were given from Central Research Institute of Electric Power Industry (CRIEPI) in Japan. The authors would like to express our deep gratitude to CRIEPI. We also would like to thank Mr. M. Koushinbou for help of the present experiments.
REFERENCES
1) D. S. Ford and S. R. White: Acta Mater.44(1993) 2295–2307. 2) L. C. Binson: J. Intell. Mater. Syst. Struct.4(1993) 229–242. 3) C. Liang and C. A. Rogers: J. Intell. Mater. Syst. Struct.1(1990) 207–
234.
4) K. Tanaka: Res. Mechanica18(1986) 251–263.
5) K. N. Melton and O. Mercier: Acta Mater.29(1980) 393–398. 6) Y. Liu and S. P. Galvin: Acta Mater.45(1997) 4431–4439. 7) M. Kohl:Shape Memory Microactuators(Springer, 2004). 8) J. A. Shaw and S. Kyriakides: Acta Mater.45(1997) 683–700. 9) J. Dutkiewicz, H. Kato, S. Miura, U. Messerschmidt and M. Bartsch:
Acta Mater.44(1996) 4597–4609.
10) D.-N. Fang, W. Lu and K.-C. Hwang: Metall. Mater. Trans. A30A (1999) 1933–1943.
11) H. Tobushi, K. Takada and K. Okumura: Trans. JSME Series A67 (2001) 1318–1324 (in Japanese).
12) G. Murasawa, M. Koushinbou, S. Yoneyama, T. Sakuma and M. Takashi: J. Soc. Mater. Sci. Jpn.53(2004) 999–1005 (in Japanese). 13) M. Koushinbou, G. Murasawa, S. Yoneyama, T. Sakuma and M.
Takashi: Trans. Mater. Res. Soc. Jpn.29(2004) 2973–2976. 14) H. Tobushi, K. Tanaka, T. Hori, T. Sawada and T. Hattori: Trans. JSME
Series A58(1992) 1411–1416 (in Japanese).
15) M. A. Sutton, S. R. Stephen McNeill, J. D. Helm and Y. J. Chao:
Photomechanics(Springer-Verlag, 2000) 323–372.
16) S. Yoneyama and Y. Morimoto: JSME International Journal Series A 46(2003) 178–184.