Fabrication and Thermoelectric Properties of Ag
9TlTe
X(
X
¼
5
:
0
6
:
0
)
Ken Kurosaki, Keita Goto, Hiroaki Muta and Shinsuke Yamanaka
Division of Sustainable Energy and Environmental Engineering, Graduate School of Engineering, Osaka University, Suita 565-0871, Japan
Polycrystalline samples of Ag9TlTe5with different nominal compositions: Ag9TlTeX (X¼5:0, 5.05, 5.1, 5.2, 5.3, 5.5, 5.7, 6.0) were prepared and the phase relations were studied by X-ray diffraction (XRD) analysis. The electrical resistivity, Seebeck coefficient and thermal conductivity of Ag9TlTeX(X¼5:05:5) were measured from room temperature to around 630 K. The dimensionless figure of merit (ZT) of Ag9TlTe5:0was quit low (0:08), while those of other samples were very high (1:0). It was confirmed that the thermoelectric properties of Ag9TlTe5are significantly influenced by a minimal compositional deviation and the highZT was obtained when the tellurium content was slightly larger than the stoichiometric composition. [doi:10.2320/matertrans.E-MRA2007837]
(Received November 14, 2006; Accepted March 18, 2007; Published July 25, 2007)
Keywords: thallium compounds, thermoelectrics, Ag9TlTe5, thermal conductivity, electrical resistivity, Seebeck coefficient
1. Introduction
Thermoelectric materials can convert waste heat into useful electrical energy. The potential of a material for thermoelectric application is determined by a measure of the material’s figure of merit, ZT (¼S2T=), where S is the Seebeck coefficient, is the electrical conductivity,is the thermal conductivity, and T is the absolute temperature. Since the power factor, S2 or S2= ( is the electrical resistivity), is optimized as a function of carrier concentration (typically 1026 carriers/m3) and the carrier concentration determines the electrical contribution to the thermal con-ductivity (el), the greatest opportunity to enhanceZT is to
minimize the lattice thermal conductivity (lat) at the
optimized carrier concentration.
We are investigating thermoelectric properties of thallium tellurides because they indicate extremely low thermal conductivity.1,2) For example, Figure 1 shows the
temper-ature dependence of the thermal conductivity of various thallium tellurides.3) It can be confirmed that the thermal
conductivity values of almost all thallium tellurides are extremely low; the values are below 0.5 Wm1K1. Among the thallium tellurides, ternary silver thallium tellurides exhibit very highZT; especially theZTof Ag9TlTe5exceeds 1 at 650 K.4)
Recently, we have reported on a very unique high performance thermoelectric material whose chemical for-mula is Ag9TlTe5.4)This compound exhibits extremely low thermal conductivity, and therefore, it indicates very highZT
values. However, our previous study has revealed that the thermoelectric properties of Ag9TlTe5 are significantly influenced by the minimal compositional difference.5) In
the previous study,5) we have studied the thermoelectric
properties of Ag9TlTe5:0, Ag9TlTe5:05 and Ag9TlTe5:1, and confirmed that theZT values of Ag9TlTe5:05and Ag9TlTe5:1 are pretty high (>1:0) but that of Ag9TlTe5:0 is quite low (<0:1).
The purpose of the present study is to investigate the relationship among the composition, phase relation and thermoelectric properties of Ag9TlTe5 within a wider range of composition (Ag9TlTeX: X¼5:06:0). Assuming that
silver and tellurium atoms in the ternary silver thallium tellurides are in the valence states Ag1þ and Te2, the thallium atom would be in the valence states Tl1þand Tl3þin Ag9TlTe5:0and Ag9TlTe6:0, respectively. The polycrystalline samples with different nominal compositions were prepared and their thermoelectric properties were measured from room temperature to around 630 K. The effect of the compositional difference on the thermoelectric properties of Ag9TlTe5 was investigated.
2. Experiment
In the present study, we prepared 5 polycrystalline samples of Ag9TlTeX with different compositions, in which the
tellurium contents:Xare 5.2, 5.3, 5.5, 5.7, 6.0. Samples are labeled from ‘‘a’’ to ‘‘h’’ in order of increasing the tellurium content:X¼5:0, 5.05, 5.1, 5.2, 5.3, 5.5, 5.7, 6.0, in which the samples (a),5) (b)4) and (c)5) have been reported in our
previous papers.4,5)The X-ray diffraction (XRD) patterns of
samples (d), (e), (f), (g) and (h) and the thermoelectric properties of samples (d), (e) and (f) are reported first time in the present paper. In the case of samples (g) and (h), it was very difficult to obtain high density bulk samples because they are so brittle. Therefore we couldn’t make measure-ments of the thermoelectric properties.
300 400 500 600 700
0.0 0.5 1.0 1.5 2.0 2.5
Thermal conductivity,
κ
(Wm
-1K -1)
Temperature, T (K)
AgTl3Te2 AgTlTe Ag8Tl2Te5 Ag9TlTe5 Tl9CuTe5 TlSbTe2 TlBiTe2 TlInTe2 Tl2GeTe3 Tl9BiTe6 Tl9SbTe6 Tl4SnTe3 Tl4PbTe3 Tl2Te
Fig. 1 Temperature dependence of the thermal conductivity of various thallium tellurides.3)
[image:1.595.313.542.304.436.2]Appropriate amounts of Ag2Te, Tl2Te, Tl2Te1:2 (Tl5Te3) and Te were mixed and melted in sealed quartz ampoules. Ag2Te, Tl2Te and Te were obtained from Furuuchi Chemical Co. Ltd., and Tl2Te1:2 was preliminarily prepared in the author’s group. The melted ingots were annealed at 673 K for 1 week, and then the obtained intermediates were crushed to a fine powder (<45mm), followed by hot-pressing at 573 K under 40 MPa. Figure 2 shows the appearance of samples (d), (e) and (f). For the electrical resistivity and Seebeck coefficient measurements, the column shaped samples with the diameter of 7 mm and height of 12 mm were prepared. For the thermal diffusivity measurement, the disc shaped samples with the diameter of 10 mm and thickness of 1 mm were prepared. The preparation method is very simple and needs no special equipments and techniques.
Powder XRD measurements were carried out using CuK
radiation. Electrical resistivity () and Seebeck coefficient (S) were measured using a ZEM-1 apparatus (ULVAC Co. Ltd.) under a helium atmosphere from room temperature to around 630 K, in which thewas evaluated using the standard four-probe method. Thermal conductivity () was evaluated from thermal diffusivity (), heat capacity (CP) and density (d).
The was measured through the laser flash method in vacuum from room temperature to around 630 K using a TC-7000 apparatus (ULVAC Co. Ltd.). The Cp data were obtained from the Neumann–Kopp law using the data of Ag2Te and Tl2Te listed in the database.6)Since the samples (d), (e) and (f) softened above 630 K, the measurements were performed up to 630 K.
3. Results and Discussion
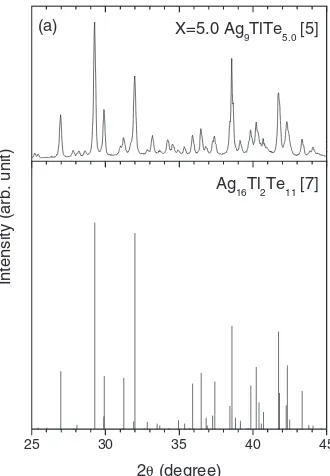
[image:2.595.344.509.71.309.2]The XRD pattern of sample (a) (Ag9TlTe5:0) is shown in Fig. 3, together with the literature data reported by Tedenac and his co-worlers.7)It is confirmed that the XRD pattern of
sample (a) is well consistent with the literature data. Figure 4 shows the crystal structure of Ag16Tl2Te11 reported in the literature.7) The crystal system is hexagonal with the space
group symbol of R-3c. The structure is very complex with a large unit cell volume. The bulk density of polycrystalline sample (a) is approximately 95% of the theoretical density.
The XRD patterns of all samples: Ag9TlTeX (X¼ 5:06:0) are summarized in Fig. 5. Clearly, the XRD pattern varies with the tellurium content. The intensity of a peak at
2¼30:7 in sample (h) decreases with decreasing the tellurium content, and finally, the peak disappears in sample
(a). On the other hand, the intensity of peaks at2¼29:3 and 38.7 observed in sample (a) decreases with increasing the tellurium content, and finally, the peaks disappear in sample (h).
The XRD pattern of sample (f): Ag9TlTe6:0 is completely different from that of sample (a): Ag9TlTe5:0. The main peaks existed in Ag9TlTe5:0 are not observed in Ag9TlTe6:0. In addition, there is no information about Ag9TlTe6 in the
Sample (d) Sample (e) Sample (f)
Fig. 2 Appearance of samples (d), (e) and (f). The diameter and height of the samples are 7 and 12 mm, respectively.
25 30 35 40 45
Ag
16Tl2Te11 [7]
Intensity (arb. unit)
2θ (degree)
(a) X=5.0 Ag
9TlTe5.0 [5]
Fig. 3 XRD pattern of sample (a) (Ag9TlTe5:0),5)together with that of Ag16Tl2Te11reported by Tedenacet al.7)
[image:2.595.82.255.74.178.2] [image:2.595.374.481.368.626.2]silver-thallium-tellurium ternary system. Since Ag5Te3 (Ag10Te6) and Tl5Te3(Tl10Te6) can be considered as similar compounds of Ag9TlTe6, the XRD pattern of Ag9TlTe6:0 is compared with those of Ag5Te38)and Tl5Te39)as shown in Fig. 6. It can be confirmed that the three XRD patterns are different from each other; to stretch a point, the XRD pattern of Ag9TlTe6:0 appears to be similar to that of Tl5Te3. Nevertheless, since the crystal structure and phase relation of A9TlTe5 are still unknown, further research needs to be conducted to understand them.
Figure 7(a) shows the temperature dependence of the electrical resistivity (). The varies drastically with the tellurium content. The data of the samples except for sample (a) decrease with temperature, showing semiconduct-ing behavior, while that of sample (a) increases in the temperature range from room temperature to around 450 K and then decreases.
Figure 7(b) shows the temperature dependence of the Seebeck coefficient (S). The S data of all samples are positive. The S data of the samples except for sample (a) decrease with increasing temperature, while that of sample (a) is almost independent of temperature. It is supposed that the decrease of S at high temperatures originates in the increase of carriers by thermal excitation.
Figure 7(c) shows the temperature dependence of the power factor (S2=). The power factor of the samples except for sample (a) are relatively high; approximately0:30:4 103Wm1K2 at 630 K, while that of sample (a) is quite low; approximately 0:05103Wm1K2 due to the high electrical resistivity compared with those of other samples. Sample (d) (Ag9TlTe5:2) indicates the highest values of the power factor.
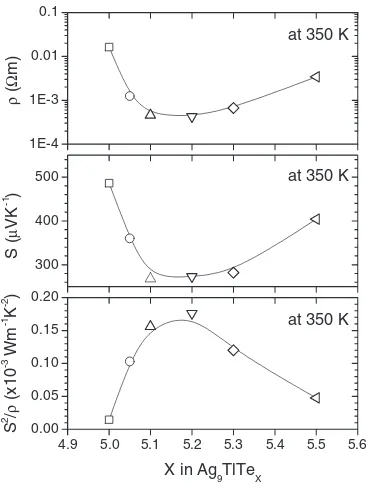
Figure 8 shows the thermoelectric properties at 350 K as a function of X in Ag9TlTeX in theX range from 5.0 to 5.5.
Variations ofandSwithXare very similar. Both theand
S decrease with increasing X, achieve simultaneously a minimum point atX¼5:2, and then increase with increasing
X, leading to the maximum power factor atX¼5:2. We have reported the carrier concentration (n) and mobility () at room temperature of samples (a), (b) and (c) in the previous paper.5)The carrier concentration data of
25 26 27 28 29 30 31 32 33 34 35 36 37 38 39 40
X=6.0 (h)
2θ (CuKα, degree)
X=5.7 (g)
X=5.5 (f)
X=5.3 (e)
Intensity (arb. unit)
X=5.2 (d)
X=5.1 [5] (c)
X=5.0 [5] (a)
X=5.05 [4] (b)
Fig. 5 XRD patterns of Ag9TlTeX(X¼5:06:0).
Ag5Te3 [8]
Intensity (arb. unit)
(h) X=6.0 Ag9TlTe6.0
25 30 35 40 45
Tl5Te3 [9]
2θ (Cu Kα, degree)
Fig. 6 XRD pattern of sample (h) (Ag9TlTe6:0), together with those of Ag5Te38)and Tl5Te39)
1E-4 1E-3 0.01 0.1
(d) Ag9TlTe5.2 (e) Ag9TlTe5.3 (f) Ag9TlTe5.5
ρ
(
Ω
m)
(a) Ag9TlTe5.0 (b) Ag9TlTe5.05 (c) Ag9TlTe5.1
200 300 400 500 600
S (
µ
VK
-1 )
300 400 500 600 700
0.0 0.1 0.2 0.3 0.4 0.5
S
2 /ρ
(1
0
-3 Wm -1 K -2 )
Temperature, T (K)
[image:3.595.80.260.67.335.2] [image:3.595.335.520.73.351.2] [image:3.595.85.253.378.613.2]samples (a), (b) and (c) are 8:11023, 1:81024 and
5:21024m3, respectively. The mobility data of samples (a), (b) and (c) are 9:6104, 12104 and 11104 m2V1s1, respectively. These results reveal that the carrier concentration increases with increasing the tellurium content, while the mobility is maintained virtually constant, which implies that the and S depend principally on the carrier concentration.
Figure 9 shows the temperature dependence of the thermal conductivity (). Although the and S are significantly influenced by a minimal compositional deviation, theof all samples are at a similar level at any compositions and remain extremely low. The values are approximately 0:20:3
Wm1K1. We have confirmed that the lattice thermal conductivity (lat) is predominant. The ratio of the electronic
contribution (el) to the total thermal conductivity is only a
few percent at room temperature. We have reported that the
Debye temperature of sample (b) is 120 K, which is evaluated from the sound velocity measurment.4)This very low Debye
[image:4.595.77.260.72.314.2]temperature is attributed to the heavy atomic mass with weak interatomic bonding. In addition, the crystal structure of this phase is very complex, suggesting that the number of atoms in the unit cell is very large. The low Debye temperature and the large number of atoms in the unit cell may lead to the extremely low thermal conductivity.
Figure 10 shows the temperature dependence of the dimensionless figure of merit (ZT). TheZT value of sample (a) is quite low; but those of other samples are significantly high. The minimal compositional deviation in Ag9TlTe5has a significant influence on the thermoelectric properties. From room temperature to around 630 K, theZTvalues of samples (c), (d), (e) and (f) are larger than that of sample (b) reported in our previous paper.4)An enhancement of theZT could be
achieved when the tellurium content is slightly larger than the stoichiometric composition.
4. Summary
We have studied the thermoelectric properties of poly-crystalline samples of Ag9TlTe5 with different nominal compositions. The XRD patterns as well as the electrical properties vary in accordance with the tellurium content. Ag9TlTe5:2 exhibits the highest power factor. Although the electrical properties are significantly influenced by a minimal compositional deviation, the thermal conductivity remains extremely low at any compositions. This result indicates that an improvement of the power factor can be achieved through the compositional tuning without increasing the thermal conductivity, leading to an enhancement of theZT.
Acknowledgements
This work was partly supported by a Grant-in-Aid for Scientific Research (No. 18760667) from the Ministry of Education, Science, Sports and Culture, Japan; The Kansai Research Foundation for technology promotion; The Kinki District Invention Center; and Foundation for Promotion of Material Science and Technology of Japan.
1E-4 1E-3 0.01 0.1
at 350 K
ρ
(
Ω
m)
300 400
500 at 350 K
S (
µ
VK
-1 )
4.9 5.1 5.3 5.5
0.00 0.05 0.10 0.15 0.20
at 350 K
S
2 /ρ
(x10
-3 Wm -1 K -2 )
X in Ag9TlTeX
5.0 5.2 5.4 5.6
Fig. 8 Thermoelectric properties at 350 K as a function ofXin Ag9TlTeX (X¼5:05:5).
300 400 500 600 700 0.0
0.5 1.0
(d) Ag9TlTe5.2
(e) Ag
9TlTe5.3
(f) Ag9TlTe5.5
(a) Ag9TlTe5.0
(b) Ag
9TlTe5.05
(c) Ag9TlTe5.1
Thermal conductivity,
κ
(Wm
-1 K -1 )
Temperature, T (K)
Fig. 9 Temperature dependence of the thermal conductivity, of Ag9TlTeX(X¼5:05:5).
300 400 500 600 700 0.0
0.5 1.0 1.5
(d) Ag
9TlTe5.2
(e) Ag9TlTe5.3 (f) Ag9TlTe5.5 (a) Ag
9TlTe5.0
(b) Ag9TlTe5.05 (c) Ag9TlTe5.1
Dimensionless figure of merit, ZT
[image:4.595.324.527.72.225.2]Temperature, T (K)
[image:4.595.69.269.375.525.2]REFERENCES
1) K. Kurosaki, A. Kosuga, H. Muta and S. Yamanaka: Mater. Trans., JIM
46(2005) 1502–1505.
2) A. Kosuga, K. Kurosaki, H. Muta and S. Yamanaka: J. Appl. Phys.99
(2006) 063705-1–063705-4.
3) S. Yamanaka, K. Kurosaki, A. Kosuga, K. Goto and H. Muta: MRS Symp. Proc.886(2006) 337–341.
4) K. Kurosaki, A. Kosuga, H. Muta, M. Uno and S. Yamanaka: Appl. Phys. Lett.87(2005) 061919-1–061919-3.
5) K. Kurosaki, A. Kosuga, K. Goto, H. Muta and S. Yamanaka: Mater. Trans., JIM47(2006) 1938–1940.
6) The SGTE Pure Substance and Solution Databases, GTT-DATA SERVICES (1996).
7) D. Paccard, L. Paccard, G. Brun and J.-C. Tedenac: J. Alloys Compd.
184(1992) 337–342. 8) JCPDS 47-1350.