In
fl
uence of Substrate Temperature on Structure
and Adhesion Strength of Fe
Cr
P
C Amorphous Coating Films
Produced by Thermal Spraying Technique
Masahiro Komaki
1, Tsunehiro Mimura
1, Ryurou Kurahasi
1, Hirotaka Odahara
2,
Kenji Amiya
2, Yasunori Saotome
2and Tohru Yamasaki
31Nakayama Steel Works, Ltd., R&D Division, Osaka 551-8551, Japan
2Institute for Materials Research, Kansai Center, Tohoku University, Himeji 671-2280, Japan 3University of Hyogo, Himeji 671-2280, Japan
The influence of the substrate temperature on the structure, the pore distribution, and the adhesion strength of Fe-10Cr-based amorphous coatingfilms has been examined. The amorphous coating films have been produced by a thermal spraying technique using our developed cylindrical nozzle on SS400 substrates. The splat morphology of the sprayed particles changed drastically from an irregular splash shape to a disk shape at a transition temperature of about 325°C. When the substrate temperature increased to the transition temperature region, between 325 and 350°C, the porosity in the boundary regions between the sprayed coatingfilms and the substrates drastically decreased to about 6%, which may be due to the drastic increase in the wettability of the sprayed particles accompanied with the change of morphology from the splashed shape to the disk shape. When the substrate temperature increased from the transition temperature of 325°C up to 400°C, the porosity decreased gradually, and the volume fraction of the amorphous phase increased with increasing substrate temperature, resulting in an increase in the adhesion strength up to about 15 MPa. [doi:10.2320/matertrans.M2011261]
(Received August 24, 2011; Accepted January 23, 2012; Published March 25, 2012)
Keywords: iron-chromium-phosphorus-carbon, amorphous alloy, sprayed coating film, thermal spraying method, substrate temperature,
adhesion strength
1. Introduction
In our previous study,14)we have developed high quality
Fe70Cr10P13C7 (Fe-10Cr) and Fe38Cr35Mo7P13C7 (Fe-35Cr)
amorphous coating films that have high hardness and high corrosion resistance without the inclusion of oxides. In order to prevent the inclusion of oxides, we developed a cylindrical nozzle with external nitrogen gas cooling, which was mounted on the front end of a thermal spraying gun to control the temperatures of the substrate and the powder particles in the sprayed flame. Corrosion testing has demonstrated that the Fe-10Cr-based amorphous coating film exhibited a high corrosion resistance equal to that of Hastelloy C and commercially produced pure titanium.3)
High corrosion resistance of the Fe-35Cr-based amorphous coating film was observed in immersion tests using 35% hydrochloric acid.4)
For practical applications of these Fe-based amorphous coating films, the most important point is improvement of the adhesion strength between the sprayed coatingfilms and the substrates, which may depend on the structure of the sprayed coating films and the density of the pores in the boundary region between the sprayed coating films and the substrates.511) Fukumoto9,11) has shown that the splat morphology of the sprayed particles changed drastically from an irregular splash shape to a disk shape when the substrate temperature increased to the transition temperature.9) It is therefore suggested that the adhesion strength is strongly influenced by the substrate temperature.
In the present study, the influence of the substrate temperature on the structure, the pore distribution, and the adhesion strength of Fe-10Cr-based amorphous coatingfilms have been examined.
2. Experimental Procedures
The thermal spraying equipment used in this study was composed of a gas flame spraying gun and the cylindrical nozzle. The thermal spraying material was a gas-atomized powder (grain size: 6388 µm) of Fe70Cr10P13C7 (Fe-10Cr)
with a melting temperature of 997°C.2,3) SS400 steel plates
with areas of 120 mm©120 mm and thicknesses of 6 mm were used as substrates. Surface finishing of the substrates was done by shot blasting with alumina powders, and the surface roughness was controlled to about Ra=4 µm.
Structural analysis of the sprayed coating films was done using X-ray diffraction (CuK¡ radiation with a graphite monochromator, 40 kV, 200 mA) and a scanning electron microscope (SEM: HITACHI SU1500, 15 kV). The volume fraction of the amorphous phase in the sprayed coating films separated from the substrate was estimated by the heat evolution during crystallization, measured by DSC (DSC: SII 6220) with a heating rate of 40°C/min in a high purity argon gas atmosphere. The weight of these samples was set to about 20 mg.
Figure 1 shows a schematic of the cylindrical-nozzle-type thermal spraying gun and the flat substrate. Table 1 also shows the thermal spraying conditions used in the present study. In order to prevent the formation of oxides in the sprayed coating films, the flame was kept in a reduction atmosphere by using an acetylene-rich gas fuel mixture.12)Nitrogen gas was also introduced into the cylin-drical nozzle. In order to control the substrate temperature, the cooling air pressure from the back side was controlled between 0 and 0.4 MPa, and an intermittent operation of the thermal spraying was introduced, as described later in Fig. 5.
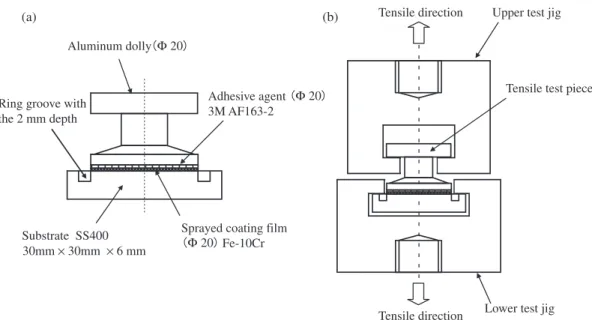
Figure 2 shows a schematic of the tensile test specimen for measuring the adhesion strength between the sprayed coating film and the substrate. Figure 2(a) shows the tensile test specimen. The substrate was bonded to an aluminum dolly with an effective area of 314 mm2 and a diameter of 20 mm using the 3M Company adhesive agent AF163-2, and then it was annealed at 120°C for two hours to harden the agent. Figure 2(b) shows the assembly diagram of the tensile test jig and tensile test specimen. The aluminum dolly was installed in upper test jig, and the substrate was installed in the lower
test jig. The cross-head speed of the tensile test was set to 1 mm/min.
Figure 3 shows the shape of the substrate designed to measure the adhesion strengths of the tensile test specimens with an effective area 20 mm in diameter. The surface temperature of the substrate (Ts) was measured at the center
point by a spot-welded K-thermocouple. After the thermal spraying treatment, the substrate was cut along the dotted lines by wire cutting equipment. Finally, four specimens around the K-thermocouple were selected for adhesion strength measurements. After bonding the coated substrate and the aluminum dolly, the extra sprayed coating film was removed from the effective area by shot blasting. A ring groove with a 2 mm depth around the 20 mm diameter area was effective to remove the extra sprayed coatingfilm for the exact measurements.
Figure 4 shows the thermal gradients of the sprayingflame over the distance from the cylindrical nozzle head to the substrate, as measured by a thermocouple. In this diagram, the 0 mm gradient curve indicates the thermal gradient at the flame center, while the 5 and 10 mm gradient curves indicate
Flat substrate
(SS400 120 mm × 120 mm × 6 mm)
Flame
Sprayed coating (Fe-10Cr 400 μm)
External cooling gas( N2) Spray powder material
(Carrier gas: N2) Cylindrical nozzle (Twofold cylinder)
Front end of thermal spray-gun nozzle Acetylene/Oxygen
Substrate cooling gas (Air)
Air nozzle
K-thermocouple (Φ0.5)
Fig. 1 Schematic of the cylindrical-nozzle type thermal spraying gun and theflat substrate.
Table 1 Thermal spraying conditions.
Acetyleneflow rate 35.4 dm3/min
Oxygenflow rate 35.4 dm3/min
External cooling gas (N2)flow rate 580 dm3/min Cooling air pressure from the back side 00.4 MPa
Gun scan rate 300 mm/s
Spraying pitch 5 mm
Thickness of the sprayed coating 400 µm
Upper test jig Tensile direction
Tensile test piece Aluminum dolly Φ20
Sprayed coating film Fe-10Cr
(b) (a)
Ring groove with the 2 mm depth
Substrate SS400
Tensile direction Lower test jig Adhesive agent
3M AF163-2
30mm ×30mm ×6 mm
Φ20
Φ20
the thermal gradient at positions outlying from the center of theflame. Although the center of theflame hits the substrate
at a temperature of approximately 1000°C, the flame
temperature decreased sharply to about 300 and 500°C for the 10 and 5 mm positions, respectively.
Figure 5 shows the thermal spraying scanning patterns on the SS400 substrates. The spraying gun was mounted on a robot arm and scanned at a feed rate of 300 mm·s¹1. In the first step, the thermal spraying was started at point A and was scanned back and forth along the solid lines with 10 mm pitch. When the spraying arrived at point B, the spraying gun was returned to point A and held at standby while the substrate temperature decreased to the preset value. In the
second step, the scanning pattern was shifted about 5 mm downward. In the third step, the scanning pattern returned to that of the 1st step. After that, these steps were repeated until reaching the preset thickness value of the sprayingfilms.
Figure 6 shows a representative example of the substrate temperature over 30 steps, given a preset temperature of Ts=300°C. The substrate temperature was measured by
the spot-welded K-thermocouple at the center point of the substrate. Figure 7 shows a detailed expansion of the change
Metal SS400 120
120
6
Φ20 2
1 2 3 4
5 6 7 8
9 10 11 12
Φ26 30
30
Tensile test side
Cross-section observation and XRD area
Wire cut line
Spot-welded
Selected specimens to measure the adhesion strength
K-thermocouple (Φ0.5) Ring groove with
the 2 mm depth
K-thermocouple
(Sprayed coating film Fe-10Cr)
Fig. 3 Shape of the substrate designed to measure the adhesion strengths of the tensile test specimens with an effective area 20 mm in diameter.
0 200 400 600 800 1000 1200 1400 1600
0 20 40 60 80 100 120
Sprayed flame temperature,
T
/
°
C
Distance from the cylindrical nozzle head, l/mm Cylindrical nozzle
5 mm
10 mm
Cross section of the flame. 0 mm
position
Lower temperature area about 400 °C High temperature area about 1000 °C Temperature distribution of the flame.
0 mm
5 mm
10 mm
Position of the substrate
Fig. 4 Thermal gradients of the sprayingflame over the distance from the cylindrical nozzle head to the substrate, as measured by a thermocouple.
Waiting position of the cylindrical-nozzle type thermal spraying gun.
10
Flat substrate
(SS400 120 mm ×120 mm ×6 mm) First scanning line (feed rate: 300 mm/s)
Second scanning line (feed rate: 300 mm/s)
Spot-welded K-thermocouple
5
A
B
in substrate temperature in the region inside the dotted circle in Fig. 6. After preheating the substrate, the 1st spraying step was started. In this case, the local maximum temperature (Tmax) appeared when the gun was scanned over the
spot-welded point of the K-thermocouple. After scanning the 1st step, the gun was held at standby at the starting point while the substrate temperature decreased to the preset value of Ts=300°C. When the substrate temperature had decreased to
300°C, the 2nd spraying step was started. The temperature difference betweenTmaxandTsstayed within the confines of
50°C, andTswas controlled within«6°C, as shown in Fig. 8.
In this study, thefilms were prepared over 30 steps.
3. Results
3.1 Structure of the sprayed coatingfilms
Figure 9 shows SEM micrographs of cross sections of the sprayed coatingfilms on SS400 substrates. The pores in the cross sections are colored white. Figure 10 shows the porosity of the sprayed coating films as a function of substrate temperature. In the case of Fig. 9(a), at the substrate temperature of Ts=245°C, a high porosity of 15.7% was
observed in the boundary region framed by the dotted line. When the substrate temperature increased toTs=347°C, the
porosity in the boundary region drastically decreased to about
6.0% and then further decreased gradually with increasing temperature. In the inside region of the sprayed coatingfilm, framed by the solid line, the observed porosity was only 5.8%at a substrate temperature of Ts=245°C, as shown in
Fig. 9(a). In this region, the porosity of the sprayed coating film gradually decreased from 5.8 to 0.6% with increasing substrate temperature up to about 447°C.
Figure 11 shows the hardness of the sprayed coatingfilms as a function of substrate temperature. Vickers microhardness was measured for the thermal sprayed coating films on the substrates by using a 0.2 kg load and a loading time of 10 s in cross section. With increasing substrate temperature, the hardnessfirst decreased to a minimum value of about HV740 at a substrate temperature of 325°C, and then it increased to a maximum value of about HV820 at a substrate temperature of about 430°C. When the substrate temperature increased to 430°C and above, a large decrease in the hardness was observed.
Figure 12 shows how the X-ray diffraction pattern of the thermal sprayed coatingfilm at the substrate temperature of Ts=390°C changes with depth. Each pattern represents
grinding about 200 µm in depth from an initialfilm thickness of 1070 µm. The depth of the CuK¡ X-ray penetration in thefilm was calculated to be less than about 5 µm by using a ªª type X-ray diffractometer at 2ª=40°. In all cases, the only diffraction peak that can be found is the broad peak between 2ª=40° and 50° that is the typical feature of metallic glass phases.
Figure 13 shows the X-ray diffraction patterns of the as-sprayed Fe-10Cr coatingfilms with various substrate temper-atures. When the substrate temperatures were 431°C and below, X-ray diffraction peaks were well broadened, indicating the structure of the sprayed coating films were almost amorphous phases. When the substrate temperature increased to 447°C, some sharp X-ray diffraction peaks attributable to¡-Fe and Fe3P phases appeared superimposed
on the broad pattern of the amorphous phase, indicating the partial crystallization of the amorphous phase.
Figure 14 shows DSC curves for the Fe-10Cr sprayed coating films with various substrate temperatures. The coatingfilms were separated from the substrates and broken
100 150 200 250 300 350 400 450 500 550 600
0 2 4 6 8 10 12 14
Substrate temperature,
T
/
°
C
Thermal spraying time, t/min
Preheating Thermal spraying
Vitrification temperature (493°C)
Substrate average bottom temperature Cooling
Fig. 7
Substrate temperature: Ts
30 steps
Fig. 6 Representative example of the substrate temperature over 30 steps, given a preset temperature ofTs=300°C.
250 300 350 400
1 1.5 2 2.5 3 3.5
Preheating Waiting Thermal spraying
Waiting Spot-welded K-thermocouple point
Thermal spraying
Substrate temperature,
T
/
°
C
Thermal spraying time, t/min
Ts = 300°C
1 step 2 step 3 step Tmax-Ts= 10–50°C
Fig. 7 Detailed expansion of the change in substrate temperature in the region inside the dotted circle in Fig. 6.Ts: Substrate temperature.
200 250 300 350 400 450 500
0 5 10 15 20 25 30 35 40
Ts = 324 °C
Ts = 347 °C
Ts = 377 °C
Ts = 401 °C
Ts = 431 °C
Ts = 447 °C
Substrate temperature,
T
/
°
C
Thermal spraying step number
Ts = 245 °C
Ts = 275 °C
Ts = 300 °C
into small pieces of about 20 mg for DSC samples. In the case of the rapidly quenched ribbon sample, a small and well-broadened 1st exothermic peak was observed at an onset temperature of about 455°C. A large 2nd exothermic peak was observed with an onset temperature of 506°C, a gentle slope, and a peak temperature of 518°C, as indicated by B. In the cases of the sprayed coatingfilms with various substrate temperatures, the onset and peak temperatures of the 1st peaks were shifted to higher temperature with an increase in the substrate temperature. This may be due to structural relaxation of the amorphous phase during heating of the
substrate.13,14) The 2nd large exothermic peaks were composed of 2 peaks A and B, as indicated in this figure. Larger heights of peak A were observed in the sprayed coating films than in the rapidly quenched ribbon sample. This may be due to a shift in the ¡-Fe precipitation temperature to lower temperature in the sprayed coating
films.
Figure 15 shows the X-ray diffraction patterns for the annealed coating films at a substrate temperature of Ts=
324°C. As shown in Fig. 15(a), after being annealed up to the Boundary region: 5.0%
Boundary region: 5.0% Inside region: 3.4% Inside region: 3.4% (g)
(g)
Inside region: 3.6% Inside region: 3.6%
Boundary region: 10.7% Boundary region: 10.7% (d)
(d)
(b)
Boundary region: 14.1% Boundary region: 14.1%
(c)
Inside region: 5.8% Inside region: 5.8%
Boundary region: 13.9% Boundary region: 13.9%
(i)
(i)
Boundary region: 2.3% Boundary region: 2.3% Inside region: 2.2% Inside region: 2.2% (h)
(h)
Inside region: 3.0% Inside region: 3.0%
Boundary region: 6.0% Boundary region: 6.0% (e)
(e)
Inside region: 3.2% Inside region: 3.2%
Boundary region: 5.1% Boundary region: 5.1% (f)
(f) (a)
Inside region: 5.8% Inside region: 5.8%
Boundary region: 15.7% Boundary region: 15.7%
Boundary region: 2.0% Boundary region: 2.0% Inside region: 5.1%
Inside region: 5.1%
Inside region: 0.6% Inside region: 0.6%
Fig. 9 SEM micrographs of cross sections of the sprayed coatingfilms on SS400 substrates: (a) Ts=245°C; (b) Ts=275°C; (c)
Ts=300°C; (d)Ts=324°C; (e)Ts=347°C; (f )Ts=377°C; (g)Ts=401°C; (h)Ts=431°C; (i)Ts=447°C.Ts: Substrate temperature.
0 2 4 6 8 10 12 14 16 18
225 250 275 300 325 350 375 400 425 450 475
Boundary region
Inside region
Substrate temperature, T/°C
Porosity(%)
Fig. 10 Porosity of the sprayed coatingfilms as a function of substrate temperature.
Substrate temperature, T/°C
Hardness of the coating f
ilm (HV)
600 700 800 900
225 250 275 300 325 350 375 400 425 450 475
peak A temperature of 516°C, small ¡-Fe diffraction peaks were observed superimposed on the amorphous pattern, indicating that the peak A portion of the 2nd exothermic peak may be due to ¡-Fe precipitation in the amorphous phase.
When the film was annealed at 600°C for 3600 s, large diffraction peaks corresponding to ¡-Fe and Fe3P phases
were observed, as shown in Fig. 15(b), indicating that the peak B portion of the 2nd exothermic peak may be due to the crystallization of the remaining amorphous phase.
Figure 16 shows the volume fractions of the amorphous phase of the Fe-10Cr sprayed coating films as a function of the substrate temperature. The volume fractions of the amorphous phase were estimated from the sizes of the 2nd exothermic peaks on the basis of that of the rapidly quenched ribbon sample. The volume fraction of the amorphous phase decreased with increasing substrate temperature to a mini-mum value of about 84%at a substrate temperature of 325°C, and then it increased to a maximum value of about 89%at a substrate temperature of about 375°C. When the substrate temperature was increased to 430°C and above, a large decrease in the volume fraction was observed.
3.2 Tensile tests
Figure 17 shows the fracture surfaces of the four speci-mens around the K-thermocouple after tensile tests at each substrate temperatures. When the substrate temperature was 324°C, shown in Fig. 17(a), a large area of the fractured surface was dark colored substrate, indicating the fracture was mainly caused by the sprayed coatingfilm peeling from
Intensity
2θ/degree
20° 30° 40° 50° 60° 70° 80° (b) t = 870
(c) t = 710
(d) t = 520
(e) t = 320
(f) t = 140
90° Coating
Substrate X-ray (Depth of penetration: 10
(a) (b) (c) (d) (e) (f) (a) t = 1070
tmax= 1070 μm)
μm μm (Surface)
m μ
m μ
m μ
m μ
m μ
Fig. 12 X-ray diffraction pattern of the thermal sprayed coatingfilm at the substrate temperature ofTs=390°C changes with depth.Ts: Substrate temperature (CuK¡ radiation with a graphite monochrometer, 40 kV, 20 mA).
Ts = 447°C
Ts = 431°C
Ts = 377°C
Ts = 347°C Ts = 401°C
Intensity
2θ/degree
20° 30° 40° 50° 60° 70° 80° Ts = 324°C
Ts = 300°C
Ts = 275°C
Ts = 245°C
α-Fe Fe3P
Fig. 13 X-ray diffraction patterns of the as-sprayed Fe-10Cr coatingfilms with various substrate temperatures (Ts) (CuK¡radiation with a graphite monochrometer, 40 kV, 20 mA).
440 450 460 470 480 490 500 510 520 530 540 Ribbon
Temperature, T/°C
Exothermic, arb
.unitrs
1st peak
2nd peak
TX ΔH = 83.3mJ/mg
ΔH = 67.0mJ/mg
ΔH = 73.1mJ/mg
ΔH = 71.5mJ/mg
ΔH = 69.7mJ/mg
ΔH = 60.0mJ/mg
ΔH = 34.6mJ/mg
Ts = 447°C Ts = 431°C Ts = 347°C Ts = 324°C
Ts = 401°C Ts = 377°C Ts = 275°C
Ts = 245°C ΔH = 78.5mJ/mg
ΔH = 76.3mJ/mg
Ts = 300°C ΔH = 76.8mJ/mg A
A B
B
(2ndpeak)
Fig. 14 DSC curves for the Fe-10Cr sprayed coatingfilms with various substrate temperatures (Ts).
40° 60° 80°
30° 50° 70°
Ts = 324°C
Intensity
2θ/degree 20°
α-Fe Fe3P Heating rate : 20 °C /min
(b)Annealed up to 600°C for 1h.
(a)Annealed up to 516°C and then cooled.
Fig. 15 X-ray diffraction patterns for the annealed coating films at a substrate temperature ofTs=324°C.Ts: Substrate temperature (CuK¡ radiation with a graphite monochrometer, 40 KV, 20 mA).
30 40 50 60 70 80 90 100
225 250 275 300 325 350 375 400 425 450 475
V
o
lume fraction of the amorphous phase(%)
Substrate temperature, T/°C
the substrate. In this case, the dark colored area is about 50 70% of the surface. With increasing substrate temperature, the dark colored area drastically decreased to 1020% at Ts=347°C and Ts=377°C, as shown in Figs. 17(b) and
17(c). When the substrate temperature was increased to Ts=401°C and above, the entire area of the fractured surface
was created by the fracture inside the sprayed coating film. Figure 18 shows the average adhesion strength of the four specimens around the K-thermocouple, as previously shown in Fig. 3, as a function of the substrate temperature. The adhesion strength increased gradually with increasing sub-strate temperature up to about 400°C, as evidenced by the decrease in the dark-colored peeling area of the fractured surface. When the substrate temperature increased to 425°C and above, the adhesion strength decreased drastically, which may be due to partial crystallization and embrittlement during the structural relaxation of the Fe-based amorphous phase.13,14)
4. Discussion
In order to obtain a large volume fraction of the amorphous phase and high adhesion strength between the sprayed coating films and the substrates, temperature control of the substrate may be an important point.
It has been reported that the splat morphology of the sprayed particles is a useful parameter to estimate the thermal spraying conditions.9,11)The splat morphology of the sprayed particles changed drastically from an irregular splash shape to a disk shape at the transition temperature.9)It is therefore suggested that the adhesion strength is strongly influenced by the substrate temperature.
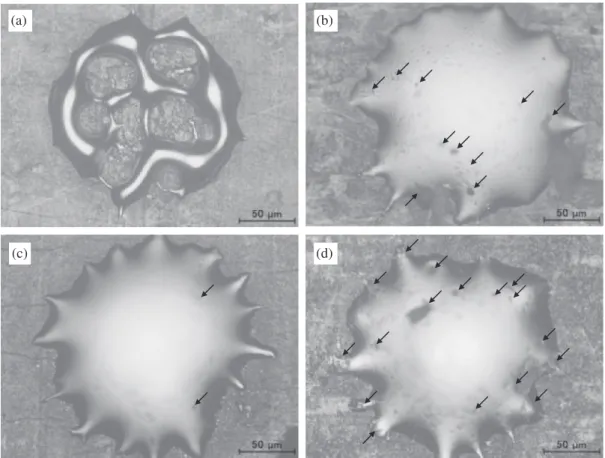
Figure 19 shows the changes in the morphology of a thermal spray droplet of the Fe-10Cr on a flat SS400 substrate (100 mm©100 mm©3.2 mm) at various substrate temperatures. In this case, the thermal spraying gun was scanned only one time. When the substrate temperature was Ts=275°C, the droplet splashed irregularly, as shown in
Fig. 19(a). When the substrate temperature wasTs=325°C,
the splat morphology of the sprayed particles changed drastically from an irregular splash shape to a disk shape, indicating the transition temperature is located near 325°C. At this temperature, the disk-shaped droplets have very smooth surfaces with metallic luster, and they contain some small spots that may be small crystallites, indicated by arrows in Fig. 19(b). When the substrate temperature increased to Ts=375°C, the morphology of the droplet was also disk
shaped, but many small branches were observed, as shown in Fig. 19(c). It has been reported that these branches can be formed when the wettability between the droplet and the substrate increases.7)At this temperature, the small spots on
the surface of the droplet were rarely observed; this coincides with the substrate temperature that yielded the maximum volume fraction of the amorphous phase, as previously shown in Fig. 16. When the substrate temperature increased toTs=425°C, many spots were observed on the surface of
the droplet. This may be due to the increase in partial crystallization as suggested by the results in Fig. 16. From the results shown in Figs. 16 and 19, it has been concluded that the transition temperature for the morphology of the sprayed droplet is about 325°C and that the optimum temperature to obtain the maximum volume fraction of the amorphous phase is about 375°C.
Figure 20 shows the relationships between the porosity in both the boundary and inside regions, the adhesion strength,
(d) (e) (f)
(a) (b) (c)
Fig. 17 Fracture surfaces of the four specimens around the K-thermocouple after tensile tests at each substrate temperatures (Ts): (a)Ts=324°C; (b)Ts=347°C; (c)Ts=377°C; (d)Ts=401°C; (e)Ts=431°C; (f )Ts=447°C.
Adhesion strength (Mpa)
Substrate temperature, T/°C 0
2 4 6 8 10 12 14 16 18
225 250 275 300 325 350 375 400 425 450 475
and the volume fraction of the amorphous phase in the Fe-10Cr sprayed coating films as a function of the substrate temperature.
When the substrate temperature was at or below the transition temperature of about 325°C, the volume fractions of the amorphous phase in the sprayed particles were very high, with values of 90%and above. However, high porosity
of more than 14% in the boundary region between the sprayed coating film and the substrate was observed. This may be due to the low wettability of the sprayed particles with the irregular splash shape.9,11)In this temperature region,
both the volume fraction of the amorphous phase and the adhesion strength decreased with increasing substrate temperature.
When the substrate temperature increased to the transition temperature region between 325 and 350°C, the porosity in the boundary region drastically decreased to about 6%, which may be due to the drastic increase in the wettability of the sprayed particles accompanied by the change of morphology from the splashed shape to the disk shape.9,11)
When the substrate temperature increased from the transition temperature up to 400°C, the porosity decreased gradually, and the volume fraction of the amorphous phase increased with increasing substrate temperature, resulting in the adhesion strength increasing up to about 15 MPa. In general, the volume fraction of the amorphous phase is strongly dependent on the cooling rate of the sprayed particles; when the substrate temperature is increased, the cooling rate of the sprayed particles should decrease. In this temperature region, the amount of heat transfer may be substantially increased because of the decrease in porosity in the boundary region, resulting in an increased cooling rate of the sprayed particles.10)Therefore, the optimum substrate
temperature to obtain the maximum cooling rate of the sprayed particles may be determined.
When the substrate temperature increased to 400°C and above, the porosity decreased, while the volume fraction of 0
2 4 6 8 10 12 14 16 18 20
200 225 250 275 300 325 350 375 400 425 450 475 30 40 50 60 70 80 90 100
Substrate temperature, T/°C
V
o
lume fraction of the amorphous phase(%)
Adhesion strength (MP
a)
Porosity(%)
Splash Disk Disk and crystallization
Porosity in the boundary region
Adhesion strength
Volume fluctuation of the amorphous phase Transition
temperature
Porosity in the inside region
Fig. 20 Relationships between the porosity in both the boundary and inside regions, the adhesion strength, and the volume fraction of the amorphous phase in the Fe-10Cr sprayed coatingfilms as a function of the substrate temperature.
(c)
(a) (b)
(d)
the amorphous phase decreased drastically with increasing substrate temperature, resulting in a drastic decrease in the adhesion strength to about 4 MPa. In this temperature region, the amount of heat transfer may be substantially decreased because of the increase in the substrate temperature, resulting in partial crystallization and the embrittlement of the Fe-based amorphous phase.13,14)
5. Summary
In order to obtain superior properties of Fe70Cr10P13C7
amorphous coating films, such as high hardness, high corrosion resistance, and soft magnetic properties, control of the substrate temperature is the most important point.
The volume fraction of the amorphous phase of the sprayed coatingfilm is strongly dependent on the cooling rate of the sprayed particles. When the substrate temperature increased from 325°C up to 400°C, the volume fraction of the amorphous phase increased. In this temperature region, the amount of heat transfer may be substantially increased with increasing substrate temperature because of the decrease in the porosity in the boundary region, which results in an increased cooling rate of the sprayed particles. Therefore, the optimum substrate temperature to obtain the maximum cooling rate of the sprayed particles may be determined.
REFERENCES
1) N. Nagao, M. Komaki, R. Kurahashi and Y. Harihara:J. Japan Inst. Metals71(2007) 742.
2) M. Komaki, T. Mimura, Y. Kusumoto, R. Kurahashi, M. Kouzaki and T. Yamasaki:Mater. Sci. Forum654656(2010) 1090.
3) M. Komaki, T. Mimura, Y. Kusumoto, R. Kurahashi, M. Kouzaki and T. Yamasaki:Mater. Trans.51(2010) 15811585.
4) M. Komaki, T. Mimura, R. Kurahashi, M. Kouzaki and T. Yamasaki: Mater. Trans.52(2011) 474480.
5) K. Murakami, S. Nakazono and T. Okamoto:Mater. Sci. Eng. A108 (1989) 271.
6) K. Murakami, Y. Fujii, H. Matsumoto, T. Irisawa, T. Okamoto, T. Kawai, J. Imazu, K. Niihara and Y. Miyamoto:Mater. Sci. Eng. A186 (1994) 105.
7) K. Murakami, H. Nakajima, N. Fijita, Y. Hanatate and S. Adachi: J. Therm. Spray Tech.21(2001) 63.
8) K. Murakami, N. Fijita, Y. Hanatate, S. Adachi and H. Nakajima:Surf. Eng.17(2001) 397.
9) M. Fukumoto: Yosha39(2002) 172. 10) K. Murakami: Yosha40(2003) 18.
11) M. Fukumoto, Y. Okuwa, M. Yamada, T. Yasui, Y. Motoe, K. Nakashima and T. Igarashi:Q. J. Japan Weld. Soc.26(2008) 74. 12) M. Fukumoto, C. Yokoi, M. Yamada, T. Yasui, M. Sugiyama, M. Ohara
and T. Igarashi:Q. J. Japan Weld. Soc.25(2007) 323.
13) M. Douyama and R. Yamamoto: Amorphous Materials, (University of Tokyo Press, Tokyo, 1983) p. 42.