Construction of Processing Map for Biomedical Co-29Cr-6Mo-0.23C-0.14N Alloy
by Using Compression Tests
Yui Yamashita
1, Yunping Li
2;*, Hiroaki Matsumoto
2, Yuichiro Koizumi
2and Akihiko Chiba
2;*1
Graduate School of Engineering, Tohoku University, Sendai 980-8577, Japan
2Institute for Materials Research, Tohoku University, Sendai 980-8577, Japan
The high-temperature deformation behavior of Co-29Cr-6Mo-0.23C-0.14N alloy was investigated by carrying out compression tests; the tests were carried out in the temperature range of 1000–1200C and strain rates ranging from 0.01 to 30 s1 with a height reduction of
approximately 65%. The optimum hot-working conditions were determined from the processing map based on the dynamic materials model. Dynamic recrystallization was observed to occur over the entire temperature and strain rate range. However, uniformly sized grains were formed for strain rates higher than 1 s1, which is considered to be the optimum hot-working condition. In addition, authors suggested that in extremely
low stacking fault energy alloy, explosive and homogeneous formation of mechanical twinning should be considered to be stable state, and new processing map with more detailed description of deformation mechanism seems necessary in future. [doi:10.2320/matertrans.M2010388]
(Received November 15, 2010; Accepted January 14, 2011; Published March 2, 2011)
Keywords: cobalt-chromium-molybdenum-carbon-nitrogen alloy, processing map, correction, twinning, dynamic recrystallization
1. Introduction
Co-Cr-Mo alloys are generally used as surgical implant materials for artificial hip and knee joints because of their excellent wear resistance, corrosion resistance, and bio-compatibility etc.1–3)Cast Co-Cr-Mo alloys potentially have low ductility and fatigue strength because of the extensive existence of casting defects and coarse grains.4)Hot forging is useful for optimizing and controlling the microstructures of these alloys. In order to develop a good-quality product without the defects such as cracks or localized shear bands, it is important to understand the plastic flow behavior and microstructural evolution during hot-forging. Moreover, microstructural evolution caused by dynamic recrystalliza-tion (DRX) during the hot-forging process results in fine equiaxed grains.
It is well known that Co-Cr-Mo alloys have extremely low stacking fault energy (SFE) even at high temperatures (approximately 22 mJm2 at 1000C as calculated, for example, by Yamanaka5)in the case of Co-29Cr-6Mo alloy), because the additions of Cr and Mo both reduce SFE at temperatures lower than 1000C.6) The low stability of phase due to the low SFE of Co-Cr-Mo alloys greatly hampers their applications as biomedical implants and conventional structural components because of their poor elongation and workability at room temperature. Therefore, Ni was added to improve the plasticity of this alloy. However, it has been reported that release of Ni ions into human bodies has a high possibility of causing the allergy.7)
Previous researches have showed that addition of N, C, or Zr could greatly enhance the stability of phase by increasing the SFE of CCM alloy.8) On the basis of previous results
observed by three-dimensional atomic probe, the stabilizing effect of phase by addition of N or C should be ascribed to the stable crystalline structure formed between Cr-N (or C)
atoms9)since the chromium has a much stronger interaction
with the interstitial N or C than cobalt.
In our previous research, an investigation on the dynamic recrystallization (DRX) behavior of CCM alloy with both C and N additions was given in details.10) In this study, a detailed analysis in the relationship between hot-deformation behavior and microstructural evolution has been carried out by using processing map. In addition, new friction and adiabatic correction method was used to obtain the intrinsic stress-strain curves of materials in order to plot processing map with high precision.
2. Experimental
Co-29Cr-6Mo-0.23C-0.14N (mass%) alloy (hereafter de-noted as CCMCN) was prepared by vacuum induction melting method. The ingot was homogenization-treated at 1225C for 12 h, and forged and was followed by a hot-swaging into a bar with a final diameter of 15 mm. Cylindrical specimens, 8 mm in diameter and 12 mm in height, were machined by electro-discharge machining (EDM). To reduce the non-uniformity of microstructure due to friction between the sample surface and jig, the flat ends of the specimen were machined with concentric grooves with a depth of 0.1 mm so that the lubricant in a molten state could flow freely inside the grooves at high temperatures.11)
In order to avoid the heat dissipation from sample ends to the anvil surfaces at the contact regions, mica sheets with a diameter of 20 mm and thickness of approximately 0.2 mm were used as heat insulators closely contacting with the anvil surfaces because of its extremely low thermal conductivity; they were placed close to the anvil surface. In addition, graphite sheet was used as an aid to reduce friction owing to its high lubricating effect and high heat resistance.
Compressive tests were carried out in vacuum at temper-atures ranging from 1000C to 1200C a step of 50C using a computer-aided Thermecmaster-Z hot-forging simulator. The selected strain rates were 0.01, 0.1, 1.0, 10, and 30 s1.
*Corresponding author, E-mail: [email protected], a.chiba@imr.
tohoku.ac.jp
The specimen was heated to 1200C at a rate of 5C s1 by
high-frequency induction heating; it was subjected to homogenizing heat treatment for 300 seconds after reaching the target temperature. As soon as the sample was com-pressed to the final strain level, it was quenched with a mixture of N2(6 MPa pressure) and He (4 MPa) at a cooling
rate of approximately 50C s1 to room temperature.
Crystallographic analysis was conducted by electron backscatter diffraction (EBSD) using an orientation imaging microscope (TexSEM Laboratories, Inc., Provo, UT) attached to the field-emission scanning electron microscope (FESEM). The surface of the specimen for the microstruc-tural observation was prepared by first dry grinding using SiC emery paper. Electrolytic polishing was subsequently conducted in a sulfuric acidic methanol (1 : 9) solution. TEM observation was carried out in the center of the compression test specimen parallel to the compression axis.
3. Results and Discussion
3.1 Correction of deformation curves
3.1.1 Friction correction
Figure 1 shows some typical true stress-true strain (-") curves for temperatures from 1000C to 1200C and strain rates from 102s1 to 30 s1. For all the deformation conditions, the -" curves exhibit typical DRX character-istics; specifically, the flow stress increases to a peak stress followed by work softening and steady-state flow is attained at higher strains. Furthermore, all the obtained -" curves have a single peak; neither the stress oscillations in the -" curves having multiple stress peaks nor dynamic recovery in -"curves for the case in which steady-state flow develops without work softening were observed. These raw-"curves obtained in the experiment must be corrected before plotting the processing map in order to eliminate the influence of friction on the flow behavior during the compression process. Previous research showed that the traditional correction of -"curves including both friction factor determination and friction correction potentially has a severe shortcoming, because the compressed sample was supposed to be very thin and it is assumed that there is no barreling in the edges of the sample, that is, the thickness is small enough and the average
axial stress z is constant across the height of sample.12,13)
However, in an actual cylindrical hot working process, the thickness of sample is generally higher than the radius of a sample. The stress across the height of a sample is considered not to be constant. The traditional way of both friction factor determination and friction correction could not be used in a cylindrical compression test. Therefore, the friction factor was determined by using the following relation on the basis of a previous research, which was proved to have relatively high precision than that of the traditional method:14)
ða0þa00"þa000"2PÞ þ ðb0þb00"þb000"2Þm
þ ðc0þc00"þc000"2Þm2 ¼0 ð1Þ
where
P¼RmH RtH0
; ð2Þ
where Rm, Rt, H, and H0 denote the maximum radius of
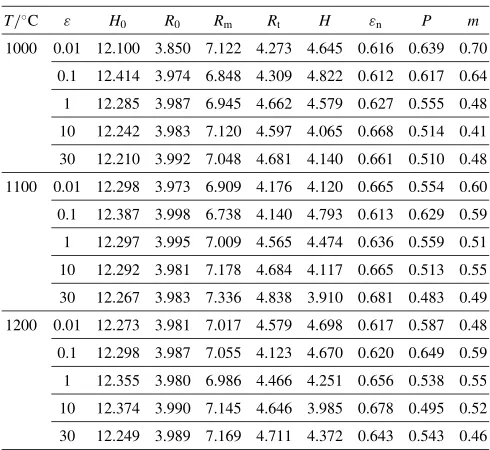
deformed sample, original top surface radius of sample after broadening during compression, final height, and initial height of sample, respectively;mis the Tresca friction factor between sample and anvil with value ranging from 0 (perfect sliding) to 1 (sticking friction), " the true strain, and the others are constants, which are independent of either compression condition and materials, and were described in our previous study in details.12) According to the above equations, the friction factormcould be read directly from Fig. 2. The parameters in eqs. (1) to (2) have been tabulated in Table 1.
The corrected stresses of sample can be calculated when the flow stress and friction factor,mare substituted into the following equation based on a previous research,13)
¼ z
1þ ðAþB"þC"2þD"3Þ m ð3Þ
wherez is the true stress obtained experimentally;mand"
are friction factor calculated from eq. (1), and true strain, respectively.
3.1.2 Adiabatic correction
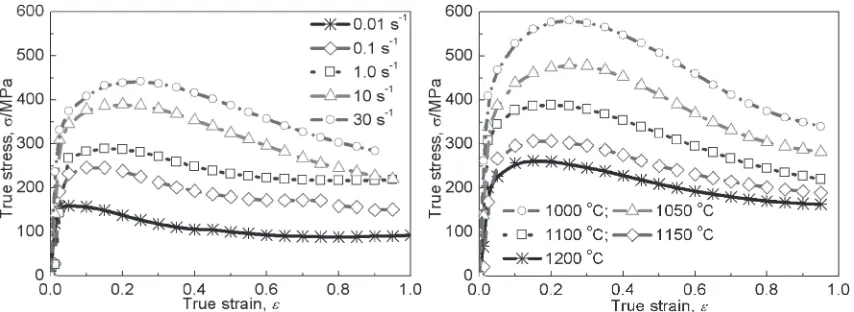
It has been reported that input energy during deformation is partially converted into heat due to adiabatic heating, resulting in the softening of the flow stress as compared to the Fig. 1 Flow behavior of Co-29Cr-6Mo-0.23C-0.14N alloys in hot compression tests. True stress-true strain curves (a) at a constant
[image:2.595.85.512.71.227.2]ideal isothermal deformation conditions.14)The temperature rise due to adiabatic heating during deformation is usually calculated by
T ¼e
c
Z"
0
d"¼e
cW ð4Þ
whereTis the temperature rise due to the work done on the sample,cis the heat capacity of the material,is density of sample,eis the heat efficiency, andWis the power inputted
into the sample. The e is usually considered to be
independent of strain rate. In fact, however, this value varies as a function of strain rate in the range of102to100s1by
the following equation according to a previous research by Matayaet al.15)
e¼0:316 log _""þ0:95 ð5Þ
When the strain rate,"", is below_ 102s1, it is considered no heat generated during the compression and henceeequals 0,
and above 1 s1,
ereaches to a maximum value of 0.95. The
temperature rise and the subsequent softening are usually more significant at high ""_due to the short dissipation time and high input energy. At a certain""_and strain level, the flow stress after adiabatic correction is generally calculated from
lnðÞ ¼Eþ Q
RT ð6Þ
where
E¼lnðA"nÞ; ð7Þ
whereR,T are gas constant and temperature, respectively. An example of deformation curve (T ¼1150C,""_¼1s1) after corrections of both friction and adiabatic heating are shown in Fig. 3; in this case the friction factor was calculated to be 0.52. It can be seen that the influence of friction on the deformation curve is not so significant in the true strain level below 0.6, while the effect of adiabatic heating on deforma-tion curves has a much influence on the entire shape of deformation curves.
3.2 Processing map
In the present study, a processing map based on the dynamic materials model (DMM) is used to understand and constitutively analyze the hot workability of the CCMCN alloy. Processing maps, including both power dissipation and instability maps, are developed on the basis of DMM.16)This model considers that the workpiece is a power dissipater and that the instant power dissipated at a given""_consists of two complementary parts: the G content and the J co-content, which are related to temperature rise and the microstructure dissipation, respectively. The factor that partitions the power betweenJandGis the strain-rate sensitivity (n) of the flow stress (); theJco-content is given by
J¼
Z
0
_
"
"d! ""_n
nþ1 : ð8Þ
The condition for an ideal linear dissipater is Jmax¼
""=_ 2. For a non-linear dissipater, the efficiency of power dissipation may be expressed in terms of a dimensionless parameter . The variation of with the temperature and strain rate constitutes the power dissipation map, and its Fig. 2 Relationships among nominal strain, friction factor, and parameter
[image:3.595.62.277.71.235.2]Pplotted by contour map.12)
Table 1 Parameters used in calculating the friction factor in eqs. (1) and (2).
T/C " H
0 R0 Rm Rt H "n P m
1000 0.01 12.100 3.850 7.122 4.273 4.645 0.616 0.639 0.70
0.1 12.414 3.974 6.848 4.309 4.822 0.612 0.617 0.64
1 12.285 3.987 6.945 4.662 4.579 0.627 0.555 0.48
10 12.242 3.983 7.120 4.597 4.065 0.668 0.514 0.41
30 12.210 3.992 7.048 4.681 4.140 0.661 0.510 0.48
1100 0.01 12.298 3.973 6.909 4.176 4.120 0.665 0.554 0.60
0.1 12.387 3.998 6.738 4.140 4.793 0.613 0.629 0.59
1 12.297 3.995 7.009 4.565 4.474 0.636 0.559 0.51
10 12.292 3.981 7.178 4.684 4.117 0.665 0.513 0.55
30 12.267 3.983 7.336 4.838 3.910 0.681 0.483 0.49
1200 0.01 12.273 3.981 7.017 4.579 4.698 0.617 0.587 0.48
0.1 12.298 3.987 7.055 4.123 4.670 0.620 0.649 0.59
1 12.355 3.980 6.986 4.466 4.251 0.656 0.538 0.55
10 12.374 3.990 7.145 4.646 3.985 0.678 0.495 0.52
30 12.249 3.989 7.169 4.711 4.372 0.643 0.543 0.46
[image:3.595.322.526.74.225.2] [image:3.595.46.291.309.534.2]domains may be interpreted in terms of specific micro-structural evolution processes. The data obtained after the above corrections are used in making the processing maps (i.e. power dissipation map and instability map).
The occurrence of instability has been proposed by Ziegler,17)who considered that the condition for the plastic flow to become unstable is given by
dD
d""_ < D
_
"
" ð9Þ
whereD is the dissipative function that is characteristic of the constitutive behavior of materials; it depends on the dissipative power.Dcan be replaced withJand a condition for microstructure-related flow instabilities is obtained as
ð""_Þ ¼@logðn=nþ1Þ
@log _"" þn<0: ð10Þ
In the preceding equations, the assumption that the flow stress obeys the power law with ""_ and temperature, T is necessary because the changes in the microstructure due to change in the deformation curve can easily be separated from the heat dissipation or theGcontour. The parameterð""_Þmay be plotted as a function of the temperature and strain rate and the region where it is negative will exhibit flow instabilities. Such a plot is called an instability map. The physical meaning of the above instability criterion is that if the system does not generate entropy at a rate that at least matches with the imposed rate, the system will localize the flow and cause flow instabilities. The instability map can be superimposed on the power dissipation maps to obtain the regions of flow instabilities.
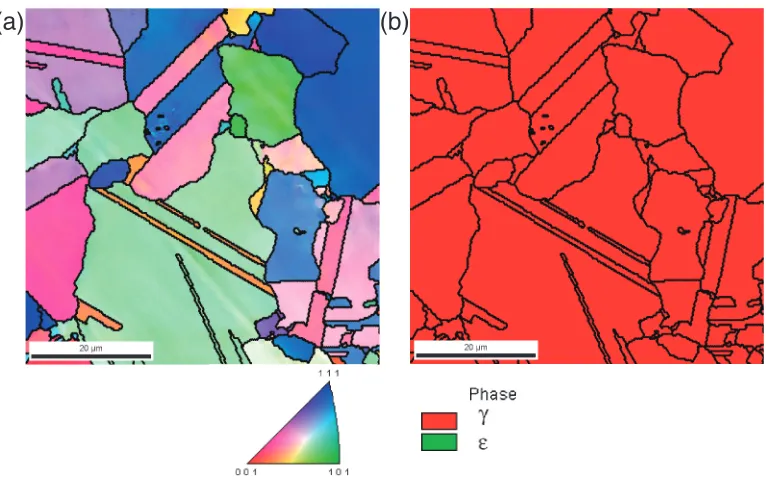
Inverse pole figure (IPF) map and the corresponding phase map of CCMCN sample before compression is shown in Fig. 4(a) and Fig. 4(b), respectively. The sample was solu-tion treated at 1200C for 300 s, and rapidly cooled at a rate of 50C s1. The initial grain size was measured to be 20–
30mmwith extensive annealing twinning boundaries within the matrix (Fig. 4(a)). The as-received sample was observed to be texture-free. No martensitic transformation occurred or no thermal"phase existed after cooling, indicating a much more stable phase compared to that in the CCM alloy without C or N addition, in which over half the phase transformed into " phase by martensitic transformation during a similar rapid cooling process.5)Although the results are not presented here, after various hot compression processes in the current study, little " phase was detected either by XRD or by EBSD, indicating the effective stabilization of phase with the addition of C and N in all cases.
Prior to plotting the processing map, all of the stresses at various conditions were corrected as mentioned above. The stress at true strain of 0.65 after these corrections of both friction and adiabatic heating are tabulated in Table 2. Typical power dissipation map generated for the temperature range 1000–1200C and""_range 0.01–30 s1, and a strain of
0.65 are shown in Fig. 5(a) and (b) in both three and two dimensions. The contour represents constant power dissipa-tion efficiencies that are expressed in percentage. At other strains, the nature of the map is not significantly different
(a)
(b)
Fig. 4 Initial microstructure of the CCMCN alloy after solution treatment at 1200C for 300 s and followed by annealing at 1150C for
[image:4.595.108.491.69.310.2]300 s. (a) inverse pole figure (IPF) map, and (b) phase map.
Table 2 Stresses at true strain of 0.65 used in plotting the processing map after both friction and adiabatic corrections.
_ " "/s1
T/C 0.01 0.1 1 10 30
1000 178.6 347.3 390.4 529.3 563.9
1050 131.3 246.4 301.1 409.4 455.2
1100 98.7 179.3 236.6 322.7 373.2
1150 75.7 133.4 189.2 258.6 310.3
[image:4.595.304.550.385.481.2]from that shown in Fig. 5, indicating that strain does not have a significant influence on the nature of the map. The maps exhibit a clear domain with maximum efficiency at approx-imately 1000C and 0.01 s1, and the domain exhibits its
maximum value at about 50–60%. In Fig. 6, the optimum efficiency in the DRX domain is plotted as a function of SFE and lower SFE metals have a lower efficiency of power dissipation from the result of Prasad et al.18) There is no data of the optimum power dissipation efficiency for SFE of CCMCN alloy. We extrapolated the relation between the optimum power dissipation efficiency and SFE. The range of SFE and optimum power dissipation efficiency is estimated from the SFE, and is plotted in the same figure by a rectangle. It is indicated that the optimum power dissipation efficiency of CCMCN alloy should be in the range of 20–30%, based on the supposition that the SFE in CCMCN alloy is equal to that of CCM alloy because the content of both C and N elements are extremely slight. Therefore, the optimum hot working condition for CCMCN alloy should be in the range of
T ¼1000{1200C, and""_above 1 s1as squared by a shaded
rectangle in Fig. 5(b).
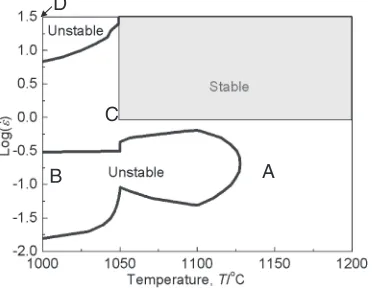
The instability map at strain of 0.65 is plotted in Fig. 7. By comparing the two maps in Fig. 6 and Fig. 7, it is suggested that the region in the temperature range 1050–1200C and strain rate range 1.0–30 s1 is the optimum for the forging process. It is interesting to observe that the region in the
temperature range of 1000–1050C and strain rate range 10– 30 s1was predicted to be unstable by the instability map. In
order to evaluate the reliability of the results predicted by processing maps, we selected four typical areas A (1150C, 0.1 s1), B (1000C, 0.1 s1), C (1050C, 1 s1), and D
(1000C, 30 s1) for microstructure observation, where both
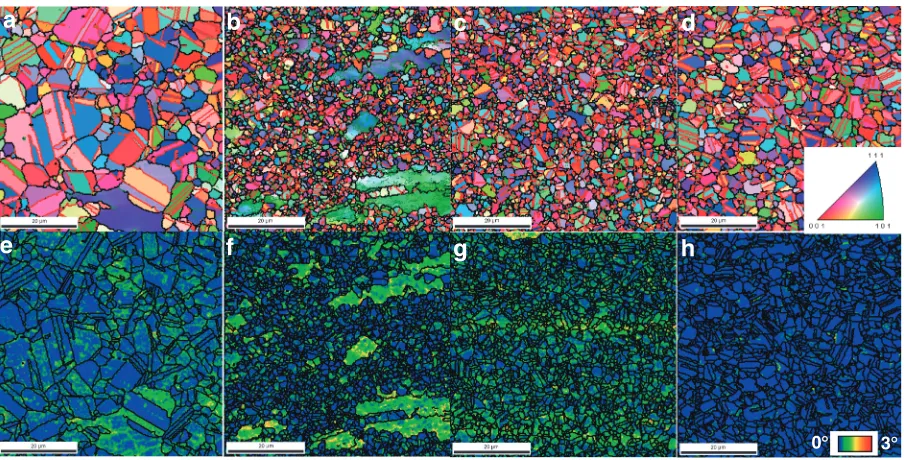
points A and C are stable conditions, and points B and D are unstable condition predicted by processing map. Figure 8 shows the IPF map (Fig. 8(a) to (d)) and the corresponding kernel average misorientation (KAM) maps for points A (Fig. 8(a), (e)), B (Fig. 8(b), (f)), C (Fig. 8(c), (g)), and D (Fig. 8(d), (h)) indicated in the instability map (Fig. 7). It can be seen that neither shear band nor deformation localization was observed, and homogeneously DRXed and fine grains were obtained at A and C compared to the initial micro-structure, which are in good agreement with the processing map. In addition, from their KAM maps, the residual strain in the entire microstructure was observed to be extremely low, indicating the completely DRXed microstructure (Fig. 8(e), (g)). The condition in point B (T ¼1000C, ""_¼0:1s1)
was predicted to be unstable plastic deformation from the processing map; correspondingly, the microstructure was observed to be partially DRXed microstructure (Fig. 8(b)) with the non-DRX area having high residual strain inside the matrix (Fig. 8(f)) implying the localization of deformation. The microstructure for point D (T¼1000, ""_¼30s1) is
(a)
(b)
Fig. 5 (a) The three dimensional and (b) two dimensional power dissipation map of CCMCN alloy at true strain level of 0.65.
Fig. 6 Correlation of optimum efficiency of power dissipation in dynamic recrystallization domain with normalized SFE in various metals.18)
A B
D
C
[image:5.595.89.510.72.236.2] [image:5.595.75.270.278.426.2] [image:5.595.335.522.285.430.2]contrary to the result predicted by the processing map. Extremely homogeneous and refined microstructure with relatively low residual strain inside all of the grains was observed (Fig. 8(d) and (h)), where unstable deformation was predicted by the processing map. DRX occurred at
T ¼1000C, ""_¼30s1 (condition D) is explosive and
instantaneous, implying that the DRX process should be controlled by a non-thermal activated process, since DRX by means of grain boundary bulging or migration is impossible to be realized in such a short time. More details of the microstructure at approximately the peak stress (true strain of 0.2) were revealed by TEM observation as shown in Fig. 9. The microstructure demonstrates extremely low dislocation density and extremely high density of mechanical twinning, indicating that the twinning dominated the deformation
process and that the refinement of the microstructure possibly proceeded through the explosive formation of deformation twinning.
I. Kartikaet al.ever did a similar research in Co-Ni-Cr-Mo alloy demonstrating that formation of mechanical twinning was predicted to be unstable condition by processing map.19)
P. V. Sivaprasad et al.20) also reported similar results and
indicated that twinning in deformation process easily lead to deformation localization or shear bands. In the current research, the condition of twining formation was also predicted to be unstable, and it is in good agreement with the above-mentioned results; however, in this alloy, due to their extremely low stacking fault energy, the explosive formation of twinning just leads to the extremely fine and homogeneous microstructure, which should be characterized
0°° 3°
a
b
c
d
e
f
g
h
Fig. 8 Microstructure observed by EBSD. (a)–(d) are IPF map, and (e)–(h) are KAM map. (a) and (e), (b) and (f), (c) and (g), as well as (d) and (h) were obtained by the deformation in conditions of A, B, C, and D points of Fig. 7, respectively.
500nm
Fig. 9 (a) TEM image of the sample deformed atT¼1000C,""_¼30s1, at a true strain of 0.2, and (b) selected diffraction pattern
[image:6.595.72.524.71.301.2] [image:6.595.84.514.357.556.2]to be stable condition. Processing map was proposed on the basis of general hot forging behavior of medium to high SFE metallic materials such as steel, Al-based alloy, and Ni-based alloy etc., in which deformation is generally a slipping dominant process, and the formation of mechanical twinning in these alloys usually required extremely high stress with a result of that in the vicinity of twinning area stress local-ization or micro shear band formed easily—the unstable of plasticity.16–18) The stress required for twinning formation
decreases with the SFE.21,22) In the current alloy with
extremely low SFE even at high temperature, perfect dislocations with Burgers vectorsa=2½1101tend to dissociate into Shockley partial dislocations bounded by the stacking fault (SF) in the {111} plane with stress possibly even low than that for slipping of perfect dislocations, and the successive formations of SF leads to the formation of mechanical twinning. Due to the existence of four kinds of {111} planes in each grain, the plenty formation of mechanical twinning along these planes has a high possibility of breaking the initial grains into pieces (i.e. grain refining). Although, further investigation regarding the refinement through twinning formation is necessary, which is in progress in our group, it is obvious from the result of the present study that a new processing map with more detailed description in deformation mechanism is necessary. For extremely low SFE alloy, explosive and homogeneous formation of mechanical twinning should be characterized to be stable state.
4. Conclusions
The hot deformation behavior of Co-29Cr-6Mo-0.23C-0.14N alloy was studied over the temperature range 1000– 1200C and strain rate range 0.01–30 s1 in the hot
compression process by means of processing map in addition to friction correction, and adiabatic correction; the results obtained are as follows:
(1) The optimum safe processing regime based on the instability map was determined to be at temperatures 1050–1200C and strain rates 1–30 s1.
(2) In the domain of dynamic recrystallization, the power efficiency value was predicted to be in the range 20– 30% for the current alloy, based on the relationship between SFE and optimum power dissipation efficiency of various metals.
(3) The microstructure observation reveals that processing map is relatively reliable in predicating the optimum condition of hot working for current alloy; however, a
new type of processing map in which the explosive and homogeneous formation of mechanical twinning are taken into accounts, is necessary especially for improv-ing the applicability of processimprov-ing map for extremely low SFE alloy.
Acknowledgements
This research was supported by a Regional Innovation Cluster Program 2010 from Ministry of Education, Culture, Sports, Science and Technology of Japan.
REFERENCES
1) M. G. Shettlemore and K. J. Bundy: Biomaterials22(2001) 2215– 2228.
2) H. Y. Lin and J. D. Bumgardner: Biomaterials25(2004) 1233–1238. 3) H. C. Hsu and S. S. Lian: J. Mater. Process. Technol.138(2003) 231–
235.
4) H. S. Dobbs and J. L. M. Robertson: J. Mater. Sci.18(2004) 391– 401.
5) K. Yamanaka, M. Mori, S. Kurosuet al.: Metall. Mater. Trans. A40A (2009) 1980.
6) S. Lee, N. Nomura and A. Chiba: Mater. Trans.49(2008) 260–264. 7) T. Hanawa and T. Yoneyama: kinzoku-biomaterial, (Korona press,
2007) pp. 1–33.
8) A. Chiba: Materia Japan46(2007) 194–198.
9) Y. P. Li, J. S. Yu, T. Otomo, H. Matsumoto, Y. Koizumi and A. Chiba: Appl. Phys. Lett. Submitted.
10) Y. Yamashita, Y. P. Li, E. Onodera, H. Matsumoto and A. Chiba: Mater. Trans.51(2010) 1633–1639.
11) Y. P. Li, E. Onodera, H. Matsumoto and A. Chiba: Metall. Trans. A 40A(2009) 982–990.
12) Y. P. Li, E. Onodera and A. Chiba: Metall. Trans. A51(2010) 1210– 1215.
13) Y. P. Li, E. Onodera and A. Chiba: Metall. Trans. A51(2010) in print. 14) A. K. Koul and J. P. Immarigeon: Acta Metall.35(1987) 1791–1805. 15) M. Mataya and V. Sackschewsky: Metall. Mater. Trans. A25(1994)
2727–2752.
16) Y. V. R. K. Prasad, H. L. Gegel, S. M. Doraivelu, J. C. Malas, J. T. Morgan, K. A. Lark and D. R. Barker: Metall. Trans.15A(1984) 1883– 1892.
17) H. Ziegler:Progress in Solid Mechanics, 4, ed. by I. N. Sneddon and R. Hill, (Wiley, New York, 1965) pp. 91–193.
18) Y. V. R. K. Prasad and T. Seshacharyulu: Int. Mater. Rev.43(1998) 243–258.
19) I. Kartika, Y. P. Li, H. Matsumoto and A. Chiba: Mater. Trans.50 (2009) 2277–2284.
20) P. V. Sivaprasad, S. Venugopal, Sridhar Venugopal, V. Maduraimuthu, M. Vasudevan, S. L. Mannan, Y. V. R. K. Prasad and R. C. Chaturvedi: JMPT132(2003) 262–268.
21) T. Ericsson: Acta Metall.14(1966) 853–65.