Tie-Line Compositions of the
£
and
¤
Phases in the Binary Re
Ni System
+1Shigeru Saito
1, Toshiyuki Takashima
1, Katsumi Miyama
1, Kazuya Kurokawa
2and Toshio Narita
2,+2 1Hokkaido Institute of Technology, Sapporo 006-8585, Japan2Center for Advanced Research of Energy and Materials, Faculty of Engineering, Hokkaido University, Sapporo 060-8628, Japan
Compositions with tie lines between the£and¤phases in a binary ReCrNi system were investigated at 1423, 1573, and 1773 K by heat treating of Ar-arc-melted Re40 at%Ni alloy. The microstructures of the Re40 at%Ni alloy which had been water quenched after various heat treatment were observed and their concentration profiles for Re and Ni were measured using an electron probe microanalyzer. The Re40 at%Ni alloy consisted of the£and¤phases. The tie lined compositions of the£and¤phases are summarized as follows (in at%);£: 13.4 Re86.6 Ni,¤: 71.7 Re28.3 Ni at 1423 K,£: 16.4 Re83.6 Ni,¤: 69.3 Re30.7 Ni at 1573 K,£: 20.2 Re79.8 Ni,¤: 65.3 Re34.7 Ni at 1773 K. The ReNi alloy powder sintered using the Spark Plasma Sintering (SPS) method were investigated. Solubility limit of Ni in the¤phase in the binary alloy system at 1423 K was found to be 28.3 at%Ni. [doi:10.2320/matertrans.M2012028]
(Received January 19, 2012; Accepted March 7, 2012; Published May 25, 2012)
Keywords: rheniumnickel, phase equilibrium diagram, tie-line, diffusion barrier layer, gamma phase, delta phase, solubility limit
1. Introduction
To enhance the thermal efficiencies of gas turbines and jet engines, the temperature of the combustion gas has been continuously increasing.1) Thermal barrier coating (TBCs) are used to protect the Ni-based superalloy in the turbine rotor blades from such extremely hot combustion gases and internal air or steam cooling is employed to reduce the temperature rise of the base material.2)However, even when TBCs and cooling systems are employed,3)Ni-based single-crystal superalloys with high-temperature strength still need to be developed because the temperature of the base material is expected to exceed 1273 K. One problem is inward diffusion of Al, which is placed in the bond coating layer for the purpose of forming protective scales of Al2O3. Such diffusion reduces the concentration of Al and lowers the oxidation resistance of the coating.4,5)To prevent diffusion of Al into the substrate, a number of diffusion barrier coatings have been proposed;69) however, after a relatively short oxidation time the barrier layer loses its layer structure, resulting in rapid, catastrophic oxidation. Narita et al.
proposed a diffusion barrier coating with a duplex layer structure, containing the ·-phase of ReCrNi as the diffusion barrier layer. In this coating, the ·-layer was sandwiched between a Ni-based superalloy and Ni-alumi-nides in the Al-reservoir layer.10,11)
To elucidate the properties of the ReCrNi alloy, information regarding its phase diagram and diffusivity is required.12,13) It is essential to determine the structural stability of the sandwiched ReCrNi alloy layer. Narita
et al. proposed that the diffusion barrier layer should be
formed at high-temperature such as 1573 K.14)
Both experimental and calculated ReCrNi phase dia-grams have been reported,1517) and a comparison shows a distinctive difference in the Ni solid solubility limit in the ¤ phase of the ReNi binary system. Two-phase diagrams for
the ReNi binary system have been reported by Okamoto18) and Nashet al.19)
In this present study, we discuss experimental results with respect to the tie-line compositions of the£ and¤phases in the binary phase diagram for a formation process of the diffusion barrier layer.
2. Experimental Procedure
2.1 Re40 at%Ni alloy by arc melting
Re40 at%Ni alloy in the £¤ two-phase region was used in the present study. The starting materials were Re powder (purity: 99.9 mass%) and Ni powder (purity: 99.95 mass%). After weighing the powders, metal foams (¤13 mm©t3 mm pellets weighing about 4 g) were fabricated by pressurization (load: 502 MPa). The metal foams were produced by dissolution and solidification using an argon-arc-melting furnace with a titanium getter. The resulting ingot was cut perpendicularly to obtain alloy test samples.
The segmented arc-melted samples for the heat-treatment experiment were enclosed in transparent quartz tubes (¤13 mm) with a reduced pressure of approximately 5©10¹4Pa. After maintaining them at 1423 K for 2400 h, 1573 K for 2100 h, and 1773 K for 24 h, the tubes were crushed under water to quench the samples.
Following heat treatment at 1423, 1573, and 1773 K for various times, the surfaces of the quenched samples were mirror-polished using polycrystalline diamond abrasives. Microstructural observations and quantitative elemental analysis were then conducted using an electron probe microanalyzer (EPMA; JEOL, JXA8200). Point analysis was performed at 1 mm intervals at an acceleration voltage of 15 kV and a probe current of 3.5©10¹8A. After confirming that the Re and Ni concentrations were uniform (i.e., within
«1 at%) over the entire phase, the tie-line composition was
determined from the average of the measurement points within the area from 2 to 7 µm depth from the interface. Data from the region closer to the interface were not used because of uncertainties due to the beam size (¤1 µm) of the EPMA.
+1This Paper was Originally Published in Japanese in J. Japan Inst. Metals
75(2011) 479484.
2.2 ReNi alloys by spark plasma sintering
The Re melting point (3459 K) is about 2000 K higher than that of Ni, the sample fabricated by arc melting was not possible to obtain an alloy sample in the ¤ single-phase region. Therefore, to smelt alloy samples possessing a ¤ single-phase structure, Re and Ni powders were uniformly mixed in a planetary ball mill, and were sintered using spark plasma sintering.
The ReNi alloys had the compositions (at the time of mixing) shown in Table 1. Alloy samples#1 and#2 are in the ¤single-phase region and samples#3,#4, and#5 are in the £¤two-phase region.
The mixed Re and Ni powders were compressed in a graphite die at 32 MPa using a cylindrical graphite punch in a vacuum of 4 Pa at 1313 K for 10 min in order to prepare sintered samples (¤9 mm©t3 mm pellets). The samples were then segmented for the heat-treatment experiment and enclosed in transparent quartz tubes (¤13 mm) with a reduced pressure of approximately 5©10¹4Pa. After maintaining them at 1423 K for 169 h and 1903 K for 5 min, the tubes were crushed under water to quench the samples.
Microstructural observations and quantitative elemental analysis were then conducted using EPMA.
3. Results and Discussions
Figure 1 shows the macrostructure (a) and microstructure (b) of the lower part of the cross section of the arc-melted sample. Gray and dark gray forms are visible in the lower part of the sample, which possess a structure that surrounds the grain structures or dendrite structures clearly visible in the images.
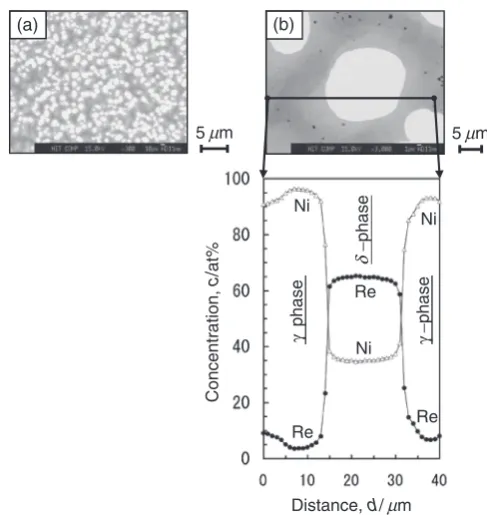
Figure 2 shows the cross-sectional microstructure and profiles measured along a line for the Re40 at%Ni alloy that was quenched in water following heat treatment at 1573 K for 240 h. There are bright and dark gray microstructures in the cross-sectional microstructure and concentration distribution data, which correspond respectively to the£and¤phases. In addition, there are reverse concentration gradients between Re and Ni in the ¤phase near the£/¤interface.
Figure 3 shows the cross-sectional microstructure and Re and Ni concentration profiles measured along lines for the Re40 at%Ni alloy that had been quenched in water following a heat treatment of (a) 2400 h at 1423 K, (b) 2100 h at 1573 K and (c) 24 h at 1773 K. In all samples, the cross-sectional microstructure exhibits bright and dark gray contrast, indicating the presence of a £¤ two-phase composition. In addition, within each phase, the concen-tration of each element is uniform except near the phase interface.
[image:2.595.347.504.70.274.2]Based on the data shown in Fig. 3, the tie-line composi-tions for the£and¤phases were determined. The results are summarized in Table 2, where the values in parentheses show the average with maximum and minimum deviation of the concentrations. The tie-line compositions from Table 2 are shown superimposed on the phase diagram for the binary Re Table 1 Nominal compositions of sintered ReNi alloys (at%).
Alloy Re Ni
#1 (Re5Ni) 95 5
#2 (Re11Ni) 89 11
#3 (Re22Ni) 78 22
#4 (Re30Ni) 70 30
#5 (Re70Ni) 30 70
(a)
50
(b)
μ
m
10
μ
m
Fig. 1 Cross-sectional images of as-melted Re40 at%Ni alloy. (a) Macro-structure and (b) microMacro-structure.
Ni
Re
Concentration,
c
/at%
Distance,
d
/
Ni
Re
−
phase
−
phase
δ
γ
μ
m
5
μ
m
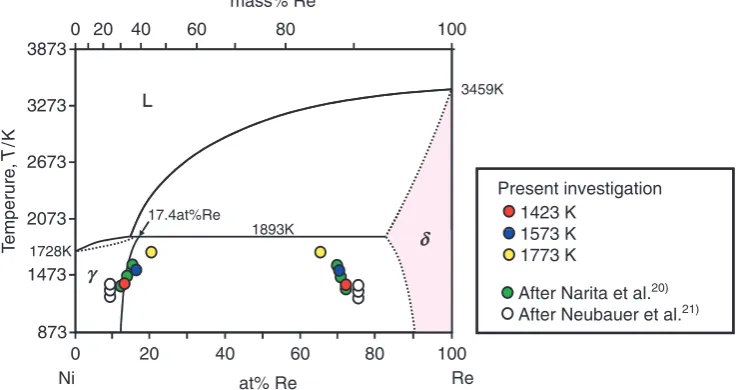
[image:2.595.48.290.84.161.2] [image:2.595.331.521.321.655.2]Ni system reported by Okamoto in Fig. 4, and that reported by Nashet al.in Fig. 5. A line indicating the solid solubility limit of the ¤ phase is shown in Fig. 4 (solid) and Fig. 5 (dotted), but it is unclear what this line truly represents. From the results of the present study, the Ni solubilities of the £ phase and the tie-line compositions of the ¤ phase are 28.3 at% for 1423 K, 30.7 at%for 1573 K, and 34.7 at% for 1773 K. Moreover, Narita et al.20) reported values of 28 30 at%for 13731573 K. These results are shown along with those of Neubaueret al.21)in Figs. 4 and 5. In other words, it is clear that the results of the present study are in agreement Ni
Re (a)
Ni
Re (b)
Concentration,
c
/
at%
Ni
Re (c)
Concentration,
c
/
at%
Ni
Re
Concentration,
c
/
at%
Ni
Re
Ni
Re
Distance, d/μm Distance, d/μm Distance, d/μm
−
phase
δ −
phase
δ −
phase
δ
−
phase
γ −
phase
γ −
phase
γ
5μm
5μm 5μm
[image:3.595.90.512.69.325.2]Fig. 3 Cross-sectional microstructure and concentration profiles of Re and Ni measured along lines for Re40 at%Ni alloy following heat treatment. (a) 2400 h at 1423 K, (b) 2100 h at 1573 K and (c) 24 h at 1773 K.
Table 2 Terminal compositions (at%) of£and¤phases in Re40 at%Ni alloy obtained by heat treatment at 1423, 1573 and 1773 K.
Temperature (K)
£phase ¤phase
Re Ni Re Ni
1423 13.4
(0.3)
86.6 (0.3)
71.7 (0.4)
28.3 (0.3)
1573 16.4
(0.3)
83.6 (0.3)
69.3 (0.8)
30.7 (0.8)
1773 20.2
(0.3)
79.8 (0.3)
65.3 (0.9)
34.7 (1.0)
0 20 40 60 80 100
3459K
1893K 2373
2873 3373
L L
δ
17.4at%Re
11.7at%Re 83at%Re Present investigation
1423 K mass% Re
0 20 40 60 80 100
873 1373 1873
T
emperature,
T
/
K
1728K
γ
1573 K 1773 K
After Narita et al.20)
After Neubauer et al.21)
Re at% Re
Ni
Fig. 4 Compositions of the£and¤phases of a binary ReNi system in contrast to those reported by Okamoto,18)Narita,20)and Neubauer
[image:3.595.114.484.393.592.2] [image:3.595.47.291.684.786.2]with those of previously reported dispersion experiments. In addition, the phase diagrams reported by Okamoto and Nash
et al.essentially agree regarding the Ni solubility limit of the £ phase for alloys fabricated by both arc melting and spark plasma sintering.
Figures 6(a), 6(b) and 6(c) respectively show the cross-sectional microstructure of sintered alloy samples #1 (Re 5 at%Ni), #2 (Re11 at%Ni) and #3 (Re22 at%Ni) that were quenched in water following heat treatment for 169 h at 1423 K. The uniform bright contrast indicates that these samples all consist of a single phases. Voids in the samples appear as dark gray regions. Moreover, based on the concentration of Re and Ni, the samples have a ¤-phase composition with a Ni content of (a) 5.9 to 6.4 at%, (b) 11.2 to 12.0 at%, and (c) 22.0 to 22.1 at%.
Although the peritectic temperature is 1893 K based on the phase diagrams reported by both Okamoto and Nash et al., differences between the Ni solid solubility limit in the¤phase were observed. Therefore, heat treatment experiments were conducted at 1423 and 1903 K in order to clarify the Ni solid solubility limit of the¤phase.
Figures 7(a) and 7(b) show photographs of sintered alloy samples #4 (Re30 at%Ni) that was quenched in water following a heat treatment of (a) 169 h at 1423 K and (b) 5 min at 1903 K. Whereas the sample in Fig. 7(a) is pellet shaped, that in Fig. 7(b) is button shaped, which is thought to
be the result of partial melting during the higher temperature heat treatment.
Figure 8 shows the cross-sectional microstructure and profiles measured along a line for sintered alloy sample #4 (Re30 at%Ni) that was quenched in water following heat treatment at 1423 K for 169 h. The bright¤ phase is seen to consist of 71.7 at%Re and 28.3 at%Ni, whereas the gray £ phase consists of 15.3 at%Re and 84.7 at%Ni. Moreover, the Re and Ni concentrations in the£and¤phases are seen to be fairly uniform. From these results, the Ni solid solubility in the ¤ phase is similar to that for the alloy sample prepared by arc melting and rapidly cooled after heat treatment at 1423 K for 2400 h.
0 20 40 60 80 100
2073 2673 3273 3873
L L
17.4at%Re
Present investigation 1423 K
3459K mass% Re
Re
0 20 40 60 80 100
at% Re Ni
873 1473
T
e
mperure,
T
/
K
γ
δ
1893K 1728K
1573 K 1773 K
After Narita et al.20)
After Neubauer et al.21)
Fig. 5 Compositions of the£and¤phases of a binary ReNi system in contrast to those reported by Nash et al.,19)Narita,20)and Neubaueret al.21)
(a) (b) (c)
10μm
Fig. 6 Cross-sectional microstructure of sintered alloys following heat treatment at 1423 K for 169 h. (a) Re5 at%Ni, (b) Re11 at%Ni and (c) Re22 at%Ni.
(a)
5mm
5mm
(b)
[image:4.595.114.484.75.270.2] [image:4.595.84.512.326.426.2]Figures 9(a) and 9(b) show the cross-sectional macro-structure and micromacro-structure, respectively, of sintered alloy samples #5 (Re70 at%Ni) that was quenched in water following heat treatment at 1903 K for 5 min. Figure 9(b) shows the profiles measured along a line indicated in the cross-sectional microstructure. It can be seen that the bright¤ -phase grains are completely enclosed in the Ni-rich£phase. In contrast to the Re30 at%Ni alloy shown in Fig. 8, the¤ phase possesses afine-grained structure, whereas the£phase forms the basic matrix.
At 1903 K, as shown by the phase diagrams reported by Okamoto and Nashet al., because the liquid and¤phases can coexist, it is believed that the£phase melted during the heat treatment. Moreover, from the Re and Ni distributions obtained in the present study, the Ni concentration in the ¤ phase is 35 at%.
Although locally uniform regions were produced in the alloy samples fabricated by arc melting, it was not possible to obtain a uniform structure across the entire sample even when heat treatment was performed for long time periods. On the other hand, it was possible to produce samples with a ¤ single-phase structure by the spark plasma method; however, large differences (the precise values are not reported) occurred at the melting points of the ¤ and £ phases, and numerous voids were formed in the sample. The results obtained in the present study concerning the Ni solid solubility limits in the¤phase using both sample preparation
methods do not agree with results obtained from previously reported phase diagrams.
4. Conclusions
ReNi alloys were fabricated by arc melting and spark plasma sintering, followed by heat treatment for a prescribed period of time and subsequent quenching in water. Using these samples, the tie-line compositions of the¤and£phases in the binary ReNi system were experimentally determined by cross-sectional microstructural observations and composi-tional analysis using EPMA. The following results were obtained:
(1) For the Re40 at%Ni alloy fabricated by arc melting, the tie-line compositions of the ¤ and £ phases were experimentally determined at 1423, 1573, and 1773 K. (2) The solid solubility of Re in the£phase was 13.4 at% at 1423 K, 16.4 at%at 1573 K, and 20.2 at%at 1773 K, which was in accordance with the results of the calculated phase diagrams and previously reported diffusion-couple experiments.
(3) The solid solubility of Ni in the¤phase was 28.3 at%Ni at 1423 K, 30.7 at%at 1573 K, and 34.7 at%at 1773 K, which agreed with the results of the previously reported diffusion-couple experiments.
(4) In the Re30 at%Ni alloy fabricated by spark plasma sintering, the solid solubility of Ni in the ¤ phase at 1423 K was 28.3 at%.
(5) The solid solubility of Ni in the ¤ phase was in agreement for alloy samples prepared by both arc melting and spark plasma sintering, but did not agree with value obtained from the previously reported phase diagrams.
Re
Ni
Concentration,
c
/at%
Distance,
d
/
Ni
Re
−
phase
γ
−
phase
δ
5
μ
m
μ
m
Fig. 8 Cross-sectional microstructure and concentration profiles of Re and Ni measured along line for sintered Re30 at%Ni alloy following heat treatment at 1423 K for 169 h.
Ni
Ni
Re (b)
(a)
Concentration,
c
/
at%
Distance, d/ Re
Ni
Re
γ
phase
γ −
phase
−
phase
δ
5μm 5μm
μm
[image:5.595.302.546.66.324.2] [image:5.595.79.259.71.403.2]Acknowledgment
This work was supported by a Grant-in-Aid for Scientific Research (Young Scientists (B), No. 21760591) from Japan Society for the Promotion of Science.
REFERENCES
1) H. Harada and T. Yokokawa:Materia Japan42(2003) 621625.
2) T. Hino, Y. Yoshioka, Y. Ishiwatari, A. Nagata, T. Kobayashi, Y. Koizumi and H. Harada: Report of the 123rd Committee on Heat-Resisting Materials and Alloys, (Japan Society for the Promotion of Science,401999) pp. 141150.
3) Y. Koizumi, J. X. Zhang, T. Kobayashi, T. Yokokawa, H. Harada, Y. Aoki and M. Arai: J. Japan Inst. Metals67(2003) 468471. 4) P. Elliott and A. F. Hampton:Oxid. Met.14(1979) 449468.
5) S. W. Yang:Oxid. Met.15(1980) 375397.
6) H. Hosoda, T. Kingetsu and S. Hanada: The Third Pacific Rim Int. Conf. on Advanced Materials and Processing (PRICM 3), (1998) pp. 23792384.
7) J. Mulle and D. Neuschutz:Vacuum71(2003) 247251.
8) R. Cremer, M. Witthaut, K. Reichert, M. Schierling and D. Neushutz:
Surf. Coat. Technol.108109(1998) 4858.
9) O. Knotek, F. Loffler and W. Beele:Surf. Coat. Technol.61(1998) 613.
10) T. Narita, T. Izumi, T. Nishimoto, Y. Shibata, K. Z. Tosin and S. Hayashi:Mater. Sci. Forum522523(2006) 114.
11) H. Matsumaru, S. Hayashi and T. Narita:Mater. Sci. Forum522523
(2006) 285292.
12) S. Saito, K. Kurokawa, S. Hayashi, T. Takashima and T. Narita:
J. Japan Inst. Metals71(2007) 608614.
13) S. Saito, K. Kurokawa, S. Hayashi, T. Takashima and T. Narita:
J. Japan Inst. Metals72(2008) 132137.
14) H. Matsumaru, S. Hayashi and T. Narita:Mater. Sci. Forum522523
(2006) 285292.
15) S. Saito, K. Kurokawa, S. Hayashi, T. Takashima and T. Narita:
J. Japan Inst. Metals71(2007) 793800.
16) S. Saito, K. Kurokawa, T. Takashima and T. Narita: J. Japan Inst. Metals72(2008) 639643.
17) S. Saito, K. Kurokawa, T. Takashima and T. Narita:Mater. Trans.52
(2011) 21742177.
18) H. Okamoto:J. Phase Equilib.13(1992) 335.
19) A. Nash and P. Nash:Bulletin of Alloy Phase Diagrams6(1985) 348 350.
20) S. Narita: Master’s thesis, Graduate School of Hokkaido University, (2003).
21) C. M. Neubauer, D. Mari and D. C. Dunand:Scr. Metall. Mater.31