ment in the grain boundary coverage decreases with lanthanum content, the composite strengthening (composite materials effect) starts to play a more significant role in increasing yield stress. As the grain boundary coverage reaches a plateau at about 2%La, further increase in the yield stress is mainly due to the composite strengthening, the effect of which is dependent on the volume fraction of eutectic. During tensile-testing at 150 C, the alloys with higher lanthanum content exhibited dual yield points, the first from yielding of the primary α-Mg, followed by the higher-yield point associated with the eutectic. This suggests that composite strengthening is in effect.
[doi:10.2320/matertrans.L-M2017847]
(Received September 4, 2017; Accepted September 28, 2017; Published December 25, 2017)
Keywords: magnesium-lanthanum-zirconium alloys, eutectic, yield stress, grain boundary coverage, composite strengthening
1. Introduction
Among the practical metals, magnesium (Mg) has the lowest density and can be applied in various fields, particu-larly in vehicles, as one method of protecting the global environment.
Adding rare earth (RE) elements to Mg alloys can im-prove the strength and creep resistance1). Particularly, heavy
RE elements such as yttrium (Y), gadolinium (Gd), and dys-prosium (Dy), which have high solid solubilities in Mg, are of use in solid solution strengthening and precipitation hard-ening. Excellent heat-resistant Mg alloys with these ele-ments have also been fabricated2). Another report states that
trace amounts of cerium (Ce) can improve the formability of Mg3). In addition, RE elements have low toxicity to living
organisms and have recently attracted attention as alloying elements for biodegradable Mg-based materials4). However,
the effect of REs on Mg alloys varies widely.
Even before individual RE was technically available, REs have been used in the form of Mischmetal for Mg alloys5).
In particular, because the presence of RE elements does not inhibit crystal grain refinement by zirconium(Zr), the Mg– RE–Zr system has been studied in casting, and several WE-series and other Mg alloys have been developed.
Lanthanum (La), a light RE, has very limited solubility in Mg and hence it does not contribute to age-hardening6,7).
Generally, the contribution of La to creep resistance is also considered to be less than those of Ce and praseodymium (Pr)7,8). However, among the light REs, La has the lowest
density; it is also inexpensive and easy to handle. In addi-tion, a eutectic reaction is attained by the addition of a small amount of La, which forms the thermally stable intermetallic compound of Mg12La. When Zr is added as well, the
pri-mary α-Mg dendrite crystals are transformed to fine spheri-cal crystals which are surrounded by eutectic areas, forming
a uniformly solidified structure9).
The mechanical properties of Mg–La–Zr alloys are af-fected by the hard eutectic phase9,10). Because the eutectic
forms a three-dimensional networked-structure in the alloy, recent research using 3D structural observation11) has been
conducted. However, the influence of the eutectic on the me-chanical properties is not fully known.
In this study, we report on the yielding behavior as influ-enced by the eutectic of Mg–La–Zr alloys from the perspec-tive of the microstructure and mechanical properties.
2. Experimental Procedure
Mg–La–Zr alloys containing 0 to 4.2%La were prepared from 99.92%Mg, 99.9%La, and Mg– 33%Zr master alloy (all in mass%). The addition amount of Zr was set to 1.5%. Tensile tests were performed at room temperature and 150 C, in accordance with JIS Z 2241 and JIS G 0567, re-spectively. In both cases, the specimens were made in accor-dance with JIS 14 A, with a parallel part of 6 mm in diame-ter and a gauge length of 30 mm. An initial strain rate was set to 5.5 × 10⁻⁴ s−1.
The Vickers hardness and Young s modulus of the primary
α-Mg and the eutectic phase were estimated using a na-no-indentation tester (HM 500, manufactured by Fischer)12,13). The test load was 25 mN, and the indenter was
a Vickers indenter shaped as a square pyramid. For each sample, the microstructure was observed with an optical mi-croscope and a field-emission scanning electron mimi-croscope (FE-SEM; acceleration voltage 10 kV).
3. Results and Discussion
3.1 Structure and mechanical properties of constituent phases
The constituent phases of the Mg–La–Zr alloy are pri-mary crystalline α-Mg and the eutectic (αMg + Mg12La).
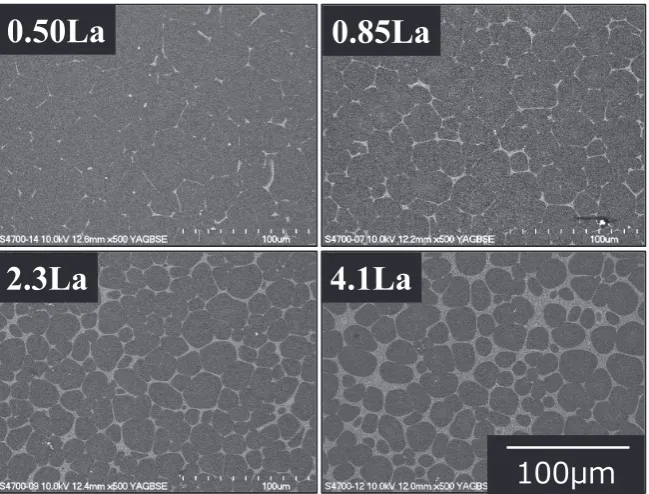
Figure 1 shows a back-scattered electron image of the Mg–
La–Zr alloys; the darker regions that appear in spherical morphology are the primary α-Mg crystals, while those that appear in white are eutectic areas, surrounding the primary
α-Mg crystals and forming a network pattern. In addition, the area ratio increases with increasing La content.
As shown in Fig. 2, the average Vickers hardness values of the primary α-Mg and eutectic compound are HV 47 and HV 152, respectively. The average contact pressure Pm
(load/projected impression area) by the indenter relates pro-portionally to the yield stress σy, i.e., Pm ∝ σy14). Because
the Vickers hardness is defined as the load divided by the impression surface area, HV = 0.927 Pm is obtained by
con-verting the impression surface area into the projected im-pression area15). In addition, the proportionality of HV and
Pm indicates that the yield stress of the eutectic compound at
room temperature is estimated to be approximately three times that of primary α-Mg. As shown in Fig. 3, the Young s modulus is 30 GPa for primary α-Mg and 52 GPa for the eu-tectic. Defining the Young s moduli of the primary α-Mg and eutectic as Em and Ee, respectively, the relationship Ee/Em =
1.73 is obtained. Generally, the reliability of measured (ab-solute) values obtained by nano-indentation testing is insuf-ficient. However, comparing relative values is a well-estab-lished test method16). Therefore, in this study, we considered
the relative value of the Young s modulus, defined by the ra-tio Ee/Em.
3.2 Yield behavior at room temperature
From the hardness test results shown in section 3.1, the stress–strain curve of the Mg–La–Zr alloy is schematically depicted in Fig. 4. The stress–strain curve of the alloy is lo-cated between those of the primary α-Mg and eutectic, as shown by the broken line in the figure. In this study, it is as-sumed that the strain in the tensile direction of each phase is equal to the yield stress. Therefore, the influence on the yield behavior of the eutectic is investigated based on the
Fig. 2 Micro-Vickers hardness values of α-Mg and eutectic phases.
Fig. 3 Values of Young s Modulus of α-Mg and eutectic estimated from hardness tests.
[image:2.595.137.462.70.317.2] [image:2.595.321.533.357.524.2] [image:2.595.318.534.571.738.2]tionship between Fig. 4 and eq. (1).
In addition to providing composite reinforcement17), the
eutectic obstructs dislocation movement by covering the sur-face of primary α-Mg, thereby strengthening the α-Mg phase. This is referred to as strengthening by grain boundary covering18). For the yield stress of σy
(m), the following
eq. (2) is derived using the crystal grain size d and the grain boundary covering ratio ξ of the hard phase:
σy(m) =σo+K (re−rm)ξ+rmd−1/2. (2)
Here, ξ is the ratio of the length over which the eutectic covers the primary α-Mg crystal to the peripheral length of the α-Mg crystal. σo and K are constants, and r is the slip
re-sistance. If re is the slip resistance of the primary α-Mg/
eu-tectic boundaries and rm is the slip resistance of the primary
α-Mg/α-Mg boundaries, re and rm are respectively
ex-pressed as follows:
re={Gb/(1−ν)π}τe, rm={Gb/(1−ν)π}τm (3)
where G is the rigidity ratio of Mg, ν is the Poisson s ratio of Mg, and τe and τm are the theoretical values of the shear
stresses required to initiate slippages at the α-Mg/eutectic and α-Mg/α-Mg boundaries, respectively. If re/rm is
re-garded as the ratio of the yield stresses of primary α-Mg to the eutectic, it becomes re/rm ≈ 3, as shown in section 3.1.
The slope of the straight line representing the relationship between d −1/2 and σy
(m) is K(rm)1/2 2ξ+1. Therefore, if d
is constant, σy(m) increases with increasing ξ. When ξ = 0, σy(m) =σy(m), and eq. (2) expresses the Hall–Petch
relation-ering. By assuming that the yield stress σy(m) is reached at
strain ε, the influence of the composite reinforcement with this state as a reference is considered. Then, eq. (1) becomes
σy =σe f+σy(m)(1−f), (4)
and each strengthening mechanism adds to the calculated yield stress σy. That is, σy can be estimated if f and σy(m)
are found. The increases in yield stress by grain boundary covering and composite reinforcement are represented by
∆σy(m){=σy(m) −σy(m)} and ΔσC, respectively. The total
yield stress increase is Δσy = Δσy(m) + Δσc. Thus, the yield
stress of the Mg–La–Zr alloy obtained by tensile testing in-cludes the effects of both grain boundary covering and com-posite reinforcement.
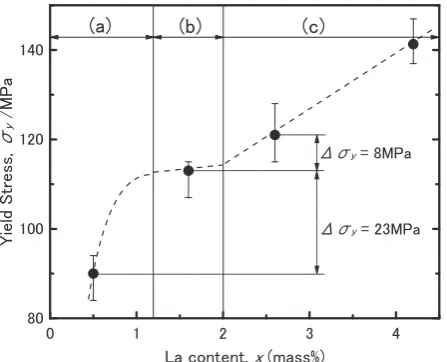
Figure 6 depicts the stress–strain curves at room tempera-ture of some Mg–La–Zr alloys. In the curves shown, the yield points are clear in all cases except the 4.2 La sample. The 0.5 La curve is obtained from this experiment, while the others are quoted from Ref. 19). Figure 7 shows the relation-ship between the La content and yield stress. For 4.2 La, the offset 0.2% proof stress value is plotted. For alloys contain-ing La, the crystal grain size is uniform at approximately 20 μm, permitting investigation of the yield behavior as af-fected by the eutectic phase. However, the average grain size of the 0 La alloy reaches 47 μm,9), and the influence of grain
size on yield stress cannot be ignored. Therefore, this data point was excluded. In Fig. 7, the differences in the yield stress between subsequent pairs of alloys are of different or-ders: for example, Δσy = 23 MPa between 0.5 La and 1.6 La,
Fig. 4 Diagram describing the composite-strengthening effect for Mg-La-Zr alloys.
[image:3.595.56.281.587.761.2] [image:3.595.314.538.590.762.2]but Δσy = 8 MPa between 1.6 La and 2.6 La. Because the
difference in the La content is approximately 1% between each composition, Δσy differs greatly over the composition
[image:4.595.62.278.69.228.2]range of La.
Figure 8 shows the relationships between La contents x (mass%) and grain boundary coverage ξ (%), and between La contents and eutectic volume fraction f (%). The eutectic volume fraction is calculated from the eutectic area fractions of a plurality of polished surfaces20). The solid line in the
figure is based on the regression curve. The relation between
x and ξ is ξ = 87.8 − 87.6(0.145)x, and the relationship
be-tween x and f is expressed as f = 5.08x. As shown in Fig. 8, an increase in the value of ξ becomes small after about 1.6La. For example, for samples containing 1.6La and 2.6La, the value of ξ is 82 and 86%, respectively. Because ξ
does not change significantly, it can be determined from eq. (2) that between these compositions, σy(m) ≈ 0.
Generally, for composite materials containing unidirectional continuous-fibers, strengthening effects do not appear when
f < 10%, this is because of the fact that the effects of
com-posite reinforcement can be offset by stress concentration21).
For Mg–La–Zr, stress concentration also occurs because of differences in the elastic coefficients of the primary α-Mg and eutectic. Therefore, assuming that the same phenome-non occurs, it is estimated that for La contents up to 2.0% with f = 10%, Δσc ≪ Δσy(m). Thus, in the regime between 0
and 2.0 La, Δσy ≈ Δσy(m). However, from Fig. 8, the grain
boundary coverage ξ reaches 80% at 1.2La and an increase in the value of ξ becomes very small above 1.2La. Therefore, it can be considered Δσy(m) ≈ 0 beyond 1.2La.
Lanthanum contents between 1.2 and 2.0% represent a tran-sitional regime in that contributing strengthening mechanism changes from strengthening by the grain boundary coverage to composite strengthening, and it is estimated that Δσy ≈ 0.
For alloys containing more than 2.0La, the influence of the composite reinforcement becomes dominant, and Δσc ≫
Δσy(m). Considering these behaviors and based on eqs. (1)
and (2), the changes in yield stress with La content are de-picted by the dashed line in Fig. 7. From this figure, it is considered that an increase in yield stress (Δσy ≈ Δσy(m) =
23 MPa) between 0.5La and 1.6La is mainly due to the strengthening by grain boundary coverage and an increase (Δσy ≈ Δσc = 8 MPa) between 1.6 La and 2.6La is due to the
composite strengthening mechanism. As described above, in the Mg–La–Zr alloy, the strengthening by the grain bound-ary coverage can be attained by small addition of La approx-imately 1%, and the yield stress is remarkably increased. For 4.2La, the effect of composite reinforcement is significant.
As shown in Fig. 6, at 0.5La, 1.6La and 2.6La, stress re-duction and stagnation are observed immediately after yield. This might be due to the elastic energy increase, caused by the strengthening mechanism by the grain boundary cover-age, being released by the slippage (yield) of the primary
α-Mg crystal and eutectic and then converted into plastic work. However, further consideration is necessary on this point.
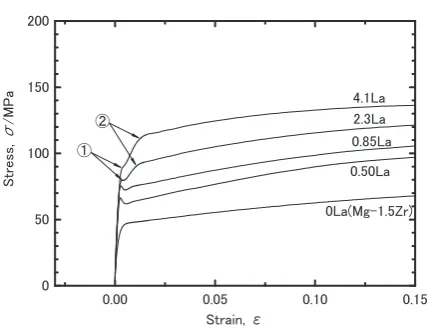
3.3 Yield behavior at 150 C
Figure 9 shows the stress–strain curves of Mg–La–Zr al-loys at 150 C. At 2.3 La and 4.1 La, two yield points are ob-served, as indicated by arrows ① and ② in the figure. From Fig. 5, the stress of ① and ② correspond to σy and eutectic
yield, respectively. The presence of yield ②, which indicates
Fig. 7 Diagram showing values of yield stress and the contribut-ing-strengthening mechanism with respect to lanthanum content. Range: (a) strengthening by grain boundary coverage; (b) strengthening both by grain boundary coverage and composite-strengthening; and (c) composite-strengthening.
Fig. 8 Change in values of the length fraction of grain boundary coverage by eutectic and volume fraction of eutectic with lanthanum content. Fig. 6 Example of engineering stress-strain curves at room temperature
[image:4.595.321.534.71.217.2] [image:4.595.58.282.285.466.2]that the eutectic shares some of the load, suggests the com-posite strengthening. However, in Fig. 9, only one yield point is observed for the stress–strain curves of 0.5La and 0.85La. Therefore, they probably yielded when the load stress σ reached σy(m). The yield condition at this point is σ=σy =σy(m). The sharp decrease in yield point is
at-tributed to the relief of the elastic energy increase induced by the covered grain boundary strengthening during yield, as occurs at room temperature.
As can be seen from Fig. 8, the values of ξ for 2.3La and 4.1La are nearly equal. Therefore, from eq. (2), the values of
σy(m) for 2.3La and 4.1La are considered equal. As shown in
Fig. 9, the stress σy at point ① is 80 MPa for 2.3La and
89 MPa for 4.1La. Furthermore, assuming that the relation-ship Ee/Em = 1.73 holds at 150 C, the following equation:
σy =σy(m){1+0.73 f} (5)
is obtained from eq. (4). Therefore, if σy(m) is known, σy
can be estimated from eq. (5) and compared with the actual experimental values shown above. The value of ξ for 0.85La alloy is 70%, which is slightly lower than that of 2.3La and 4.1La. However, as mentioned above, the influence of com-posite strengthening can be neglected for 0.85La. Therefore, the upper yield stress (75 MPa) of 0.85 La is substituted for
σy(m) in eq. (5), and the σy of 2.3 La and 4.1 La are
ob-tained as 80 and 87 MPa, respectively. Both are in good agreement with the above experimental values. From the above, the yield behaviors of Mg–La–Zr alloys can be pre-dicted by eq. (4). Yield begins when the stress borne by pri-mary α-Mg reaches the yield stress σy(m).
The active slip systems of Mg increase at 150 C. Therefore, when the load stress σ exceeds σy (①), slip de-formation in primary α-Mg begins first with simultaneous plastic relaxation. Therefore, the gradient of the stress–strain curve also changes at this point. When the composite rein-forcement is active, slip deformation in the primary α-Mg is significantly restrained by the eutectic. However, if the bond between primary α-Mg and eutectic is strong, yield is sup-pressed by the increase in active slip systems. Therefore, through the elastically deforming eutectic, slip further pro-gresses independently in each primary α-Mg grain. In this case, as the plastic strain increases, dislocations accumulate
As described above, for Mg–La–Zr alloys reinforced by the eutectic, the plastic deformation of the primary α-Mg oc-curs before yield begins in the eutectic region. Because of this, caution is required when analyzing the initial plastic deformation behavior at elevated temperatures.
4. Conclusion
In this study, we investigated the contributing effects of the eutectic in Mg–La–Zr alloys on the yielding behaviors based on the microstructure and mechanical properties, and obtained the following conclusions.
(1) At room temperature, the eutectic yield stress is ap-proximately three times greater than that of the primary
α-Mg. In addition, for the Young s moduli Em and Ee of the
primary α-Mg and eutectic, respectively, the relationship Ee/ Em = 1.73 is obtained.
(2) The yield stress of the Mg–La–Zr alloy is increased by strengthening by grain boundary covering and by composite reinforcement. Each strengthening mechanism requires sep-arate analysis; the former is dependent on the grain bound-ary coverage by the eutectic, while the latter is dependent on the eutectic volume fraction.
(3) For La contents up to 1.2%, strengthening mechanism by grain boundary covering dominates, while for La con-tents above 2.0%, the yield stress increases by the composite strengthening mechanism. However, the range between 1.2 to 2.0 La represents a transition region from the strengthen-ing by grain boundary coverstrengthen-ing to composite strengthenstrengthen-ing mechanism, and the increase in yield stress is stagnant in this range.
(4) The yield behaviors of Mg–La–Zr alloys at 150 C generally follow the equation σy =σe f+σy(m)(1−f).
Yield is initiated when the stress occurring in the primary
α-Mg reaches the yield stress σy(m). In addition, at 150 C,
the active slip systems are increased compared to those at room temperature. Therefore, plastic deformation of the pri-mary α-Mg progresses while the eutectic deforms elasti-cally. Therefore, in the stress–strain curve at elevated tem-perature, two yield points, one from the primary crystal
α-Mg and the other from the eutectic, are observed separately.
Acknowledgments
The partial financial support provided by the Light Metal Educational Foundation, Inc. is gratefully acknowledged.
[image:5.595.61.279.63.227.2]REFERENCES
1) E. F.Emley: Principles of Magnesium Technology, (Pergamon Press, 1966) pp. 264–268.
2) Y. Negishi, T. Nishimura, S. Iwasawa, S. Kamado, Y. Kojima and R. Ninomiya: JJILM 44 (1994) 555–561.
3) Y. Chino, M. Kado and M. Mabuchi: Mater. Sci. Eng. A 494 (2008) 343–349.
4) X.N. Gu, S.S. Li, X.M. Li and X.M. Fan: Front. Mater. Sci. 8 (2014) 200–218.
5) T.E. Leontis: Metall. Trans. 185 (1949) 968–983.
6) A.A. Nayeb-Hashemi and J.B. Clark:Phase Diagrams of Binary Magnesium Alloys, (ASM International, Ohio, 1988) p. 178.
7) S.M. Zhu, M.A. Gibson, M.A. Easton and J.F. Nie: Scr. Mater. 63 (2010) 698–703.
8) C.S. Roberts: Magnesium and Its Alloys, (John Wiley &Sons, 1960) pp. 138–139.
9) J. Tachibanaki, Y. Tamura, H. Soda and A. McLean: Journal of JSTP 56 (2015-1) 60–65.
10) J. Tachibanaki, Y. Tamura, H. Soda and A. McLean: Journal of JSTP
57 (2016-2) 140–145.
11) B. Zhang, A.V. Nagasekhar, X. Tao, Y. Ouyang, C.H. Caceres and M. Easton: Mater. Sci. Eng. A 599 (2014) 204–211.
12) K. Hattori: J. JSPE 79 (2013) 1185–1188.
13) S. Ara, O. Kuwazuru, K. Fukui, Y. Hangai, T. Utsunomiya, N.Yoshikawa and S. Kitahara: The Proceedings of the 61st National Congress for Theoretical and Applied Mechanics (2012) OS-15-11. 14) D. Tabor: The Hardness of Metals, (Clarendon Press, Oxford, 2000) p.
98.
15) D. Tabor: Proc. R. Soc. Lond. A 192 (1948) 247–274.
16) K. Miyahara: Journal of JSPE 79 (2013) 1189–1191.
17) G.E. Dieter and D. Bacon: Mechanical Metallurgy, (McGraw-Hill Book Co., 1989) p. 181.
18) S. Ueda and M. Zama: J. Jpn. Inst. Metals 26 (1962) 348–352.
19) Y. Tamura, S. Kawamoto, H. Soda and A. McLean: Mater. Trans. 52 (2011) 1777–1786.
20) R.T. DeHoff and F.N. Rhines: Quantitative Microscopy, Japanese translation by: K. Makishima, Y. Shinohara and T. Komori: Keiryou
keitai gaku, (Uchida Rokakuho Publishing Co., Ltd, 1983) p.54. 21) S. Simamura and H. Miyairi: Fukugouzairyou, (Jikkyo Shuppan Co.,