Original article
Novel methodology to discern
predictors of remission and patterns of
disease activity over time using
rheumatoid arthritis clinical trials data
RA-MAP Consortium
To cite: ra-MaP consortium. novel methodology to discern predictors of remission and patterns of disease activity over time using rheumatoid arthritis clinical trials data. RMD Open 2018;4:e000721. doi:10.1136/ rmdopen-2018-000721
►Prepublication history and additional material for this paper are available online. to view these files, please visit the journal online (http:// dx. doi. org/ 10. 1136/ rmdopen- 2018- 000721).
received 17 May 2018 revised 3 July 2018 accepted 6 July 2018
Correspondence to Dr Brian D M tom;
brian. tom@ mrc- bsu. cam. ac. uk
Professor Deborah Symmons; deborah. symmons@ manchester. ac. uk
© author(s) (or their employer(s)) 2018. re-use permitted under cc BY. Published by BMJ.
Key messages
What is already known about this subject?
► clinical remission is achieved in only a minority of
patients with rheumatoid arthritis and sustained drug-free remission remains rare. additionally, re-sponse to treatment varies in rheumatoid arthritis.
What does this study add?
► through industry-academic collaboration, individual
patient-level data on 3290 patients from the non-bi-ological arms of 18 trials were collated and resulted in the identification of predictors of remission and longitudinal disease activity patterns.
► Differential effects of physical/functional and mental
well-being on 6-month Disease activity Score 28 re-mission were seen between methotrexate-naïve pa-tients with early disease and those with established disease and prior methotrexate exposure at entry.
► through novel latent class methodology, three
lon-gitudinal patterns of disease activity were discerned in both the baseline methotrexate-naïve and metho-trexate-exposed rheumatoid arthritis patient groups.
How might this impact on clinical practice?
► latent class methodology allows both prediction of
trajectory membership and future disease course using outcome and covariate information, and can inform trial selection and patient management. AbstrAct
Objectives to identify predictors of remission and disease activity patterns in patients with rheumatoid arthritis (ra) using individual participant data (iPD) from clinical trials.
Methods Phase ii and iii clinical trials completed between 2002 and 2012 were identified by systematic literature review and contact with UK market authorisation holders.
anonymised baseline and follow-up iPD from
non-biological arms were amalgamated. Multiple imputation
was used to handle missing outcome and covariate information. random effects logistic regression was used to identify predictors of remission, measured by the Disease activity Score 28 (DaS28) at 6 months. novel latent class mixed models characterised DaS28 over time.
Results iPD of 3290 participants from 18 trials were included. Of these participants, 92% received methotrexate (MtX). remission rates were estimated at 8.4%(95%ci 7.4%to9.5%) overall, 17%(95%ci 14.8%to19.4%) for MtX-naïve patients with early ra and 3.2% (95% ci 2.4% to 4.3%) for those with prior MtX exposure at entry. in prior MtX-exposed patients, lower baseline DaS28 and MtX reinitiation were associated with remission. in MtX-naïve patients, being young, white, male, with better functional and mental health, lower baseline DaS28 and receiving concomitant glucocorticoids were associated with remission. three DaS28 trajectory subpopulations were identified in MtX-naïve and MtX-exposed patients. a number of variables were associated with subpopulation membership and DaS28 levels within subpopulations.
Conclusions Predictors of remission differed between MtX-naïve and prior MtX-exposed patients at entry. latent class mixed models supported differential non-biological therapy response, with three distinct trajectories observed in both MtX-naïve and MtX-exposed patients. Findings should be useful when designing future ra trials and interpreting results of biomarker studies.
BaCkgROund
Rheumatoid arthritis (RA), an inflammatory disease of synovial joints, leads to functional disability and reduced quality of life. Currently, there is no cure but many studies confirm the benefit of early and intensive treatment on long-term outcome.1 2 Nonetheless, clinical
remission is achieved in only a minority of patients3 4 and sustained drug-free remission
remains rare.5 6
Response to treatment varies in RA. Clinical trials report average disease activity change, but within treatment arms there is hetero-geneity; some patients entering clinical remission and some failing to respond. Back-ground disease activity also fluctuates, with some patients demonstrating an initial short-term improvement then either relapsing or plateauing with still relatively active disease irrespective of treatment. Moreover, conventional synthetic disease-modifying
on May 7, 2020 by guest. Protected by copyright.
http://rmdopen.bmj.com/
antirheumatic drugs (csDMARD) have slow onset of action. Given that prolonged periods of uncontrolled disease activity lead to joint damage and disability, a major unmet need is to identify patient-level predictors of response in order to identify patients with differing patterns of response over time (ie, types of patients with a greater or lesser chance of responding). Such infor-mation could guide treatment choices, saving both time and money in achieving sustained disease control; and improve the efficiency of clinical trials.
The Rheumatoid Arthritis (RA-MAP) Consortium is a UK industry-academic partnership funded jointly by the Medical Research Council and the Association of the British Pharmaceutical Industry. RA-MAP’s goal is to investigate clinical and biological predictors of disease outcome in RA, by bringing together experts in basic, clinical, therapeutic development and biostatistical research.7 One RA-MAP work stream investigated
clin-ical predictors of remission and response by collation of individual participant data (IPD) from the non-biolog-ical arms of randomised controlled clinnon-biolog-ical trials (RCT). The aims were to identify predictors of response and to identify disease trajectory subpopulations; and then use the findings to inform study design and analysis of future studies.
MeTHOds
Identification of relevant studies and study selection
Potential studies were identified by systematic literature review (final search: 13 March 2012) from MEDLINE, EMBASE, PubMed, Ovid, Web of Science, UK Clinical Research Network Portfolio Database (http:// public. ukcrn. org. uk/), ClinicalTrials. gov (https:// clinicaltrials. gov) and the National Research Register. Searches combined MeSH terms for RA, study type (eg, ‘randomised controlled trial’) and biological and non-biological DMARDs. Additionally, chief investigators of known academic-led clinical trials completed between 2002 and 2012, involving UK patients, were contacted. Current UK market authorisation holders for non-biological and biological DMARDs were also sent a survey via their RA-MAP representative to identify addi-tional trials and seek information on availability of IPD from clinical trials coordinated in the UK or which enrolled UK subjects.
Assessment of trials’ eligibility for inclusion was performed independently by the study coordinator and principal investigator (DS). Lack of consensus was resolved through discussion with the trial’s chief investiga-tor(s), industry sponsor or referral to study publications. A second literature search was conducted to identify known predictors of remission in RA. This informed the request for baseline data items.
Owners of suitable trial data sets were approached via the RA-MAP representative for access to data on requested variables for all (or a random 80% of) participants in non-biologic arm(s) of these trials. The inclusion criteria, trials obtained and data requested are detailed in online
supplementary material. Eligibility of data sets relied on the original informed consent allowing data sharing.
data collection, management and harmonisation
Deidentified data were transferred to the coordinating centre, and further anonymisation added through gener-ation of new unique study identifiers.
Data received were checked for internal consistency, with queries referred back to data owner/supplier. Data were harmonised across trials (ie, given single variable name, standardisation of unit measurement, similar coding of variables when possible) to a standard format for incorporation into a central database. The end product was a pooled database of IPD from trials received. Although a common set of items was requested, some trials, by design, had not collected all items, or when collected, differed in form/construct or level of detail.
derived disease activity measure and remission definition
Where possible Disease Activity Score 28 (DAS28) was derived using the four individual components of eryth-rocyte sedimentation rate (mm/hour), patient global assessment of disease activity (0–100mm visual analogue scale (VAS)) and 28-tender and 28-swollen joint counts.8
If patient global assessment was not supplied as a VAS, the three-component DAS28 was calculated.8 If direct
deriva-tion of DAS28 was not possible then supplied DAS28 was used or the transformation of van Gestel et al9 applied
to convert original DAS10 11 to DAS28. Clinical remission
was defined as DAS28<2.6.12
sample size evaluation
Initial sample size calculation considered a remis-sion model with 25 significant effects. For simplicity, it assumed that these effects arose from continuous varia-bles that remained statistically significant when dichoto-mised. A clinically worthwhile detectable difference in remission rates between two groups, formed by median dichotomisation of any predictor, was taken as 4% (eg, 6% remission rate for group below median vs 10% for group above median; giving an overall remission rate of 8%). Assuming a significance level of 0.2% (accounting for multiple testing), a total sample size of 4218 or 2942 is calculated for 95% or 80% power, respectively.
The above scenario was conservative because (1) fewer significant effects could be expected; (2) dichotomisa-tion results in efficiency losses; (3) a 4% difference was considered small; and (4) strict significance level of 0.2% was chosen. It was anticipated that sample sizes above 2500 would be sufficient to achieve the work stream’s aims.
statistical methods
The main analyses were based on coprimary outcomes of clinical remission at 6 months (within a 22–26-week window) and DAS28 measured longitudinally. One trial, with 12-week follow-up, was excluded from analyses of remission at 6 months but included in analyses of DAS28 over time. Clinical remission was estimated overall, and
on May 7, 2020 by guest. Protected by copyright.
http://rmdopen.bmj.com/
separately for methotrexate-naïve (MTX-naïve) entry subjects and those with prior MTX exposure (MTX-ex-posed). The MTX-exposed group consisted of those on background MTX at trial entry and those who had discontinued MTX.
To identify predictors of remission, (multilevel) random effects logistic regression models (with trial-level random effects) stratified by baseline MTX exposure were considered. If heterogeneity across trials was insub-stantial then trial-level random effects were removed. The base model focused on known predictors of remis-sion and potential confounders with limited missing information.13–15 It considered the effect of age, sex,
ethnicity, disease duration, DAS28, rheumatoid factor (RF) status and RA medication (both prior exposure and as part of study treatment protocol) at baseline. Baseline DAS28 and history of RA medication were also included to adjust for differences in the trial populations due to differing inclusion criteria. Screening models considered separate effects of other potential baseline predictors introduced into the base model. Multivariate models were then built using variables identified as important at screen and forward selection.
Longitudinal latent class mixed models, stratified by MTX exposure at baseline, were used to (1) characterise DAS28 over time (restricted to 1-year follow-up), (2) adjust for potential predictors, (3) incorporate within-pa-tient correlation, and (4) identify cluster trajectories of clinically important subpopulations.16 Fixed and random
patient-level intercepts, linear and quadratic effects were considered for linear mixed models fitted within latent classes. These random effects were nested within trial. Trial-level random effects were considered, but removed when found inconsequential. (Relative) entropy was calculated to assess the ability of each model to classify individuals into latent classes.17 Higher values of entropy
indicate better classification of individuals.
Sporadically and systematically missing baseline covariate and missing outcome information at attended
visits were imputed using multivariate imputation by chained equations,18 19 under the missing at random
assumption. The hierarchical/multilevel structure (ie, visits within patient, patients within trial) was respected where possible. Twenty imputed data sets were created, analysed and results pooled using Rubin’s rules.20
All statistical analyses were performed in R statistical software.21 R packages lme4,22mice23 and lcmm24 were used
for the various analyses.
ResulTs
systematic search and inventory of trials survey
We identified 63 trials to include in the inventory (online supplementary table 1). Sixty trials were industry spon-sored (54 from RA-MAP partners) and three academic (from RA-MAP partners). Partial or complete informa-tion from study sponsors or publicly available sources was collated for 54/63 trials. There were 8778 patients
in non-biological arms of these 54 trials with estimated 6-month remission rate of 8.2%. This estimate informed study sample size (see the Methods section).
Trials received
Patient-level data from non-biological arms of 19 trials were provided by six industry and two academic RA-MAP partners (see online supplementary table 1). One trial was excluded as it recruited patients with early inflam-matory polyarthritis. Patients in the included trials (all started before 2010) met the 1987 American College of Rheumatology RA classification criteria.25 Data for
3290 participants from the combined non-biological arms of these 18 trials were obtained. Patient numbers from these trials ranged from 50 to 467. Non-biological assigned treatments included (1) placebo, (2) MTX or other csDMARD monotherapy, or (3) MTX in combina-tion with another csDMARD and/or with glucocorticoid. Placebo-treated patients received either (1) placebo in addition to background RA medication; (2) placebo alone (with RA medication discontinued prior to trial start); or (3) placebo alone (with no prior RA medica-tion; ie, RA medication naïve). Further information on planned duration of RCT phase, inadequate response to csDMARDs, biological intervention, and primary and secondary efficacy outcomes related to disease activity are reported in online supplementary table 1. No data on patients treated in the biological arms of these trials were requested or received.
Patient characteristics
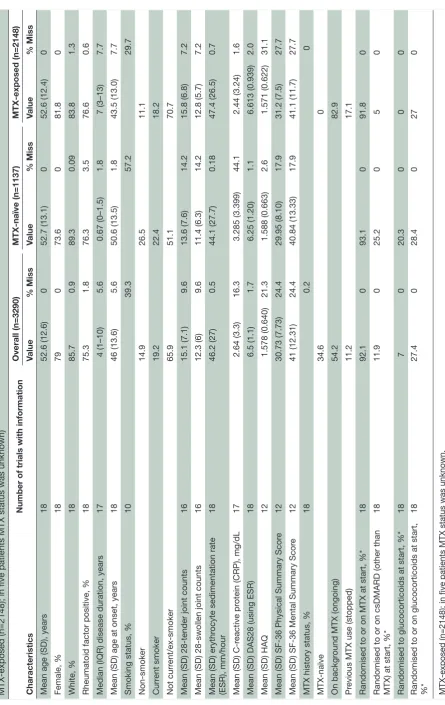
The baseline demographic and disease characteristics of included patients are summarised in table 1. Only three trials provided information on anti-citrullinated protein antibody status. The mean baseline DAS28 (with SD) was 6.5(1.1).
Fifty-four per cent of patients were on background MTX at start, 35% were MTX-naïve and 11% had prior MTX exposure (MTX discontinued). Ninety-two per cent of participants were either randomised to MTX or were on background MTX that continued. Twelve per cent was randomised to or continued other csDMARDs. The corresponding percentage for glucocorticoids was 27%. The majority of MTX-naïve patients at entry (93%) were randomised to MTX. Fifty-two per cent of those who discontinued MTX were randomised to MTX reini-tiation. A majority of them were viewed as having already demonstrated lack of adequate MTX response.
The 1137 patients who were MTX-naïve at trial entry had substantially shorter median symptom duration than the 2148 patients with prior MTX exposure (8 months vs 7 years, p<0.0001); confirming the fact that the former corresponded to those with early RA.
Clinical remission at 6 months
Overall 6-month remission rate was estimated at 9.6%(95%CI 8.4%to10.9%) based on 2275 patients for whom 6-month remission could be defined from
on May 7, 2020 by guest. Protected by copyright.
http://rmdopen.bmj.com/
Table 1
Baseline characteristics of patients in 18 trials, overall
(n=3290) and stratified by methotr
exate (MTX) status prior to randomisation (ie, MTX-naive (n=1137) and
MTX-exposed (n=2148); in five patients MTX status was unknown) Characteristics
Number of trials with information
Overall (n=3290) MTX-naïve (n=1137) MTX-exposed (n=2148) Value % Miss Value % Miss Value % Miss
Mean age (SD), years
18 52.6 (12.6) 0 52.7 (13.1) 0 52.6 (12.4) 0 Female, % 18 79 0 73.6 0 81.8 0 White, % 18 85.7 0.9 89.3 0.09 83.8 1.3
Rheumatoid factor positive, %
18 75.3 1.8 76.3 3.5 76.6 0.6
Median (IQR) disease duration, years
17 4 (1–10) 5.6 0.67 (0–1.5) 1.8 7 (3–13) 7.7
Mean (SD) age at onset, years
18 46 (13.6) 5.6 50.6 (13.5) 1.8 43.5 (13.0) 7.7
Smoking status, %
10 39.3 57.2 29.7 Non-smoker 14.9 26.5 11.1 Curr ent smoker 19.2 22.4 18.2 Not curr ent/ex-smoker 65.9 51.1 70.7
Mean (SD) 28-tender joint counts
16 15.1 (7.1) 9.6 13.6 (7.6) 14.2 15.8 (6.8) 7.2
Mean (SD) 28-swollen joint counts
16 12.3 (6) 9.6 11.4 (6.3) 14.2 12.8 (5.7) 7.2
Mean (SD) erythr
ocyte sedimentation rate
(ESR), mm/hour 18 46.2 (27) 0.5 44.1 (27.7) 0.18 47.4 (26.5) 0.7
Mean (SD) C-r
eactive pr
otein (CRP), mg/dL
17 2.64 (3.3) 16.3 3.285 (3.399) 44.1 2.44 (3.24) 1.6
Mean (SD) DAS28 (using ESR)
18 6.5 (1.1) 1.7 6.25 (1.20) 1.1 6.613 (0.939) 2.0
Mean (SD) HAQ
12 1.578 (0.640) 21.3 1.588 (0.663) 2.6 1.571 (0.622) 31.1
Mean (SD) SF-36 Physical Summary Scor
e 12 30.73 (7.73) 24.4 29.95 (8.10) 17.9 31.2 (7.5) 27.7
Mean (SD) SF-36 Mental Summary Scor
e 12 41 (12.31) 24.4 40.84 (13.33) 17.9 41.1 (11.7) 27.7
MTX history status, %
18 0.2 0 MTX-naïve 34.6 0 On backgr
ound MTX (ongoing)
54.2
82.9
Pr
evious MTX use (stopped)
11.2
17.1
Randomised to or on MTX at start, %*
18 92.1 0 93.1 0 91.8 0
Randomised to or on csDMARD (other than MTX) at start, %*
18 11.9 0 25.2 0 5 0
Randomised to glucocorticoids at start, %*
18 7 0 20.3 0 0 0
Randomised to or on glucocorticoids at start, %*
18 27.4 0 28.4 0 27 0
MTX-exposed (n=2148); in five patients MTX status was unknown. *Not mutually exclusive categories as patients can be randomised to or r
eceive dual therapy
.
csDMARD, conventional synthetic disease-modifying antirheumatic drug; DAS28, Disease Activity Scor
e 28; HAQ, Health Assessment Questionnair
e.
on May 7, 2020 by guest. Protected by copyright.
http://rmdopen.bmj.com/
observed data. After multiple imputation, a 6-month remission rate of 8.4%(95%CI 7.4%to9.5%) was esti-mated based on 2766 patients who had attended visits within the 22–26week window period. For MTX-naïve entry participants, observed 6-month remission rate was 17.7%(95%CI 15.4%to20.2%) and estimated remission rate after imputation was 17%(95%CI 14.8%to19.4%) based on 1048 patients. For MTX-exposed patients, corresponding estimates were 3.5%(95%CI 2.6%to4.6%) and 3.2%(95%CI 2.4%to4.3%) based on observed data and imputed data from 1718 patients. The adjusted OR of achieving 6-month remission for MTX-exposed versus MTX-naïve patients was 0.26(95%CI 0.17to0.40). Adjust-ments were made for variables included in the base logistic regression model.
Predictors of clinical remission at 6 months
MtX-naïve at entry
The base (multilevel) random effects logistic regression model for MTX-naïve entry patients is shown in online supplementary table 1. Age, sex, ethnicity, baseline DAS28 and randomised to concomitant glucocorticoids were associated with remission. After screening, three additional variables were considered in building the model further. These were functional disability (Health Assessment Questionnaire, HAQ), SF-36 Physical and Mental Summary Scores.
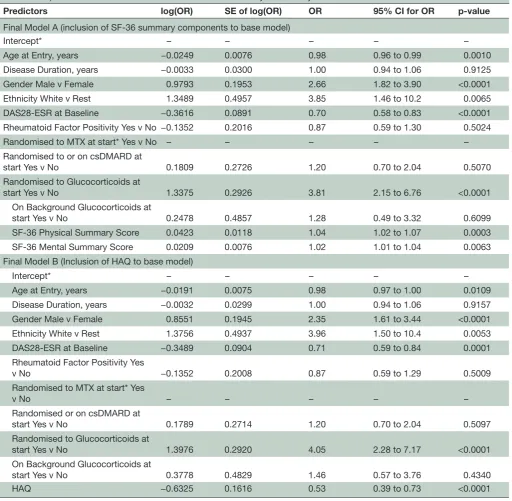
As HAQ was negatively correlated with SF-36 Physical Summary Score (Pearson correlation of −0.57), two final models (A and B; see table 2) were derived, in which either HAQ or SF-36 Physical Summary Score (but not both together), alongside the SF-36 Mental Summary Score, was considered for inclusion using forward selec-tion. In these models, remission was predicted by being white, male, younger, randomised to concomitant gluco-corticoids, having better functional/physical and mental health and lower DAS28, at baseline. Being randomised to concomitant glucocorticoids increased the odds of achieving remission by 4.0(95%CI 2.3to7.2) over not receiving glucocorticoids (model B), controlling for other variables. As most MTX-naïve entry subjects (93%) received MTX, an effect for receiving MTX during the trial could not be estimated, although it was adjusted for in the analysis.
MtX-exposed at entry
The logistic regression (dropping trial-level random effects) in MTX-exposed patients (see table 3) identi-fied lower baseline DAS28 and randomisation to MTX as being associated with achieving 6-month remission. However, patients with prior MTX exposure who were randomised to MTX reinitiation were significantly more likely (p<0.0001) to achieve remission than those contin-uing on background MTX (adjusted OR 5.2 with 95%CI 2.5 to 10.4). No evidence for functional/physical and mental health effects was found.
Characterising disease activity over 1 year of follow-up
Novel latent class mixed modelling of DAS28 suggested the clustering into three subpopulations/classes with differing trajectory profiles in both MTX-naïve and exposed baseline groups. No evidence to support inclu-sion of trial-level random effects, random slopes or random quadratic effects was found and so the linear mixed models within latent classes contained only fixed effects and random intercepts.
MtX-naïve at entry
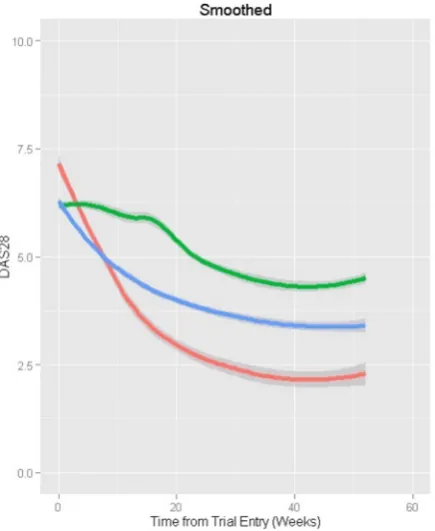
The three subpopulations identified (table 4 and figure 1; n=1137) corresponded to a fast improver group (class 1; 8% of patients) who, on average, started with higher DAS28; a moderate improver group (class 2; 31.6%) who improved at around half the rate of fast improvers; and an inadequate responder group (class 3; 60.4%) with an improvement rate only 20% of that in class 1. On average, DAS28 of a typical patient with RA would improve by 3.91 in the fast improvers, 2.02 in moderate improvers and 0.56 in inadequate responders over 1 year of follow-up from trial entry.
Higher baseline HAQ was associated with having inade-quate response. Men were more likely than women to be fast improvers compared with moderate improvers. Higher DAS28 over time in inadequate responders was associated with longer symptom duration (p=0.0136), non-white (p=0.0118) and higher HAQ over time (p<0.0001). In moderate improvers, not being randomised to glucocorti-coids (p=0.0074) and higher HAQ over time (p<0.0001) were associated with higher DAS28. In fast improvers, only higher HAQ was associated with higher DAS28 (p<0.0001). The model’s entropy was 0.758, demonstrating good classi-fication. A four-latent class model with the same variables gave lower entropy (0.711).
MtX-exposed at entry
The three subpopulations identified (table 5; figure 2; n=2148) corresponded to a fast improver group (class 1; 9.4% of patients), although not as fast as the corre-sponding MTX-naïve subpopulation; a group that showed initial improvement but then plateaued and slowly worsened (class 2; 43.4%); and a refractory group (class 3; 47.3%). On average, DAS28 of a typical patient with RA would improve by 3 in the fast improvers, 0.7 in the plateauing group and would worsen by 0.11 in those refractory over 1 year of follow-up.
The ‘plateauing’ group tended to include, on average, patients with lower baseline functional disability. Moreover, in this group, there was evidence to suggest that higher DAS28 associated with being non-white (p=0.0213). Wors-ening DAS28 was associated with worsWors-ening functional disability over time, irrespective of subpopulation. In the refractory group, continuation of background MTX or receiving other csDMARDs as an initial treatment at trial entry was, on average, associated with increased disease activity (DAS28 increase of 0.51, p=0.0032 and 0.67, p=0.0017 respectively) over time.
on May 7, 2020 by guest. Protected by copyright.
http://rmdopen.bmj.com/
Table 2 Final logistic regression model A (including SF-36 summary scores to base model) and model B (including HAQ to base model) for clinical remission at 6months for MTX-naive subjects at entry
Predictors log(OR) SE of log(OR) OR 95% CI for OR p-value
Final Model A (inclusion of SF-36 summary components to base model)
Intercept* – – – – –
Age at Entry, years −0.0249 0.0076 0.98 0.96 to 0.99 0.0010 Disease Duration, years −0.0033 0.0300 1.00 0.94 to 1.06 0.9125 Gender Male v Female 0.9793 0.1953 2.66 1.82 to 3.90 <0.0001 Ethnicity White v Rest 1.3489 0.4957 3.85 1.46 to 10.2 0.0065 DAS28-ESR at Baseline −0.3616 0.0891 0.70 0.58 to 0.83 <0.0001 Rheumatoid Factor Positivity Yes v No −0.1352 0.2016 0.87 0.59 to 1.30 0.5024
Randomised to MTX at start* Yes v No – – – – –
Randomised to or on csDMARD at
start Yes v No 0.1809 0.2726 1.20 0.70 to 2.04 0.5070
Randomised to Glucocorticoids at
start Yes v No 1.3375 0.2926 3.81 2.15 to 6.76 <0.0001
On Background Glucocorticoids at
start Yes v No 0.2478 0.4857 1.28 0.49 to 3.32 0.6099
SF-36 Physical Summary Score 0.0423 0.0118 1.04 1.02 to 1.07 0.0003 SF-36 Mental Summary Score 0.0209 0.0076 1.02 1.01 to 1.04 0.0063 Final Model B (Inclusion of HAQ to base model)
Intercept* – – – – –
Age at Entry, years −0.0191 0.0075 0.98 0.97 to 1.00 0.0109 Disease Duration, years −0.0032 0.0299 1.00 0.94 to 1.06 0.9157 Gender Male v Female 0.8551 0.1945 2.35 1.61 to 3.44 <0.0001 Ethnicity White v Rest 1.3756 0.4937 3.96 1.50 to 10.4 0.0053 DAS28-ESR at Baseline −0.3489 0.0904 0.71 0.59 to 0.84 0.0001 Rheumatoid Factor Positivity Yes
v No −0.1352 0.2008 0.87 0.59 to 1.29 0.5009
Randomised to MTX at start* Yes
v No – – – – –
Randomised or on csDMARD at
start Yes v No 0.1789 0.2714 1.20 0.70 to 2.04 0.5097
Randomised to Glucocorticoids at
start Yes v No 1.3976 0.2920 4.05 2.28 to 7.17 <0.0001 On Background Glucocorticoids at
start Yes v No 0.3778 0.4829 1.46 0.57 to 3.76 0.4340
HAQ −0.6325 0.1616 0.53 0.39 to 0.73 <0.0001
*Estimates and SE are not estimable. MTX usage during study has been adjusted for in models. Majority of MTX-naïve subjects at trial entry received MTX during study (93%).xMark as
csDMARD, conventional synthetic disease-modifying antirheumatic drug; DAS28, DiseaseActivity Score 28; ESR, erythrocyte sedimentation rate; HAQ, Health AssessmentQuestionnaire; MTX, methotrexate.
The model’s entropy was 0.609, demonstrating modest classification. A four-latent class model iden-tified an additional group (around 3.3% of patients) that showed rapid improvement over 3 months and then rebounded dramatically. Although this model had increased entropy (0.659), given the fourth group’s size and unusual pattern, the three-latent class model was preferred.
Model outputs
The models presented in tables 4 and 5 are useful for characterising disease activity over time into more homo-geneous subpopulations and for identifying predictors of subpopulation membership and disease activity level. The models are also useful for calculating and updating the probabilities of a patient belonging to each of the subpopulations given their current value of DAS28 and
on May 7, 2020 by guest. Protected by copyright.
http://rmdopen.bmj.com/
Table 3 Final logistic regression model for clinical remission at 6months for MTX-exposed subjects
Predictors log(OR) SE of log(OR) OR 95%CI for OR P values
Intercept – – – – –
Age at entry, years −0.0160 0.0124 0.98 0.96 to 1.01 0.1953 Disease duration, years −0.0105 0.0206 0.99 0.95 to 1.03 0.6109 Gender: male versus female 0.2935 0.3697 1.34 0.65 to 2.77 0.4271 Ethnicity: white versus rest −0.0511 0.4137 0.95 0.42 to 2.14 0.9017 DAS28-ESR at baseline −0.8228 0.1600 0.44 0.32 to 0.60 <0.0001 Rheumatoid factor positivity: yes versus no −0.5277 0.3214 0.59 0.31 to 1.11 0.1007 MTX use in trial
(Randomised to MTX, previous use) versus (not
receiving, previous use) 1.6499 0.8252 5.21 1.03 to 26.2 0.0456 Background MTX continued versus (not
receiving, previous use) 0.0126 0.7874 1.01 0.22 to 4.74 0.9873 Randomised to or on csDMARD at start: yes
versus no 1.1721 0.8953 3.23 0.56 to 18.7 0.1905
On background glucocorticoids at start: yes
versus no 0.1169 0.3299 1.12 0.59 to 2.15 0.7230
csDMARD, conventional synthetic disease-modifying antirheumatic drug; DAS28, DiseaseActivity Score 28; ESR, erythrocyte sedimentation rate; MTX, methotrexate.
covariates and estimated parameters from the model (including estimated random patient-level effects).24
This would be particularly useful in an adaptive trial as a new individual recruited could be assigned probabilities of belonging to each trajectory by a model that included all previously recruited individuals.
Furthermore, such models also allow subject-specific predictions of future DAS28 values for patients either given a particular trajectory subpopulation or averaged over all possible trajectory subpopulations. They would also allow population-averaged inference for particular subgroups of patients defined by the values of baseline covariates to inform, for example, national treatment guidelines for patients with RA.
dIsCussIOn
By means of a large industry-academic partnership, IPD from non-biological arms of 18 RA RCTs were amalga-mated. These data on 3290 patients allowed a more definitive investigation into clinical predictors of remis-sion, beyond a systematic literature review, through flex-ible multivariate modelling and novel subgroup analyses using latent class mixed modelling methodology.
We did not aim to do an IPD meta-analysis in order to estimate a common treatment effect across multiple trials investigating the same treatment against the same control intervention. Instead, our goal was to treat this IPD study as an observational cohort in order to more comprehensively investigate the predictors of remission on a variety of non-biological treatments and to discover clinically meaningful subpopulations of patients with RA that could inform the future recruitment of RA patient types into trials and more stratified patient management.
Although patients in RCTs are generally considered to be poorly representative of those patients seen in the general RA clinic population (having higher levels of disease activity at entry and fewer and less severe comor-bidities), they nevertheless represent a subpopulation of patients with RA with very real clinical need. Additionally, they represent a patient subpopulation in which treat-ment managetreat-ment decisions would be made based on the patients’ arthritis symptoms and signs and not compli-cated by comorbidities and the potential for interactions between the assigned treatments and the comorbidities.
We conducted separate analyses for MTX-naïve and MTX-exposed strata at trial entry, reflecting relatively early and more established disease, respectively. Unsur-prisingly, the 6-month remission rate for MTX-naïve (majority then randomised to MTX) patients was substan-tially higher (17% vs 3.5%) than for those with prior MTX exposure. Utilisation of a treat-to-target strategy, as is usual in clinical practice, may have increased the remis-sion rate in this group further.
A major unmet need is identifying which patients with RA are more or less likely to achieve remission. Our results suggest that, in MTX-naïve entry patients with relatively early disease and high disease activity, baseline factors including age, gender, ethnicity, disease activity, mental health and physical functioning may help identify those with a higher or lower chance of achieving 6-month remission. While all these factors have been previously identified,14 26 27 we have confirmed them in a very large
sample with the benefits of controlled trial conditions, not usually achievable with large observational studies. These factors should be considered stratifiers when designing future clinical trials and interpreting results of
on May 7, 2020 by guest. Protected by copyright.
http://rmdopen.bmj.com/
Table 4 Latent class mixed model results for MTX-naïve entry subjects over 1-year follow-up
Predictors log(OR) SE P values Multinomial class membership model
Class 1 (fast improver) versus class 2 (moderate improver) Intercept –2.1947 0.4901 <0.0001 Sex: male
versus female 0.8881 0.3065 0.0038 Baseline HAQ 0.3416 0.2902 0.2393 Class 3 (inadequate response) versus class 2 (moderate improver)
Intercept –1.2339 0.6461 0.0561 Sex: male
versus female 0.0128 0.2762 0.9629 Baseline HAQ 0.6174 0.2805 0.0277 Linear mixed
model Estimate SE P values Intercept
Class 1 7.788 0.9264 <0.0001 Class 2 5.6199 0.3158 <0.0001 Class 3 5.7350 0.3400 <0.0001 Disease duration, years
Class 1 –0.0083 0.0397 0.8335 Class 2 –0.0016 0.0104 0.8768 Class 3 0.0312 0.0126 0.0136 Ethnicity
White versus
rest: class 1 –0.5313 0.3882 0.1711 White versus
rest: class 2 –0.2726 0.1837 0.1379 White versus
rest: class 3 –0.4331 0.1719 0.0118 Follow-up
time in study, weeks
Class 1 –0.2051 0.0221 <0.0001 Class 2 –0.1117 0.0080 <0.0001 Class 3 –0.0420 0.0080 <0.0001 Follow-up
time squared
Class 1 0.0025 0.0004 <0.0001 Class 2 0.0014 0.0001 <0.0001 Class 3 0.0006 0.0002 <0.0001 Randomised to MTX at start
Yes versus
no: class 1 –1.2085 0.8352 0.1479 Yes versus
no: class 2 –0.1143 0.2230 0.6082 Yes versus
no: class 3
–0.1299 0.2181 0.5513
Continued
Linear mixed
model Estimate SE P values Randomised or on csDMARD at start
Yes versus
no: class 1 –0.0597 0.4436 0.8930 Yes versus
no: class 2 –0.1673 0.1304 0.1993 Yes versus
no: class 3 –0.1127 0.1303 0.3871 Randomised to glucocorticoids at start
Yes versus
no: class 1 –0.3899 0.3976 0.3267 Yes versus
no: class 2 –0.3962 0.1480 0.0074 Yes versus
no: class 3 –0.2540 0.1550 0.1013 On background glucocorticoid at start
Yes versus
no: class 1 –0.4879 0.3389 0.1500 Yes versus
no: class 2 0.2907 0.2262 0.1987 Yes versus
no: class 3 0.3468 0.2123 0.1024 HAQ (time varying)
Class 1 0.4913 0.1045 <0.0001 Class 2 0.5564 0.0698 <0.0001 Class 3 0.6114 0.1035 <0.0001 Variance components*
Variance of random
intercept 0.6308 0.0506 <0.0001 Error SD 0.7941 0.0122 <0.0001 Relative
entropy† 0.758
*Trial-levels random effects were investigated and found to be not necessary
†A relative entropy takes values between 0 and 1, with 1 indicating perfect classification
Table 4 Continued
biomarker studies. The potential role of mental health is of current interest, although mechanisms are uncertain, complex and bidirectional.26 28 29 The fact that mental
and physical/functional well-being was predictive in MTX-naïve entry patients with relatively early disease but not in the prior MTX-exposed entry patients with more established disease is of note and should be explored further as it is difficult in our study to disentangle early/ established disease from no/previous exposure to MTX. Some previous studies have shown an effect of smoking status on disease activity14 30 we could not confirm this. However, our finding could be due to the high propor-tion of systematically missing smoking data (57%). RF
on May 7, 2020 by guest. Protected by copyright.
http://rmdopen.bmj.com/
Figure 1 Mean profiles over 1 year from the observed Disease Activity Score 28 (DAS28) data for patients who were methotrexate (MTX)-naïve at trial entry, after stratifying by predicted class membership. Class 1—fast improver group (red): 8%; class 2—moderate improver group (blue): 31.6%; class3—inadequate response group (green): 60.4% (entropy: 0.758).
Table 5 Latent class mixed model results for MTX-exposed subjects over 1-year follow-up
Predictors log(OR) SE P values Multinomialclass
membershipmodel
Class 1 (fast improver) versus class 2 (plateaued)
Intercept −1.7852 0.3187 <0.0001 Baseline HAQ 0.4137 0.2073 0.0460 Class 3 (refractory) versus
class 2 (plateaued)
Intercept −0.7352 0.2987 0.0138 Baseline HAQ 0.5536 0.1648 0.0008 Linear mixed
model Estimate SE P values Intercept
Class 1 5.2433 0.6394 <0.0001 Class 2 5.7507 0.2552 <0.0001 Class 3 5.8371 0.2018 <0.0001 Ethnicity
White versus
rest: class 1 –0.1746 0.1929 0.3655 White versus
rest: class 2 –0.2380 0.1034 0.0213 White versus
rest: class 3 –0.1233 0.0931 0.1852 Follow-up time
in study, weeks
Class 1 –0.1668 0.0091 <0.0001 Class 2 –0.0863 0.0059 <0.0001 Class 3 –0.0030 0.0042 0.4697 Follow-up time
squared
Class 1 0.0021 0.0001 <0.0001 Class 2 0.0014 0.0001 <0.0001 Class 3 0.0001 0.0001 0.1708 MTX use
(Randomised MTX, previous on) versus previous on but not randomised:
class 1 1.0513 0.6129 0.0863 (Randomised
MTX, previous on) versus previous on, but not randomised: class 2
0.0186 0.2750 0.9461
Continued was not associated with remission here. Previous studies
show conflicting results.14 31 32
We identified three distinct disease activity trajecto-ries in both MTX-naïve entry and MTX-exposed strata. Although we have given trajectory classes similar names in both strata, the degree of improvement differed depending on MTX exposure history (or early vs estab-lished disease at entry through confounding). Siemons et al33 also observed three distinct trajectories from an unad-justed latent class mixed model analysis over the first year in patients with early RA.33 All their patients followed
a treat-to-target strategy and 82% belonged to a ‘fast response’ group with only 3% in a ‘poor response’ group. They found evidence for differences across groups in baseline disease activity measures, pain and SF-36 Phys-ical and Mental Health Summary Scores.33 However, they
found weaker evidence to support a role of gender in distinguishing groups. We found gender and baseline functional disability were predictors of trajectory class in the MTX-naïve group. The latter was the lone predictor of class membership for MTX-exposed patients. However, the findings of Siemons et al were based on one-way analyses of variance rather than introducing variables into their latent class model. There has been debate on whether or not the incorporation of covariates may play an important role in enumerating classes.34
A number of variables were associated with DAS28 levels within trajectory classes. In both MTX-naïve and
on May 7, 2020 by guest. Protected by copyright.
http://rmdopen.bmj.com/
[image:9.595.307.552.73.723.2]Linear mixed
model Estimate SE P values (Randomised
MTX, previous on) versus previous on, but not randomised:
class 3 0.3206 0.2381 0.1781 Background
MTX continued versus
previous on but not randomised:
class 1 0.9683 0.6140 0.1148 Background
MTX continued versus
previous on but not randomised:
class 2 0.0762 0.2430 0.7539 Background
MTX continued versus
previous on but not randomised:
class 3 0.5088 0.1729 0.0032 Randomised or
on csDMARD at start Yes versus no:
class 1 0.5336 0.6840 0.4353 Yes versus no:
class 2 –0.1657 0.3004 0.5813 Yes versus no:
class 3 0.6739 0.2151 0.0017 On
background glucocorticoids at start
Yes versus no:
class 1 –0.1578 0.1551 0.3088 Yes versus no:
class 2 0.0648 0.0843 0.4419 Yes versus no:
class 3 –0.1037 0.0788 0.1885 HAQ (time
varying)
[image:10.595.306.555.56.197.2] [image:10.595.45.287.64.721.2]Class 1 0.3958 0.0601 <0.0001 Class 2 0.3773 0.0413 <0.0001 Class 3 0.2641 0.0313 <0.0001 Table 5 Continued
Continued
Linear mixed
model Estimate SE P values Variance
components* Variance of random
intercept 0.6174 0.0269 <0.0001 Error SD 0.6902 0.0056 <0.0001 Relative
entropy† 0.609
*Trial-level random effects were investigated and found to be not necessary.
†A relative entropy takes values between 0 and 1, with 1 indicating perfect classification.
csDMARD, conventional synthetic disease-modifying
[image:10.595.313.540.384.664.2]antirheumatic drug; HAQ, HealthAssessment Questionnaire; MTX, methotrexate.
Table 5 Continued
Figure 2 Mean profiles over 1 year from the observed Disease Activity Score 28 (DAS28) data for the methotrexate (MTX)-exposed patients after stratifying by predicted class membership. Class 1—fast improver group (red): 9.4%; class 2—moderate improver group (blue): 43.4%; class 3—inadequate response group (green): 47.3% (entropy: 0.609).
MTX-exposed patients, higher HAQ was associated with higher DAS28 in all classes. Interestingly, in the refrac-tory class of MTX-exposed patients, those who continued background MTX or took other csDMARDs at trial start had higher DAS28 over time. In the class which plateaued, non-whites had higher DAS28 over time. Furthermore, non-whites had higher DAS28 within both moderate
on May 7, 2020 by guest. Protected by copyright.
http://rmdopen.bmj.com/
improver and inadequate response trajectory classes of the MTX-naïve stratum.
It may seem somewhat confusing that lower disease activity at baseline was associated with achieving clin-ical remission at 6 months in both baseline MTX-naïve and MTX-exposed groups, and yet there was a subpop-ulation of baseline MTX-naïve patients who improved rapidly but started with, on average, higher levels of disease activity at baseline than the other two subpopula-tions of MTX-naïve patients. However, when comparing two patients who differ at baseline with regard to only disease activity (with all other baseline covariates being the same), it is not surprising that the one with the lower baseline disease activity has a higher chance of attaining remission, presumably because he/she has less far to go to attain remission. By comparison, the MTX-naïve subpopulation of ‘fast improvers’ who started with the highest levels of disease activity and rapidly improved, differed from the other MTX-naïve subpopulations in terms of its gender and HAQ baseline distributions. That is, the ‘fast improvers’ had a higher proportion of men and, on average, had higher HAQ values than the other subgroups. Therefore, this ‘fast improvers’ group starts off with higher levels of disease activity and rapidly improves compared with the others primarily because it was made up of patients with a different profile of covariate values in terms of gender and HAQ. It is known that high levels of HAQ at baseline correlate positively with high levels of DAS28 at baseline and that men are more likely to achieve clinical remission at 6 months than women in the MTX-naïve subpopulation (table 2).
When interest is focused on early treatment response and its predictors, then approaches which restrict the longitudinal disease activity response to this early time period rather than the whole follow-up period may be more appropriate. Such approaches would be much more applicable to recent clinical trials in early disease in which aggressive treatment reflects the window of oppor-tunity and treat-to-target goals.
There are many advantages of combining data from multiple trials. However, one methodological challenge is data harmonisation across trials; in particular here, with regard to creating a common DAS28 variable. There is ongoing debate as to the exact equivalence of DAS28 calculated using different formulae and the validity of combining different methods of calculation in the same analysis. These issues could impact on findings, although we believe less so in characterising disease activity over time. There is also debate over the extent to which DAS28 remission cut-off overestimates remission, as defined by absence of residual inflammatory disease activity.35
However, DAS28 remission remains a widely used and aspirational target in clinical practice and trials, and we do not believe this invalidates our findings.
Even though our analyses were done using relatively large sample sizes, there is still the need to validate the findings before these results/models could be used to inform clinical practice or trial selection. There is a
potential for our models to be overoptimistic due to the model fitting process and multiple testing. In addition, models which incorporate routinely collected biomarkers may have more clinical utility.
The existence of differing trajectories supports a strat-ified medicine approach and suggests the potential for tailoring treatments to distinct patient subpopulations. Moreover, trajectories and predictors of response may differ by drug class. For example, these latent class mixed models would allow us, using the disease activity measure at screening (or past disease activity measures) and base-line covariate information, to estimate the likely trajec-tory pattern an MTX-naïve patient with high disease activity would take if they were to enter a trial and be randomised to a non-biological arm. If it was important, in this trial, to select only patients who had a high proba-bility of responding to treatment, then our models could identify those patients who were least likely to respond (ie, the inadequate responders) to the control treat-ment and exclude them from the trial. These types of models could also be used in clinical practice (when vali-dated), for example, to assign a probability of response to different choices or combinations of csDMARDs by an MTX-naïve patient with active disease (assuming that the clinician had access to their past disease activity values and covariate information). The prediction of trajec-tory class or the likely response to a change in treatment could be refined at follow-up visits using current disease activity values.
The entropies of our models, for both MTX-naïve and MTX-exposed strata, show room for improvement in classification accuracy. We anticipate that the addition of novel immune biomarkers, being investigated by the RA-MAP Consortium through their inception cohort study, will lead to predictor models that are clinically informative when choosing treatments for patients with RA.
acknowledgements the research was supported by the niHr newcastle Biomedical research centre.
Collaborators See ra-MaP consortium Membership in online supplementary material 1.
Contributors the ra-MaP contributing authors have (1) substantially
contributed to the conception or design of the work; or the acquisition, analysis or interpretation of data for the work; and have been involved in the (2) drafting the work or revising it critically for important intellectual content; and have given (3) final approval of the version to be published; and have (4) agreed to be accountable for all aspects of the work in ensuring that questions related to the accuracy or integrity of any part of the work are appropriately investigated and resolved. Funding this study was funded by the Mrc/aBPi inflammation and immunology initiative grant (Mrc reference numbers: g1001516 and g1001518). BDMt is supported by the UK Medical research council (Unit Programme numbers: Mc_ UP_1302/3 and Mc_UU_00002/2). DS was an niHr Senior investigator. Competing interests although the UK ra-MaP consortium is the author, there are a number of individuals (ie, contributors) to this paper, some of whom may have competing interests through their industry affiliation, research funding or consultancy activities. We have uploaded a file listing the contributors and their competing interests if any in the online supplementary material 1.
Patient consent not required.
Provenance and peer review not commissioned; externally peer reviewed. data sharing statement the individual participant data from the 18 clinical trials
on May 7, 2020 by guest. Protected by copyright.
http://rmdopen.bmj.com/
are not available for sharing due to the agreement made with the companies/ investigators who agreed for their non-biological arm(s) data to be used in this work.
Open access this is an open access article distributed in accordance with the creative commons attribution 4.0 Unported (cc BY 4.0) license, which permits others to copy, redistribute, remix, transform and build upon this work for any purpose, provided the original work is properly cited, a link to the licence is given, and indication of whether changes were made. See: http:// creativecommons. org/ licenses/ by/ 4.0
RefeRenceS
1. Schoels M, Knevel R, Aletaha D, et al. Evidence for treating rheumatoid arthritis to target: results of a systematic literature search. Ann Rheum Dis 2010;69:638–43.
2. Smolen JS, Aletaha D, Bijlsma JW, et al. Treating rheumatoid arthritis to target: recommendations of an international task force. Ann Rheum Dis 2010;69:631–7.
3. Ma MH, Scott IC, Kingsley GH, et al. Remission in early rheumatoid arthritis. J Rheumatol 2010;37:1444–53.
4. Prince FHM, Bykerk VP, Shadick NA, et al. Sustained rheumatoid arthritis remission is uncommon in clinical practice. Arthritis Res Ther 2012;14:R68.
5. van der Kooij SM, Goekoop-Ruiterman YPM, de Vries-Bouwstra JK, et al. Drug-free remission, functioning and radiographic damage after 4 years of response-driven treatment in patients with recent-onset rheumatoid arthritis. Ann Rheum Dis 2009;68:914–21. 6. van der Woude D, Young A, Jayakumar K, et al. Prevalence of and
predictive factors for sustained disease-modifying antirheumatic drug-free remission in rheumatoid arthritis: Results from two large early arthritis cohorts. Arthritis & Rheumatism 2009;60:2262–71. 7. Cope AP, Barnes MR, Belson A, et al. Corrigendum: The RA-MAP
Consortium: a working model for academia-industry collaboration. Nat Rev Rheumatol 2018;14:119.
8. Prevoo MLL, van't Hof MA, Kuper HH, et al. Modified disease activity scores that include twenty-eight-joint counts development and validation in a prospective longitudinal study of patients with rheumatoid arthritis. Arthritis & Rheumatism 1995;38:44–8. 9. van Gestel AM, Haagsma CJ, van Riel PL. Validation of rheumatoid
arthritis improvement criteria that include simplified joint counts. Arthritis & Rheumatism 1998;41:1845–50.
10. van der Heijde DM, van 't Hof MA, van Riel PL, et al. Judging disease activity in clinical practice in rheumatoid arthritis: first step in the development of a disease activity score. Ann Rheum Dis 1990;49:916–20.
11. van der Heijde DM, van't Hof MA, van Riel PL, et al. Validity of single variables and composite indices for measuring disease activity in rheumatoid arthritis. Ann Rheum Dis 1992;51:177–81.
12. Fransen J, Creemers MC, van Riel PL. Remission in rheumatoid arthritis: agreement of the disease activity score (DAS28) with the ARA preliminary remission criteria. Rheumatology 2004;43:1252–5. 13. Forslind K, Hafstrom I, Ahlmen M, et al. Sex: a major predictor
of remission in early rheumatoid arthritis? Ann Rheum Dis 2007;66:46–52.
14. Katchamart W, Johnson S, Lin H-JL, et al. Predictors for remission in rheumatoid arthritis patients: A systematic review. Arthritis Care Res 2010;62:1128–43.
15. Furst DE, Pangan AL, Harrold LR, et al. Greater likelihood of remission in rheumatoid arthritis patients treated earlier in the disease course: Results from the Consortium of Rheumatology Researchers of North America registry. Arthritis Care Res 2011;63:856–64.
16. Lin H, McCulloch CE, Turnbull BW, et al. A latent class mixed model for analysing biomarker trajectories with irregularly scheduled observations. Stat Med 2000;19:1303–18.
17. Celeux G, Soromenho G. An entropy criterion for assessing the number of clusters in a mixture model. Journal of Classification 1996;13:195–212.
18. van Buuren S. Multiple imputation of discrete and continuous data by fully conditional specification. Stat Methods Med Res 2007;16:219–42.
19. White IR, Royston P, Wood AM. Multiple imputation using chained equations: Issues and guidance for practice. Stat Med 2011;30:377–99.
20. Rubin DB. Multiple imputation for nonresponse in surveys: John Wiley & Sons, Inc, 1987.
21. R: A language and environment for statistical computing [computer program]. Vienna, Austria: R Foundation for Statistical Computing, 2017.
22. Bates D, Mächler M, Bolker B, et al. Fitting linear mixed-effects models using lme4. J Stat Softw 2015;67.
23. van Buuren S, Groothuis-Oudshoorn K. mice: Multivariate imputations by chained equations in R. J Stat Softw 2011;45. 24. Proust-Lima C, Philipps V, Liquet B. Estimation of extended mixed
models using latent classes and latent processes: the R package lcmm. 2015.
25. Arnett FC, Edworthy SM, Bloch DA, et al. The american rheumatism association 1987 revised criteria for the classification of rheumatoid arthritis. Arthritis & Rheumatism 1988;31:315–24.
26. Matcham F, Norton S, Scott DL, et al. Symptoms of depression and anxiety predict treatment response and long-term physical health outcomes in rheumatoid arthritis: secondary analysis of a randomized controlled trial. Rheumatology 2016;55:268–78. 27. Greenberg JD, Spruill TM, Shan Y, et al. Racial and ethnic disparities
in disease activity in patients with rheumatoid arthritis. Am J Med 2013;126:1089–98.
28. Fusama M, Miura Y, Yukioka K, et al. Psychological state is related to the remission of the Boolean-based definition of patient global assessment in patients with rheumatoid arthritis. Mod Rheumatol 2015;25:679–82.
29. Kekow J, Moots R, Khandker R, et al. Improvements in patient-reported outcomes, symptoms of depression and anxiety, and their association with clinical remission among patients with moderate-to-severe active early rheumatoid arthritis. Rheumatology 2011;50:401–9.
30. Lu B, Rho YH, Cui J, et al. Associations of smoking and alcohol consumption with disease activity and functional status in rheumatoid arthritis. J Rheumatol 2014;41:24–30.
31. Castrejon I, Dougados M, Combe B, et al. Prediction of remission in a french early arthritis cohort by RAPID3 and other core data set measures, but not by the absence of rheumatoid factor, anticitrullinated protein antibodies, or radiographic erosions. J Rheumatol 2016;43:1285–91.
32. Salgado E, Maneiro JR, Carmona L, et al. Rheumatoid factor and response to TNF antagonists in rheumatoid arthritis: Systematic review and meta-analysis of observational studies. Joint Bone Spine 2014;81:41–50.
33. Siemons L, ten Klooster PM, Vonkeman HE, et al. Distinct trajectories of disease activity over the first year in early rheumatoid arthritis patients following a treat-to-target strategy. Arthritis Care Res 2014;66:625–30.
34. Li L, Hser YI. On Inclusion of covariates for class enumeration of growth mixture models. Multivariate Behav Res 2011;46:266–302. 35. Smolen JS, Aletaha D, McInnes IB. Rheumatoid arthritis. Lancet
2016 May 3;16:10–6736.
on May 7, 2020 by guest. Protected by copyright.
http://rmdopen.bmj.com/