Abstract The objective of this study is to model performance improvement of Micro and Small Enterprise (MSE) which produce snack. Analysis units are MSE located in Lampung Province of Indonesia. On this research, performance improvement model was built by 3 sub models, i.e. (1) customer needs and technical responses identification, (2) customer need’s importance, correlation among technical characteristics, and correlation between customer need’s importance with technical characteristics, (3) defining priority and recommend on performance improvement. OWA Operators is used to identify technical responses, relationship between each element of their technical response and each customer need. Quality Function Deployment (QFD) was used to improve MSE’s performance priority and recommendation. To determine the technical correlation, relationship between customer needs and technical responses, and the absolute importance value, we used expert interview method and OWA Operators technique. Result shows that the most important to be improved is on creating new product. Improvement recommendations are transferability raising, replication, workforce capability and motivation, as well as workforce deployment.
Index terms : improvement, micro and small enterprises, performance, strategic management system.
1. INTRODUCTION
Strategy is needed to succeed on competition. Strategy on this case is used to justify planning and controlling activities [1]. On the other hand, according to [2], strategy management is needed in order to minimize risk in decision making process. Using strategic management system, a company capable to operationalize its strategy into particular measurement system, so that the company has better capability to run the strategy with minimum risk. Measurement in the next phase can be used as feed back for suitable activities on company’s value chains. According to [3], effective performance planning includes 3 main processes, i.e. pre performance measurement, performance improvement planning, and performance measurement post improvement.
Submitted for review on January 15th, 2009.
Rakhma Oktavina is with Gunadarma University, Industrial Engineering Department lecturer, Jl.. Margonda Raya No. 100, Depok 16424, West Java, Indonesia. ([email protected])
Hotniar Siringoringo with Gunadarma University, Industrial Engineering Department lecturer, also as Head of Research Center, Jl.. Margonda Raya No. 100, Depok 16424, West Java, Indonesia (Phone : 0622178881112 ext. 455, Fax: 062217872829; email:[email protected],
Sudaryanto is with Gunadarma University, Industrial Engineering Department lecturer, Jl.. Margonda Raya No. 100, Depok 16424, West Java, Indonesia. ([email protected])
However the improvement efforts toward the performance can be done not only by deploying internal environment, but also with external environment of the company, so that in determining performance indicators, company scale becomes important to be considered. Based on scale, a company can be differentiated into three categories, i.e. Micro and Small Enterprises (MSE), medium, and big companies. Among these 3 company scales, MSE dominates Indonesian economics structural. Main problem facing by MSE is low productivity. Based on existing price in 2005, MSE labor productivity is 14.6 millions Indonesian Rupiah (IDR), medium company 67.8 millions IDR, and big scale company is 482.5 millions [4].
On the development of MSE as the activator of economics’ region, it is stated that the scope of commodities priority are (1) snack industry, (2) silk industry, (3) tannin industry, (4) oil palm industry, (5) fertilizer industry (nature and organic), (6) salt industry, (7) roof industry, (8) blacksmith industry, (9) boat industry < 100 GT, (10) the fishermen’s motorization industry, (11) traditional of farming tool industry, (12) traditional weaving industry, (13) jewelry industry, and (14) plaiting industry.
Lampung is one of the provinces which have good potential in developing MSE, mostly in snack industry with the orientation of regional and export market [5]. It is because Lampung has the potential supply of raw materials and supporting the industry’s climate that exist for the performing of economic of democracy. One of the snack industries that has good prospect is banana chips. Banana chips industries in Lampung are spread out in region of Tanggamus, Lampung Selatan, Tulang Bawang and Lampung Tengah [6]. It is predicted that the number of this industry will increase continually because banana is one of the main commodity of Lampung [7].
However, improving the competitive power of MSE which produce banana chips depends on performance of MSE itself. Good performance can be managed efficiently and effectively if it is supported by optimal improvement of performance process. Performance improvement technique that capable in mapping the customer as main indicator is needed to explore customer expectation performance. This is done in order to bring company closer to customer, and drive all people inside company to be involved in satisfying customers. Fully redesign process was needed to facilitate management to arrange elements in filtering, defining, and deploying customer voices on any level. In that case, management will be able to evaluate potential responses in order to represent universality of customer needs. Performance improvement tool that is used must be able to Rakhma Oktavina, Hotniar Siringiringo, Sudaryanto
map limited resources and company condition as a basic of continuous and directed priority improvement.
The aim of this research is to develop MSE’s performance improvement model based on strategic management system.
2. THEORETICAL BACKGROUND
A. Performance’s Improvement Process
According to [8] performance is achievement which is often used to show the ability or “the show” which is commonly used to show up the performance or it also means “doing the task that shows someone’s action in working. On the other hand, [9] define that performance is the record of the result which is gained from the function of certain work or certain activities in the certain period of time.
Performance commonly used to evaluate the strategy. There are some obstacles in implementing the strategy that can be overcame by implementing the components of management strategy [2]. In the perspective of management strategy, environment is the important and contextual factor which has the effect to the performance of the company [10]. The concept of modern management shows that the industry which is conducting an economic activity does not stand independently, but it is in the business environment which is affected each other. Generally, the company is in the centre of business environment that consists of government, people, customers, distributors, employees and the same industry which also being the competitor.
The strategy is needed by the industry in order to be able to achieve the result based on the vision, mission, goal and target of the company. The company’s ability to place its position in the environment by considering and evaluating itself condition from environmental factors which affects each other will hardly determine the success of the company. With strategic management, company can translate its strategy into a specific measurement process so have better capability to run the strategy with minimum risk. The measurement output then used as a feed back that can give more information about company’s achievement on all it’s activities in the company’s value chain and can be the base of improvement strategy, that’s called company’s performance improvement.
B. Strategic Management System
System is group of entities that was related and organized to achieve a goal [11]. System methodology consists of (1) needs analysis, (2) system identification, (3) problem formulation, (4) system alternative, (5) determination and physical realization, social, and politic, and (6) feasibility.
Strategic management is a stream of decision and actions which leads to the development of an effective strategy or strategies to help in achieving corporate objectives [12]. Management strategic process consists of 4 elements, i.e. (1) environment study, (2) strategies formulation, (3) strategy implementation, and (4) evaluation and control.
C. Ordered Weighted Averaging (OWA) Operators
In the first stage on OWA operators, individual experts are asked to provide an evaluation of the alternatives. This evaluation consists of a rating for each alternative on each
criteria. Decision maker provides an aggregation function which we shall denote as Q. This function can be seen as a generalization of the idea of how many expert feels need to agree on a project for it to be acceptable. In particular, for each number i, where i runs from 1 to r, the decision maker must provide a value Q(i) indicating how satisfied them would be in selecting a proposal with which i of the expert were satisfied. The value for Q(i) should be drawn from the scale S= (S1, S2,…..Sn).
The function Q should have certain characteristics to make it rational:
1. As more expert agree, the decision maker’s satisfaction or confidence should increase: Q(i) ≥ Q(j) ;
i > j.
2. If all the expert are satisfied, then the satisfaction should be the highest possible: Q(r) = perfect
3. If no expert are satisfied the satisfaction to Q should be lowest: Q(o) = none
In the following we shall suggest a manifestation of Q that can be said to emulate the usual arithmetic averaging function. [13] provide a formal justification of this relationship. In order to define this function, introduced the operation Int (a) as returning the integer value that is closest to the number a. In the following, let q be the number of points on the scale (the cardinality of S) and r be the number of expert participating. This function which emulates the average is denoted as QA and is defined for all i = 0, 1, ...., r as Qa(k) = Sb(k) where b(k) = Int [1 + (k * (q-1/r))]. To appropriately selected Q, we are now in the position to uses the ordered weighted averaging (OWA) method [13], for aggregating the expert opinions. Assume that we have r expert, each of which has a unit evaluation for the ith project denoted Pik. The first step in OWA procedure is to order the PikS in descending order: thus we shall Bj as the jth highest score among the expert’s unit scores for the project. To find the overall evaluation for the ith project, Pi, we calculate Pi = Max j=1,...,r[Q(j) Λ Bj], which Bj can be seen as the worst of the decision maker feels that the support of at least j expert is. The term Q (j) Λ Bj can be seen as weighting of an object’s j best scores, Bj, and the decision maker’s requirement that j people support the project, Q(j). The max operation plays a role akin to the summation in usual numeric averaging procedure.
D. Quality Function Deployment
Quality Function Deployment (QFD) is a method for structured product planning and development that enables a development team to specify clearly customer’s needs, and then to evaluate each proposed product capability systematically in term of its impact on meeting those need. The QFD process involves constructing one or more matrices (sometimes called “House of Quality” (HOQ). It displays the customer’s needs (the “Voice of the Customer”) along the left, and the development team’s technical response to meeting those needs along the top [14]. The matrix consists of several section or sub matrices joined together in various ways, each containing information related to the other.
QFD according to [15] are (1) increasing quality level and customer satisfaction, (2) increasing company’s performance, (3) cycle time reduction, (4) increasing technical and staff’s productivities, (5) complain quarantine’s reduction, (6) increasing market opportunity, (7) increasing company’s profitability, and (8) developing decision making process.
3. RESEARCH METHODOLOGY
Modeling was done in two steps. It was started with needs analysis, and followed by modeling of the system. Customer needs was key performance indicator that must be improved after the measurement process using Balanced Scorecard technique and based on management strategic system [16]. To identify technical response, relationship between each element of their technical response and each customer need was used OWA Operators technique. Expert survey method was done to acquire the expert knowledge on key performance indicator in MSE’s performance measurement and improvement process.
System modelling uses strategic management system based on resources and knowledge strategy. Strategic
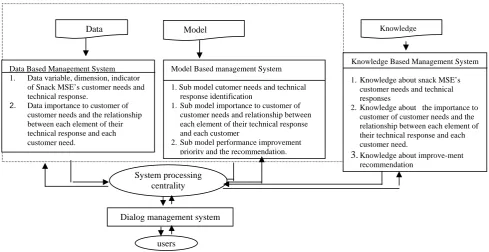
management was used to transform the data into knowledge related to performance improvement process. Snack MSE’ performance improvement model designed by system approach which was consists of 3 sub models. First step of improvement process was customer needs and technical response identification. The second step was to determine the importance of customer needs and relationship between each element of their technical response and each customer need. The last step was to determine performance improvement priority and giving the recommendation. The configuration of model can be seen at Figure 1.
A. Sub Model Customer Needs and Technical Response Identification
[image:3.595.36.526.329.581.2]In this research, customer need was identified on preliminary research. Customer needs are key performance indicators that must be improved after the measurement process using Balanced Scorecard technique and based on management strategic approach [16]. To identify technical response, relationship between each element of their technical response and each customer need was identified using OWA Operators technique.
Figure 1. The Configuration of Snack MSE’ Performance Improvement Model
B. Sub Model Correlation, Relationship, and Importance The correlation that is referred to as the “roof” of House Of Quality (HOQ) sometimes called the technical correlation section. Identifying strength of correlation among technical characteristics was done by conducting depth interview with experts and then analyzed using OWA Operators. Once the technical correlation matrix has been rotated, the redundant row and columns removed, and correlation filled in by assign 2 = strong positive impact, 1= moderate positive impact, <blank>= no impact, -1= moderate negative impact, and -2 = strong negative impact.
The relationship section provides mapping between customer needs on one hand, and technical responses on another. Output of experts interview conducted by using
OWA Operators technique, and relationship between customer needs and technical responses will be resulted by deploying correlation tool. Certain symbols are customarily used in QFD to denote these four possible impacts. If it is strongly linked, numerical value is 9, and the symbol ; if it is moderately linked, numerical value is 3, and the symbol ; if it is possibly linked, numerical value is 1, and the symbol ; if it is not linked, numerical value s 0, and the symbol <blank>.
The absolute importance entries are chosen from a scaled selection of importance, based on a five-point scale where the values 1 to 5 may be defined as 1 is not at all importance to the customer; 2 of minor importance to the customer; 3 of moderate importance to the customer; 4 Very important
Data Based Management System 1. Data variable, dimension, indicator
of Snack MSE’s customer needs and technical response.
2. Data importance to customer of customer needs and the relationship between each element of their technical response and each customer need.
Model Based management System 1. Sub model cutomer needs and technical
response identification
1.Sub model importance to customer of customer needs and relationship between each element of their technical response and each customer
2.Sub model performance improvement priority and the recommendation.
Knowledge Based Management System 1.Knowledge about snack MSE’s
customer needs and technical responses
2.Knowledge about the importance to customer of customer needs and the relationship between each element of their technical response and each customer need.
3.Knowledge about improve-ment recommendation
Model
System processing centrality
Dialog management system
users
Knowledge
to the customer; and 5 of highest importance to the customer. The aggregation importance values resulted by using OWA Operators technique.
C. Sub Model Performance Improvement Priority and Recommendation
Performance improvement process was done using QFD technique. From this step, priority improvement level was defined. The priority level was quantative data in nature and represent level of relationship between value of technical responses “X” and customer needs “A” to the importance to customer weighted. Technical responses priorities value (S) sometimes called importance of the HOWs.
Recommendation was resulted by elaborating the technical correlation result, theoretical studies, and expert judgment intensively in depth interview consultation.
4. RESULT AND DISCUSSION
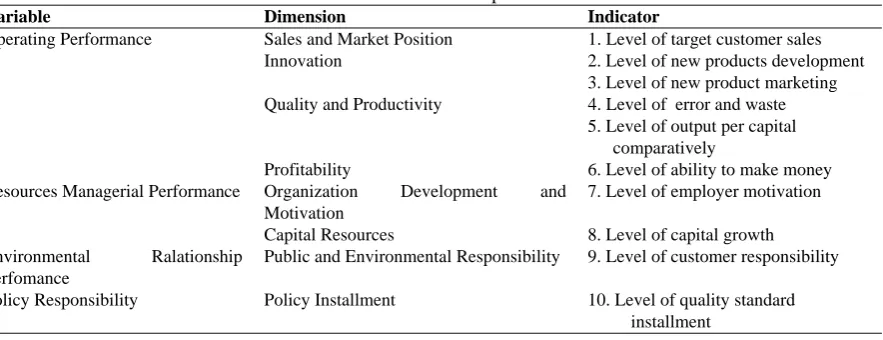
A. Customer Needs and Technical Response Identification. Customer needs are key performance, which were identified on preliminary research [16]. Performance measurement was done using Balanced Scorecard technique and based on management strategic approach. Previous research resulted 17 key performance indicators that must be improved, which are capacity, substitution price level, price level, transferability, replicability, customer growth/year, cost reduction/year, revenue growth/year, sales growth/year, cost per unit, company profit level, customer retention level, customer satisfaction level, new product/year, employee capability level, and employee motivation level. Identification of technical response using OWA Operators technique result 10 technical responses (Table 1).
Determination of customer needs weight and relationship value of weight level with technical characteristics was done using OWA Operators technique. The result can be seen at Figure 2. As shown at that figure, capacity indicator of key
performance has strong relationship with target customer sales level, output per capital comparatively level, ability to make money level, and capital growth level of technical characteristics. As well, price level is strongly linked with, target customer sales level, error and waste level, output per capital comparatively level, ability to make money level, customer responsibility level, and quality standard installment level. Almost all key performances are strongly linked with technical performances, except substitution price level with all technical characteristics. Even though, substitution price level has only possibly linked with target customer sales level and employer motivation level, and there’s no link with other technical characteristics. Employ capacity level of key performance link with all technical characteristics, with 7 out of 10 technical characteristics are strongly linked, one is possibly link and 2 are moderately linked.
The correlation that is referred to as the “roof” was resulted from interview to the experts. OWA Operators technique result correlation value among technical responses. According to result of HOQ, the prirority level can be determined.
B. Verification and Validation Model
Modeling was done using system approach, so qualitative assesments such as subject matter expertand peer review was used. Formal process by face validation was choosen [17]. As shown by verification process, model logic was appropriate with the existing condition. In validation process, the model can interpret performance improvement process of MSE banana’s chip generally.
C. Model Implementation
[image:4.595.55.497.531.701.2]Model implementation was done on MSE banana’s chip in Bandar Lampung, Lampung Province, Indonesia. The result show the improvement priorities. The improvement recommendation was tended to new product creation, by increasing the ability to transfer and replicate, increasing employee capability, motivation, and empowerment.
Table 1 . Technical Responses of Snack MSE
Variable Dimension Indicator
Operating Performance Sales and Market Position 1. Level of target customer sales
Innovation 2. Level of new products development
3. Level of new product marketing
Quality and Productivity 4. Level of error and waste
5. Level of output per capital comparatively
Profitability 6. Level of ability to make money
Resources Managerial Performance Organization Development and
Motivation
7. Level of employer motivation
Capital Resources 8. Level of capital growth
Environmental Ralationship Perfomance
Public and Environmental Responsibility 9. Level of customer responsibility
Policy Responsibility Policy Installment 10. Level of quality standard
TS NPD NPM
E&W OC AM M E
M
CG CR QSI
Technical Responses
Key performance indicator
Operation Performance Resources Manageri-al Perfor-mance
Environ mental Relation ship Perfor mance
Poli cy
Importance t
o
Custome
r
CL 9 9 9 9 4
External Environment Perspective
SPL 9 3 3 9 9 9 3 3 9 9 5
PL 1 1 5
TL 9 1 1 9 9 1 3 1 1 4
Internal Environ- RL 3 9 9 3 1 1 1 3 4
Ment Perspective CGL 9 9 1 1 1 1 3 4
CRL 9 9 1 1 3 9 3 1 1 5
Strategic Planning
Perspective RGL 1 1 9 9 3 3 3 1 1 4
SGL 3 9 1 3 3 9 3 9 1 1 5
Financial Perspective
CL 9 9 1 1 1 9 3 3 1 1 5
CPU 1 1 9 9 3 1 1 1 1 4
CPL 3 9 1 9 9 9 3 9 1 1 5
CRL 9 3 3 1 0 3 1 1 9 9 4
Customer
Perspective CSL 3 9 3 3 1 3 9 1 9 9 4
Internal-Process-Business Perspective
NPL 9 9 3 9 3 9 3 3 4
Learning and Growth
ECL 9 9 9 9 9 3 3 1 3 3 4
[image:5.595.74.522.59.469.2]Perspective EML 3 9 3 9 9 3 9 3 3 4
Figure 2. Relationship Among Customer Needs And Technical Responses, and The Absolute Importance Value
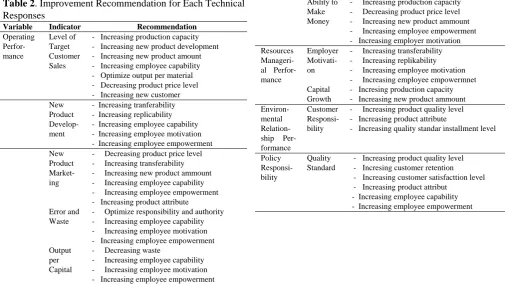
Table 2. Improvement Recommendation for Each Technical Responses
Variable Indicator Recommendation
Operating Perfor-mance
Level of Target Customer Sales
- Increasing production capacity - Increasing new product development - Increasing new product amount - Increasing employee capability - Optimize output per material - Decreasing product price level - Increasing new customer New
Product Develop-ment
- Increasing tranferability - Increasing replicability - Increasing employee capability - Increasing employee motivation - Increasing employee empowerment New
Product Market-ing
- Decreasing product price level - Increasing transferability - Increasing new product ammount - Increasing employee capability - Increasing employee empowerment - Increasing product attribute Error and
Waste
- Optimize responsibility and authority - Increasing employee capability - Increasing employee motivation - Increasing employee empowerment Output
per Capital
- Decreasing waste
- Increasing employee capability - Increasing employee motivation - Increasing employee empowerment
Ability to Make
Money
- Increasing production capacity - Decreasing product price level - Increasing new product ammount - Increasing employee empowerment - Increasing employer motivation Resources
Manageri-al Perfor-mance
Employer Motivati-on
- Increasing transferability - Increasing replikability - Increasing employee motivation - Increasing employee empowermnet Capital
Growth
- Incresing production capacity - Increasing new product ammount
Environ-mental Relation-ship Per-formance
Customer Responsi-bility
- Increasing product quality level - Increasing product attribute
- Increasing quality standar installment level Policy
Responsi-bility
Quality Standard
- Increasing product quality level - Incresing customer retention - Increasing customer satisfacttion level - Increasing product attribut
- Increasing employee capability - Increasing employee empowerment
[image:5.595.44.555.499.785.2]REFERENCES
[1] S.Yuwono, E. Sukarno and M. Ichsan, Practical Guidelines of
Balanced Sdorecard, Jakarta: PT. Gramedia Pustaka Utama, 2004, pp. 11-17.
[2] R. Kaplan and D.P. Norton, The Balanced Scorecard: Translating Strategy Into Action. 1st edition, Boston: Harvard Business School
Press, 1996. pp. 1-20.
[3] J.N. Younker, “Integrated perfomance planning: a major force for measuring and improving organiztion performance”, in Handbook for Productivity Measurement and Improvement, Oregon: Productivity Press, 1993, pp. 2.3.1-2.3.11.
[4] Central Bureau of Statistics, “National Economic Census 2006”, Jakarta:BPS, 2007.
[5] Industry and Trading Department, “Master Plan of Small and Medium Industry Development 2002-2004”. Jakarta: Deperindag, 2002. pp. 17-28.
[6] Cooperation of Industry and Trading Department, “Small and Medium Data in Lampung Province, Bandar Lampung, 2004. [7] The minister of Technology and Research of Lampung University,
”Final Report of National Strategic of Superior Agroindustry Development”. Bandar Lampung: Lampung University, 2003, pp.20-40.
[8] Guralnik and B. David, Webster’s New World College Dictionary, New York: A Simon & Schusteer Macmillan Company, 1996.
[9] Bernardin and Russel, “Human Resource Management: An Experimental Approach”,Academy of Management Journal, Vol. 38 pp.673-703.
[10] J. Child, ”Strategic Choice in The Analysis of Action, Structure, Organization and Environment: Retrospect and Prospect” .
Organization Studies, Vol. 18, 1997, pp. 43-76.
[11] T.J. Manetsch and G.L Park, System Analysis and Simulations with Application to Economic and Social System. 3rd Ed. Departement of
Electrical Engineering and System Science Michigan State University, 1977.
[12] L.R.Jauch and W.F. Glueck, Business Policy and Strategic Management. 5th Ed, Singapore: Mc Graw-Hill International
Editions, 1992. pp. 5-6.
[13] R.R. Yager, Non-Numeric Multi-Criteria Multi Person Decision Making, IEEE Transaction of System, 18, 1993, pp.183-190. [14] L. Cohen, Quality Function Deployment: How To Make QFD Work
for You, Massachusetts: Addison Wesley, 1995, pp. 11-16.
[15] B. G. Dale, Managing Quality, New York: Prentice Hall, 1995, pp.2-10.
[16] R. Oktavina, M.S. Ma’arif, Eriyatno, Expert Management System of Snack’s SME’s Performance Measurement, Industrial Engineering Seminar, Makassar: BKSTI, 2008, pp. 445-452.
[17] J.D Illgen and D. W. Gledhill. (2008, April, 4). Verification and Validation: 21st Century Verification and Validation Technique.