85
Red Dragon AI at TextGraphs 2019 Shared Task:
Language Model Assisted Explanation Generation
Yew Ken Chia Red Dragon AI
Singapore
Sam Witteveen Red Dragon AI
Singapore
Martin Andrews Red Dragon AI
Singapore
Abstract
The TextGraphs-13 Shared Task on Explana-tion RegeneraExplana-tion (Jansen and Ustalov,2019) asked participants to develop methods to re-construct gold explanations for elementary sci-ence questions. Red Dragon AI’s entries used the language of the questions and explanation text directly, rather than a constructing a sep-arate graph-like representation. Our leader-board submission placed us 3rdin the compe-tition, but we present here three methods of in-creasing sophistication, each of which scored successively higher on the test set after the competition close.
1 Introduction
The Explanation Regeneration shared task asked participants to develop methods to reconstruct gold explanations for elementary science ques-tions (Clark et al., 2018), using a new corpus of gold explanations (Jansen et al., 2018) that provides supervision and instrumentation for this multi-hop inference task.
Each explanation is represented as an “explana-tion graph”, a set of atomic facts (between 1 and 16 per explanation, drawn from a knowledge base of 5,000 facts) that, together, form a detailed ex-planation for the reasoning required to answer and explain the resoning behind a question.
Linking these facts to achieve strong perfor-mance at rebuilding the gold explanation graphs requires methods to perform multihop inference -which has been shown to be far harder than infer-ence of smaller numbers of hops (Jansen, 2018), particularly for the case here, where there is con-siderable uncertainty (at a lexical level) of how individual explanations logically link somewhat ‘fuzzy’ graph nodes.
Data Python Scala Python Leaderboard split Baseline Baseline Baseline1e9 Submission
Train 0.0810 0.2214 0.4216 Dev 0.0544 0.2890 0.2140 0.4358
Test 0.4017
Table 1: Base MAP scoring - where the Python Baseline1e9is the same as the original Python Baseline, but with theevaluate.pycode updated to assume missing explanations have rank of109
1.1 Dataset Review
The WorldTree corpus (Jansen et al., 2018) is a new dataset is a comprehensive collection of ele-mentary science exam questions and explanations. Each explanation sentence is a fact that is related to science or common sense, and is represented in a structured table that can be converted to free-text. For each question, the gold explanations have lexical overlap (i.e. having common words), and are denoted as having a specific explanation role such asCENTRAL(core concepts); GROUNDING
(linking core facts to the question); andLEXICAL GLUE (linking facts which may not have lexical overlap).
1.2 Problem Review
As described in the introduction, the general task being posed is one of multi-hop inference, where a number of ‘atomic fact’ sentences must be com-bined to form a coherent chain of reasoning to solve the elementary science problem being posed. These explanatory facts must be retrieved from a semi-structured knowledge base - in which the surface form of the explanation is represented as a series of terms gathered by their functional role in the explanation.
PROTO-HABITATStable. However, in the same table there are also more elaborate explanations, for example : “Mice live in in holes in the ground in fields / in forests.” is expressed as : “[mice] [live in] [in holes in the ground] [in fields OR in forests]”. And more logically complex : “Most predators live in/near the same environment as their prey.” being expressed as : “[most] [preda-tors] [live in OR live near] [the same environment as their prey]”.
So, whereas the simpler explanations fit in the usual Knowledge-Base triples paradigm, the more complex ones are much more nuanced about what actually constitutes a node, and how reliable the arcs are between them. Indeed, there is also a col-lection of if/thenexplanations, including ex-amples such as : “[if] [something] [has a] [posi-tive impact on] [something else] [then] [increas-ing] [the] [amount of] [that someth[increas-ing] [has a] [positive impact on] [that something else]” - where the explanation has meta-effect on the graph itself, and includes ‘unbound variables’.1
2 Preliminary Steps
In this work, we used the pure textual form of each explanation, problem and correct answer, rather than using the semi-structured form given in the column-oriented files provided in the dataset. For each of these we performed Penn-Treebank to-kenisation, followed by lemmatisation using the lemmatisation files provided with the dataset, and then stop-word removal.2
Concerned by the low performance of the Python Baseline method (compared to the Scala Baseline, which seemed to operate using an al-gorithm of similar ‘strength’), we identified an issue in the organizer’s evaluation script where predicted explanations that were missing any of the gold explanations were assigned a MAP score of zero. This dramatically penalised the Python Baseline, since it was restricted to only returning 10 lines of explanation. It also effectively forces all submissions to include a ranking over all ex-planations - a simple fix (with the Python Baseline rescored in Table 1) will be submitted via GitHub. This should also make the upload/scoring process faster, since only the top∼1000 explanation lines meaningfully contribute to the rank scoring.
1
The PROTO-IF-THENexplanation table should have
been annotated with a big red warning sign
2PTB tokenisation and stopwords from theNLTK
pack-age)
3 Model Architectures
Although more classic graph methods were ini-tially attempted, along the lines of Kwon et al.
(2018), where the challenge of semantic drift in multi-hop inference was analysed and the effec-tiveness of information extraction methods was demonstrated, the following 3 methods (which now easily surpass the score of our competition submission) were ultimately pursued due to their simplicity/effectiveness.
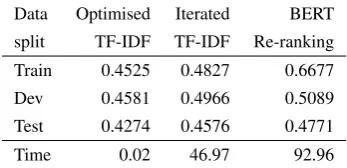
Data Optimised Iterated BERT split TF-IDF TF-IDF Re-ranking Train 0.4525 0.4827 0.6677 Dev 0.4581 0.4966 0.5089 Test 0.4274 0.4576 0.4771
Time 0.02 46.97 92.96
Table 2: MAP scoring of new methods. The timings are in seconds for the whole dev-set, and the BERT Re-ranking figure includes the initial Iterated TF-IDF step.
3.1 Optimized TF-IDF
As mentioned above, the original TF-IDF imple-mentation of the provided Python baseline script did not predict a full ranking, and was penalized by the evaluation script. When this issue was remedied, its MAP score rose to 0.2140.
However, there are three main steps that signif-icantly improve the performance of this baseline:
1. The original question text included all the an-swer choices, only one of which was correct (while the others are distractors). Removing the distractors resulted in improvement;
2. The TF-IDF algorithm is very sensitive to keywords. Using the provided lemmatisation set and NLTK for tokenisation helped to align the different forms of the same keyword and reduce the vocabulary size needed;
3. Stopword removal gave us approximately 0.04 MAP improvement throughout - remov-ing noise in the texts that was evidently ‘dis-tracting’ for TF-IDF.
3.2 Iterated TF-IDF
While graph methods have shown to be effective for multi-hop question answering, the schema in the textgraphs dataset is unconventional (as illus-trated earlier). To counter this, the previous TF-IDF method was extended to simulate jumps be-tween explanations, inspired by graph methods, but without forming any actual graphs:
1. TF-IDF vectors are pre-computed for all questions and explanation candidates;
2. For each question, the closest explanation candidate by cosine proximity is selected, and their TF-IDF vectors are aggregated by amaxoperation;
3. The next closest (unused) explanation is se-lected, and this process was then applied it-eratively up to maxlen=128 times3, with the current TF-IDF comparison vector pro-gressively increasing in expressiveness. At each iteration, the current TF-IDF vector was down-scaled by an exponential factor of the length of the current explanation set, as this was found to increase development set results by up to +0.0344.
By treating the TF-IDF vector as a representa-tion of the current chain of reasoning, each succes-sive iteration builds on the representation to accu-mulate a sequence of explanations.
The algorithm outlined above was additionally enhanced by adding a weighting factor to each successive explanation as it is added to the cumu-lative TF-IDF vector. Without this factor, the ef-fectiveness was lower because the TF-IDF repre-sentation itself was prone to semantic drift away from the original question. Hence, each succes-sive explanation’s weight was down-scaled, and this was shown to work well.4
3.3 BERT Re-ranking
Large pretrained language models have been proven effective on a wide range of downstream tasks, including multi-hop question answering, such as inLiu et al.(2019) on the RACE dataset,
3Thismaxlenvalue was chosen to minimise
computa-tion time, noting that explanacomputa-tion ranks below approximately 100 have negligible impact on the final score.
4Full, replicable code is available on GitHub for all
3 methods described here, at https://github.com/ mdda/worldtree_corpus/tree/textgraphs
andXu et al.(2019) which showed that large
fine-tuned language models can be beneficial for com-plex question answering domains (especially in a data-constrained context).
Inspired by this, we decided to adapt BERT
(Devlin et al.,2018) - a popular language model
that has produced competitive results on a variety of NLP tasks - for the explanation generation task. For our ‘BERT Re-ranking’ method, we attach a regression head to a BERT Language Model. This regression head is then trained to predict a rele-vance score for each pair of question and explana-tion candidate. The approach is as follows :
1. Calculate a TF-IDF relevance score for every tokenised explanation against the tokenised ‘[Problem] [CorrectAnswer] [Gold explana-tions]’in the training set. This will rate the true explanation sentences very highly, but also provide a ‘soft tail’ of rankings across all explanations;
2. Use this relevance score as the prediction target of the BERT regression head, where BERT makes its predictions from the original ‘[Problem] [CorrectAnswer]’ text combined with each potential Explanation text in turn (over the training set);
3. At prediction time, the explanations are ranked according to their relevance to ‘[Prob-lem] [CorrectAnswer]’ as predicted by the BERT model’s output.
We cast the problem as a regression task (rather than a classification task), since treating it as a task to classify which explanations are relevant would result in an imbalanced dataset because the gold explanation sentences only comprise a small pro-portion of the total set. By using soft targets (given to us by the TF-IDF score against the gold answers in the training set), even explanations which are not designated as “gold” but have some relevance to the gold paragraph can provide learning signal for the model.
Due to constraints in compute and time, the model is only used to rerank thetopn = 64
pre-dictions made by the TF-IDF methods.
1 2 3 4 5 6 7 8 9 10+
Gold explanation lengths
0.0 0.2 0.4 0.6 0.8
Mean
MAP
score
Mean MAP score against Gold explanation lengths
[image:4.595.77.288.59.198.2]OptimizedTFIDF IterativeTFIDF IterativeTFIDF + BERT
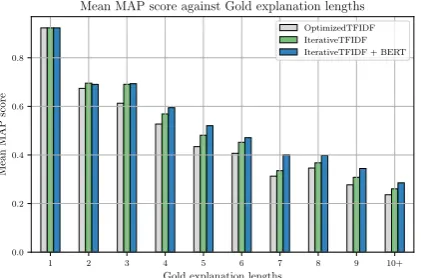
Figure 1: Mean MAP score against gold explanation lengths
other tests, we found that the “Large” size model did not help improve the final MAP score.
4 Discussion
The authors’ initial attempts at tackling the Shared Task focussed on graph-based methods. However, as identified in (Jansen,2018), the uncertainty in-volved with interpreting each lexical representa-tion, combined with the number of hops required, meant that this line of enquiry was put to one side5. While the graph-like approach is clearly attrac-tive from a reasoning point of view (and will be the focus of future work), we found that using purely the textual aspects of the explanation database bore fruit more readily. Also. the complexity of the resulting systems could be minimised such that the description of each system could be as consise as possible.
Specifically, we were able to optimise the TF-IDF baseline to such an extent that our ‘Opti-mised TF-IDF’ would now place 2nd in the
sub-mission rankings, even though it used no special techniques at all.6
The Iterated TF-IDF method, while more algo-rithmically complex, also does not need any train-ing on the data before it is used. This shows how effective traditional text processing methods can be, when used strategically.
The BERT Re-ranking method, in contrast, does require training, and also applies one of the more sophisticated Language Models available to ex-tract more meaning from the explanation texts.
Figure 1 illustrates how there is a clear trend
to-5
Having only achieved 0.3946 on the test set
6Indeed, our Optimized TF-IDF, scoring 0.4581 on the
dev set, and 0.4274 on the test set, could be considered a new baseline for this corpus, given its simplicity.
Explanation Optimised Iterated BERT role TF-IDF TF-IDF Re-ranking
GROUNDING 0.1373 0.1401 0.0880
LEX-GLUE 0.0655 0.0733 0.0830
CENTRAL 0.4597 0.5033 0.5579
BACKGROUND 0.0302 0.0285 0.0349
[image:4.595.311.520.70.183.2]NEG 0.0026 0.0025 0.0022 ROLE 0.0401 0.0391 0.0439
Table 3: Contribution of Explanation Roles - Dev-Set MAP per role (computed by filtering explanations of other roles out of the gold explanation list then com-puting the MAP as per normal)
wards being able to build longer explanations as our semantic relevance methods become more so-phisticated.
There are also clear trends across the data in Ta-ble 3 that show that the more sophisticated meth-ods are able to bring moreCENTRALexplanations into the mix, even though they are more ‘textually distant’ from the original Question and Answer statements. Surprisingly, this is at the expense of some of theGROUNDINGstatements.
Since these methods seem to focus on different aspects of solving the ranking problem, we have also explored averaging the ranks they assign to the explanations (essentially ensembling their de-cisions). Empirically, this improves performance7 at the expense of making the model more obscure.
4.1 Further Work
Despite our apparent success with less sophis-ticated methods, it seems clear that more ex-plicit graph-based methods appears will be re-quired to tackle the tougher questions in this dataset (for instance those that require logical de-ductions, as illustrated earlier, or hypothetical sit-uations such as some ‘predictor-prey equilibrium’ problems). Even some simple statements (such as ‘Most predators ...’) present obstacles to existing Knowledge-Base representations.
In terms of concrete next steps, we are ex-ploring the idea of creating intermediate forms of representation, where textual explanations can be linked using a graph to plan out the logical steps. However these grander schemes suffer from being
7The combination of ‘Iterated TF-IDF’ and ‘BERT
incrementally less effective than finding additional ‘smart tricks’ for existing methods!
In preparation, we have begun to explore doing more careful preprocessing, notably :
1. Exploiting the structure of the explanation tables individually, since some columns are known to be relationship-types that would be suitable for labelling arcs between nodes in a typical Knowledge Graph setting;
2. Expanding out the conjunction elements within the explanation tables. For instance in explanations like “[coral] [lives in the] [ocean OR warm water]”, the different sub-explanations “(Coral, LIVES-IN, Ocean)” and “(Coral, LIVES-IN, WarmWater)” can be generated, which are far closer to a ‘graph-able’ representation;
3. Better lemmatisation : For instance ‘ice cube’ covers both ‘ice’ and ‘ice cube’ nodes. We need some more ‘common sense’ to cover these cases.
Clearly, it is early days for this kind of multi-hop inference over textual explanations. At this point, we have only scratched the surface of the problem, and look forward to helping to advance the state-of-the-art in the future.
Acknowledgments
The authors would like to thank Google for ac-cess to the TFRC TPU program which was used in training and fine-tuning models during experi-mentation for this paper.
References
Peter F. Clark, Isaac Cowhey, Oren Etzioni, Tushar Khot, Ashish Sabharwal, Carissa Schoenick, and Oyvind Tafjord. 2018. Think you have solved ques-tion answering? Try ARC, the AI2 Reasoning Chal-lenge.ArXiv, arXiv:1803.05457.
Jacob Devlin, Ming-Wei Chang, Kenton Lee, and Kristina Toutanova. 2018. BERT: Pre-training of deep bidirectional transformers for language understanding. Computing Research Repository, arXiv:1810.04805.
Peter Jansen. 2018. Multi-hop inference for sentence-level textgraphs: How challenging is meaningfully combining information for science question answer-ing? In Proceedings of the Twelfth Workshop on Graph-Based Methods for Natural Language Pro-cessing (TextGraphs-12), pages 12–17.
Peter Jansen and Dmitry Ustalov. 2019. TextGraphs 2019 Shared Task on Multi-Hop Inference for Ex-planation Regeneration. InProceedings of the Thir-teenth Workshop on Graph-Based Methods for Nat-ural Language Processing (TextGraphs-13), Hong Kong. Association for Computational Linguistics.
Peter Jansen, Elizabeth Wainwright, Steven Mar-morstein, and Clayton Morrison. 2018. WorldTree: A Corpus of Explanation Graphs for Elementary Science Questions supporting Multi-hop Inference. InProceedings of the Eleventh International Confer-ence on Language Resources and Evaluation (LREC 2018), Miyazaki, Japan. European Language Re-sources Association (ELRA).
Heeyoung Kwon, Harsh Trivedi, Peter Jansen, Mi-hai Surdeanu, and Niranjan Balasubramanian. 2018. Controlling information aggregation for complex question answering. InEuropean Conference on In-formation Retrieval, pages 750–757. Springer.
Yinhan Liu, Myle Ott, Naman Goyal, Jingfei Du, Man-dar Joshi, Danqi Chen, Omer Levy, Mike Lewis, Luke Zettlemoyer, and Veselin Stoyanov. 2019. Roberta: A robustly optimized bert pretraining ap-proach. arXiv preprint arXiv:1907.11692.