Ireland’s Competitiveness
Scorecard 2014
July 2014
Ireland’
s Competitiveness Scorecard 2014
Wilton Park House, Wilton Place, Dublin 2, Ireland
Tel: +353 1 607 3000 Fax: +353 1 607 3030
Introduction to the National Competitiveness Council
The National Competitiveness Council was established by Government in 1997. It reports to the Taoiseach and the Government, through the Minister for Jobs, Enterprise and Innovation on key competitiveness issues facing the Irish economy and offers recommendations on policy actions required to enhance Ireland’s competitive position. Each year the NCC publishes two annual reports.
Ireland’s Competitiveness Scorecard provides a comprehensive statistical assessment of Ireland's
competitiveness performance.
Ireland’s Competitiveness Challenge uses this information along with the latest research to
outline the main challenges to Ireland’s competitiveness and the policy responses required to meet them.
National Competitiveness Council Members
Dr Don Thornhill Chair, National Competitiveness Council
Liam Casey Chief Executive Officer, PCH International Ltd.
Prof. Peter Clinch Jean Monnet Professor of European Economics and Professor of Public
Policy, University College Dublin
Shay Cody General Secretary, IMPACT Trade Union
Clare Dunne Assistant Secretary, DJEI
Isolde Goggin Chairperson, Competition Authority
John Herlihy Vice President, International SMB Sales and Head of Google Ireland
Danny McCoy Chief Executive Officer, Ibec
Jane Magnier Joint Managing Director, Abbey Tours
Seán Murphy Deputy Chief Executive, Chambers Ireland
Seán O'Driscoll Chairman and Chief Executive Officer, Glen Dimplex Group
Louise Phelan Vice President of Global Operations, Europe Middle East and Africa, PayPal
Heather Reynolds Director, Eishtec
Dave Shanahan Head of Strategic Health Initiatives Worldwide, AbbVie
Martin D. Shanahan Chief Executive, Forfás
Paul Sweeney Former Chief Economist, ICTU
Siobhán Talbot Group Managing Director, Glanbia
Council Advisers
Ray O’Leary Department of Transport, Tourism, and Sport
John Callinan Department of the Taoiseach
Michael Layde Department of Environment, Community and Local Government
Katherine Licken Department of Communications, Energy and Natural Resources
John McCarthy Department of Finance
Conan McKenna Department of Justice and Equality
David Moloney Department of Public Expenditure and Reform
Aidan O’Driscoll Department of Agriculture, Food and the Marine
Deirdre McDonnell Department of Education and Skills
Research and Administration
Adrian Devitt Forfás
Conor Hand Wilton Park House
Caoimhe Gavin Wilton Place, Dublin 2
Tel: 01 607 3000
Email: [email protected]
Taoiseach’s Foreword
Since my government took up office in 2011, the economic and fiscal challenges confronting the country have been manifold. We have worked hard to restore Ireland’s fiscal sovereignty, to help people get back into employment and to ensure that enterprise can access the credit it requires to grow.
While jobs and growth have been our mantra, competitiveness has been at the heart of everything we do. Only by ensuring that Irish based firms can compete successfully here and abroad can we create the employment and wealth necessary to improve the lives of all of our citizens.
This commitment to addressing and improving Ireland’s competitiveness is evident in a range of actions contained in the most recent Action Plan for Jobs. Through in-depth engagement at Cabinet Committee level, a cross-departmental response has been developed to identify and address the competitiveness challenges facing enterprise. This benchmarking report is a key input into that process. The analysis it contains will help us to focus our discussions on those areas most in need of policy action.
While the path of economic recovery was always going to be a long and difficult one, we can take heart from the fact that we are going in the right direction. Our programme of fiscal consolidation is paying dividends, the labour market has returned to growth and Irish companies continue to
perform strongly in overseas markets.
And the international community has taken note of our efforts too. Our international reputation has been restored. Our traditional strengths remain – Ireland is a good place to do business, with a well-educated workforce, a responsive and responsible regulatory system, and a pro-enterprise
environment. Many of these factors are reflected in Ireland’s improved performance in the various international competitiveness rankings – for example, in the IMD’s World Competitiveness Yearbook
we have improved from 24th position in 2011 to 15th this year. Our journey, however, is not yet
complete. If Ireland is to really become the best small country in the world in which to do business, we must continue to tackle those factors which impact negatively on our competitiveness.
The National Competitiveness Council has highlighted five key areas for our attention – maintaining our fiscal probity; embedding skills and tackling structural unemployment; improving credit flows to enterprise; developing and broadening our base of firms; and relentlessly pursuing cost
competitiveness. The cross-cutting nature of these areas emphasises the whole-of-Government response that is required.
In reiterating my Government’s commitment to take the necessary action to improve Ireland’s competitiveness, I would like to thank the Council for producing this highly valuable report which provides a solid analytical foundation for competitiveness policy development and delivery.
Chairman’s Preface
Ireland Cannot Ignore Lessons from History: Address Weaknesses Today to Protect Competitiveness and Jobs Tomorrow
When the Council last published a benchmarking report in 2012 there were tentative indications that the Irish economy was emerging from the
economic difficulties of the previous few years. Encouragingly, many of the
indicators in this year’s Competitiveness Scorecard point toward a further
strengthening of Ireland’s position during 2013. Improvement is most notable, for example, in our improved labour market performance and the downward trend in unemployment; our continued success in export markets; and the welcome but modest increase in consumer demand – the first such increase in several years.
These factors combined with the restoration of the State’s borrowing capacity on financial markets and our improving fiscal situation provide for a degree of comfort as we look to the future. They also speak of a job well done (if not yet complete) in terms of renewing Ireland’s competitiveness and putting us on a sound footing for growth. Indeed, this sense of opportunity is reinforced by the generally positive global economic outlook, particularly among the world’s most advanced
economies that represent Ireland’s most important trading partners.
Ultimately, Ireland’s economic and social progress depends on the ability of our exporting enterprises. It is essential, therefore, that we maintain our traditional strengths (for example, in areas such as the attraction of foreign direct investment and domestic sectors such as agri-food) whilst simultaneously addressing areas of concern including the increasing cost of doing business. The Scorecard focuses attention on those areas of performance most susceptible to policy action. This year, based on a comprehensive analysis of 120 indicators, the National Competitiveness Council has identified five challenges which must be addressed if we are to enhance Ireland’s international competitiveness performance.
Firstly, at the macro-economic level, we must continue our hitherto successful programme of fiscal consolidation. In the absence of stable, healthy public finances competitiveness suffers,
productivity enhancing investment is delayed, investor confidence is damaged and capital markets are adversely affected. The commentary around a country’s macroeconomic performance also shapes perceptions and reputations. A sound fiscal base, therefore, is a prerequisite if Ireland is to be viewed internationally as good place in which to do business. We need to guard against a tendency to be complacent about the public finances notwithstanding the considerable successes achieved to date in implementing corrective actions. Our public debt levels continue to be
essential part of enhancing the international view of Ireland as an ideal location in which to invest in high tech sectors with a plentiful supply of high skilled workers.
Thirdly, Ireland’s enterprise base must continue to evolve. While the resilience of our exporting sector has been one of the economy’s greatest strengths since the onset of the recession, this does not obviate the need to develop a more sustainable, broad-based enterprise base. The challenge is to grow new sectors, expand into new markets and produce new products. This will require an enterprise environment that supports continued foreign investment and increases the export capacity of indigenous firms. Greater integration of Irish firms into global value chains, enhanced levels of entrepreneurship and productivity as well as mechanisms to facilitate greater investment in early stage ventures will all be key elements in any strategy to grow the enterprise base. Fourthly, notwithstanding recent improvements, the whole area of credit for enterprise requires further attention. While demand for credit has remained sluggish in Ireland, limited access to credit, and the associated high costs, is acting as a drag on the enterprise sector, inhibiting investment and growth, particularly amongst start-ups and SMEs. Limited credit flows in the
economy damage the environment for entrepreneurship and limit the scope of firms to expand their operations. New and expanding firms are the primary employment creators in the economy and are major generators of revenue for the State. They are also key drivers of productivity and are
important sources of technological and process innovation. Through spillovers, these innovations ultimately benefit the wider economy. A number of initiatives that aim to address these issues are in place such as Microfinance Ireland and the Seed Capital Scheme, while further actions are scheduled to be launched shortly. The need to monitor the uptake and effectiveness of these schemes, and identify further areas for action if required should remain an ongoing part of the agenda of Irish policymakers.
Finally, the Council is once again highlighting the need for vigilance with regard to cost
competitiveness. A range of indicators suggest Ireland has already begun to slip in terms of our relative cost competitiveness, following a period of improvement during the recession (e.g. recent increases in labour costs, energy, business services, health, education and other public service costs, and house prices). There is a risk that a lack of corrective action now will result in lost cost competitiveness.
To reap the benefits of the nascent recovery, we must remain vigorous and alert in our drive to enhance Ireland’s international competitiveness. While many of the indicators benchmarked in this report suggest that we are once again moving in the right direction, we cannot afford to ignore the lessons from previous mistakes. A return to economic growth in the present should not blind us to the longer term challenges which persist and which are highlighted throughout this report. Failure to address similar constraints and to heed warning signs during the last decade directly contributed to Ireland’s recent economic difficulties. Only through the vigilant monitoring of all aspects of Ireland’s competitiveness performance, can we develop the policy responses necessary to safeguard Ireland’s economic wellbeing.
I would like to conclude by thanking the Council members and advisers and to recognise their valuable contributions throughout the development of this report. I would also like to acknowledge the invaluable work of Forfás staff members in preparing this report.
Dr Don Thornhill
Table of Contents
1. Overview of Ireland’s Competitiveness 10
International Competitiveness Comparisons 10
Overview of Ireland’s Competitiveness: Sustainable Growth 12
The long awaited return to growth 12
The impact of the recession on quality of life and the environment 14
Business Performance – Encouraging signs but embedded vulnerabilities remain 14
A trading economy 15
Productivity Growth - A prerequisite for employment creation and sustainable growth 16
Prices and Costs – A turning point for the economy’s competitiveness 17
Employment and Labour Supply – Avoiding structural unemployment 18
Business Environment - Key Messages 19
Taxation – Traditional strengths facing increased competition 19
Finance for Business – Creating affordable credit flows 20
Making it easier to do business 20
Physical infrastructure – the building blocks of a dynamic economy 21
Knowledge infrastructure – embedding skills to support enterprise and enhance employability 21
Research, Development and Innovation – Investing in our future 22
Ireland’s competitiveness performance – the policy challenges 23
2. Methodology 26
2.1 How to read this report 26
3. Sustainable Growth 30
3.1 Macroeconomic Sustainability 31
3.2 Quality of Life 35
3.3 Environmental Sustainability 37
4. Essential Conditions 42
4.1 Business Performance 43
4.2 Productivity 50
4.3 Prices and Costs 52
4.4 Employment and Labour Supply 61
5. Policy Inputs 70
5.1 Business Environment 71
5.2 Physical and Economic Infrastructure 83
5.3 Knowledge Infrastructure 87
Chapter 1
1.
Overview of Ireland’s Competitiveness
International Competitiveness Comparisons
Competitiveness is a complex concept incorporating a myriad of interlinked and interdependent factors. This is reflected in the fact that Ireland’s Competitiveness Scorecard analyses over 120 indicators. These indicators measure a range of inputs, outputs and outcomes. Given the disparate nature of these indicators, the National Competitiveness Council does not attempt to create a single quantifiable measure of competitiveness – rather, each indicator is examined individually.
Thereafter, taking a birds-eye view of all the data collected, the Council can draw the various straws of analysis together to present a comprehensive picture of Ireland’s international competitiveness performance.
[image:11.729.100.421.452.652.2]There are, however, a range of international bodies operating in the competitiveness space that do attempt to measure and condense all of the complexity of competitiveness into a single metric or ranking. While methodologies differ, they can provide a useful insight into how external observers view Irish performance vis-à-vis our key trading partners and competitors. Figure 1.1 presents Ireland’s ranking from amongst the 32 OECD member states (excluding Mexico and Turkey) across a range of international indices, while Figure 1.2 examines how Ireland’s ranking has evolved in recent years in three of the most high profile and competitiveness-relevant indices. In Figure 1.1 a ranking of 1 (i.e. close to the centre of the chart) implies that Ireland is deemed to be the most competitive in the OECD.
Figure 1.1: Overview of Ireland’s international competitiveness rankings amongst the OECD
These indices cover a number of policy areas – some based on directly measureable aspects of policy (e.g. the World Bank Doing Business Index); others measure softer, more subjective issues such as
reputation; indices such as the IMD and WEF competitiveness indices capture a mixture of both. In general, Ireland is a mid-table performer across all of the
indicators. Only in the UN’s Human
Development Index does Ireland break into the top tier of performers.
As shown in later sections, Ireland’s macroeconomic performance declined markedly with the collapse of our property bubble and the onset of the global financial crisis and ensuing international recession. From the unparalleled highs of the Celtic Tiger era to the large scale unemployment and growing debt burden of the recession, the Irish economy has endured massive fluctuations. These
20
17
10 11 14
12 7
0 5 10 15 20 25 30 35
WEF Global Competitiveness Report
(2014)
Transparency International, Corruption
Perception Index (2013)
IMD World Competitiveness Yearbook (2014)
World Bank Doing Business (2013) FDI Regulatory
Restrictiveness Index (2013) Reputation Institute Country Index (2013)
macroeconomic weaknesses have had a significant impact upon Ireland’s standing in several international competitiveness rankings.
Figure 1.2: Ireland’s international competitiveness rankings: Change in global rankings, 1997-2014
All three indices included in Figure 1.2 illustrate the impact of the recession on Ireland’s international ranking – reflecting in the case of both the IMD and WEF the importance attached to outcomes-focused macroeconomic indicators. Over the last two years, however, Ireland’s performance has improved.
While these rankings are interesting and useful overviews of competitiveness, as noted, they can provide an over-simplified view of competitiveness – one that can miss the subtleties which appear from a closer examination of the various components of competitiveness.
The remainder of this chapter, therefore, builds on the Council’s Competitiveness Pyramid (Figure 1.3) to analyse the various factors that combine to determine a country’s competitiveness. Chapters 3, 4 and 5 examine the individual competitiveness indicators.
28 15 1
6
11
16
21
26
31
36
19
97
19
98
19
99
20
00
20
01
20
02
20
03
20
04
20
05
20
06
20
07
20
08
20
09
20
10
20
11
20
12
20
13
20
14
Le
ss
c
om
pe
tit
iv
e
Ran
kin
g
Mor
e c
om
pe
tit
iv
e
IMD WEF World Bank
Overview of Ireland’s Competitiveness: Sustainable Growth
The indicators measured under the “sustainable growth” reflect the impact of policies targeting a range of policy inputs affecting the business environment, the stock of physical infrastructure and the supply of knowledge and human capital. These are also partially determined by the fluctuations of the international economy. Performance is also a reflection of the outcome on incomes and quality of life arising from a range of previous decisions across a host of policy areas.
The long awaited return to growth
1After an extended period of recession, the Irish economy is once again growing: In 2012, eurostat data shows that GDP per capita grew by 1.9 per cent while GNP per capita grew by 3.5 per cent in PPP terms (Figure 3.2). The data for 2013 is somewhat mixed, with a slight decline (-0.4 per cent) recorded in GDP and a continued strong performance evident in GNP (3.3 per cent).
This data, allied to the restoration of the State’s borrowing capacity and improved public finance sustainability, the downward trend in unemployment (see section 4.4) and the continued strength of the export sector (section 4.1) provides a clear indication that the Irish economy is on a more positive trajectory than at any stage since the beginnings of the international downturn and bursting of the Irish property bubble.
Table 1: Overview of Forecasts for Ireland, 2013-2015
ESRI D/Finance Central Bank
2013 2014 2015 2013 2014 2015 2013 2014 2015
GDP -0.4% 2.6% 3.5% -0.3% 2.1% 2.7% -0.3% 2.0% 3.2%
GNP 3.3% 3.5% 3.7% 3.4% 2.7% 2.3% 3.4% 2.7% 2.6%
Exports 0.1% 3.7% 4.0% 0.2% 2.1% 3.2% 0.1% 3.0% 5.0%
Unemployment 13.1% 11.4% 10.1% 13.0% 11.5% 10.5% 13.1% 11.3% 10.4%
Source: ESRI, Quarterly Economic Commentary, Spring 2014; Department of Finance, Ireland’s Stability Programme Update, April 2014; Central Bank of Ireland, Quarterly Bulletin, Q2 2014
Further, growth is becoming more balanced – whereas in recent years, net exports was the only positive contributor to growth, 2013 saw a resumption in consumer demand, whilst government investment held constant (Figure 3.3). The elimination of the current account deficit (Figure 3.4) also illustrates the progress made in rebalancing the economy, even though this is partly due to depressed imports and the size of the 2012 external surplus reported being exaggerated by the re-domiciling of some foreign companies to Ireland.
engines of global growth. According to the IMF, growth in the euro area is expected to turn positive (particularly in Germany), driven primarily by supportive monetary policy conditions, reductions in the pace of fiscal tightening and an improved contribution from net exports. Restrictive credit conditions and the high corporate debt burden, however, will continue to act as a drag on growth. The US is expected to perform strongly in 2014, aided by a recovery in the domestic real estate market. In the UK, growth of almost 3 per cent is forecast for 2014. Overall, as an extremely open and trade-dependent economy (section 4.1), the health of the Irish economy is heavily determined by the performance of the wider global economic environment, and particularly by the strength of UK and US demand.
Table 2: European Commission GDP Forecasts
2013 2014 2015
Global 3.0% 3.6% 3.9%
Advanced economies 1.3% 2.2% 2.3%
Euro area -0.5% 1.2% 1.5%
US 1.9% 2.8% 3.0%
Emerging and developed economies
4.7% 4.9% 5.3%
Source: IMF, World Economic Outlook, April 2014
Despite the positive signs, however, concerns persist and the Irish economy remains fragile. First and foremost, the economy remains beset by a heavy debt burden. While significant improvements have been achieved in the public finances, a deficit of 7.2 per cent of GDP was recorded in 2013 (Figure 5.1). This is forecast to reduce further to 4.8 per cent of GDP in 2014. In 2014 in Exchequer terms, a primary deficit of about €1 billion is forecast, while in General Government terms, a
primary deficit of €75 million is forecast2. The General Government balance is forecast to return to
surplus in 20153.
Nevertheless, general government debt remains amongst the highest in both the euro area and OECD (Figure 3.5). At 124 per cent of GDP in 2013, the European Commission believe that debt has peaked and a small reduction is expected in 2014. The high levels of non-financial corporation (business debt) and household debt pose a two-fold risk to the economy (Figures 3.7 and 3.8); as well as dampening both consumption and investment, there is a risk that further bank capitalisation will be required if SME and household arrears are to be comprehensively addressed – as illustrated in Figure 5.16, Ireland has the second highest “non-performing loan” (NPL) ratio in the OECD.
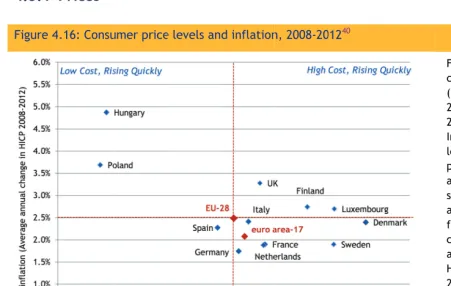
As will be discussed in greater detail in section 4.3, threats are also emerging in relation to the enterprise cost base. Despite recent cost improvements, Ireland remains a high cost location for a number of key business inputs (Figure 4.16). The economy is now at a turning point in terms of cost competitiveness, with overall relative cost competitiveness disimproving and a series of upward cost pressures emerging (Figure 4.18).
Finally, the labour market – despite the continuing reduction in unemployment – poses serious challenges with the ongoing risk that cyclical unemployment will evolve into structural
The impact of the recession on quality of life and the environment
Ultimately, efforts to enhance competitiveness aim at delivering an improved environment for enterprise so that incomes increase and the quality of life improves for all of the country’s residents. The quality of life measures included herein, therefore, complement more traditional measures of GDP.
Despite the severity of the recession, Ireland´s strong welfare system has cushioned the impact of poverty to a degree. The proportion of people at risk of poverty after social transfers actually fell between 2007 and 2011 (Figure 3.10). Different family types have experienced contrasting fortunes – while the proportion of households with two employed adults being classified as at-risk-of poverty has declined in Ireland, the proportion of at-risk-of poverty single employed people has increased. Such relative measures of poverty, however, can mask the real impact of the recession – according to the OECD, while relative poverty did not increase in Ireland, “anchored” poverty increased between 2007 and 2010, reflecting reductions in disposable income amongst poorer households (i.e. anchored poverty measures poverty against a benchmark “anchored” to half the median real incomes observed in 2005 - keeping constant the value of the 2005 poverty line). In Ireland,
households with youths aged between 18 and 25 years of age have been most adversely affected by the recession. In contrast, those aged over 65 have on average suffered the least impact in terms of increased poverty.
Looking at the impact of these developments on society, Ireland continues to perform well in terms of social cohesion (Figure 3.11) and in measures of life satisfaction (Figure 3.12).
The quality of a natural environment and the commitment to environmentally sustainable policies is a key determinant of quality of life. In this regard, Ireland has made some progress in decoupling its environmental footprint from economic growth – although per capita CO2 emissions are still amongst the highest in the OECD (Figure 3.15). While the share of renewable energy production has grown (albeit from a low base), Ireland remains heavily dependent on oil (48%) to meet its energy
consumption needs. Green energy (hydroelectric and renewables) accounted for 10 per cent of Irish energy consumption in 2012 compared to 16 per cent for the OECD-27 average, reflecting our high dependence on imported fossil fuels and very limited hydro potential. Waste generation per capita
is amongst the highest in the OECD and there is a high reliance on landfills (Figure 3.17)4.
Business Performance – Encouraging signs but embedded vulnerabilities remain
The performance of the business sector is critical to growing incomes and employment levels in Ireland. It also plays a crucial role in determining the stability of government finances and is a major source of government revenue – essential if the State is to continue to fund public services. Business performance is assessed under the themes of investment and trade.
Foreign Direct Investment has been a primary driver of Ireland’s productivity and innovation performance for several decades, as well as a source of employment. As such, Ireland’s
attractiveness for FDI is closely related to its international competitiveness. Ireland continues to be an attractive location for foreign direct investment (FDI), and in terms of both FDI stock (Figure 4.2) and return on investment (Figure 4.3) we rank among the top three performers in the OECD. While some of the advantages that allowed Ireland to win initial investments from abroad during the 1980s and 1990s have been eroded (i.e. we are no longer a low cost location), many advantages remain. As noted throughout this report, it is vital that corrective action is taken where required to ensure that Ireland’s business environment remains attractive to investors; issues of particular importance to the FDI sector include the development of the national innovation system; increasing the supply of highly educated workers; and successfully leveraging the agglomeration benefits offered by
already established clusters5. Our ability to overcome challenges to Ireland’s competitiveness in
key areas such as business costs (including labour and energy costs etc.) and corporate tax structures (i.e. maintaining international competitiveness in relation to our corporate rate,
reputation and regime through, for example, continued proactive engagement with the OECD’s Base Erosion and Profit Shifting (BEPS) project) will also be crucial in enabling us to sustain and build upon the successful FDI performance to date. Ultimately, Ireland’s attractiveness to investors (both foreign and indigenous) is shaped by a combination of factors which determine the environment for enterprise and our international competitiveness.
From a regulatory perspective, Ireland performs well in the OECD’s FDI Regulatory Restrictiveness Index and is ranked 14th out of 32 countries (Figure 1.1). Based on the most recent data, the
primary FDI restrictions in Ireland relate to equity restrictions6. However, as a significant proportion
of Irish service exports are generated via Irish firms establishing foreign affiliates, the regulatory restrictiveness of other countries directly impacts upon the ability of such firms to pursue this business model. This highlights the importance to Irish enterprises of initiatives such as the EU-US Transatlantic Trade and Investment Partnership and other EU trade and investment negotiations. At first glance Ireland’s recent performance with regard to outward direct investment looks healthy, with stock levels as a percentage of GDP tripling in the five years to 2012 (Figure 4.4). However, a significant proportion of this growth can be accounted for by an increase in the number of corporate
inversions to Ireland, as foreign-owned firms are redomiciled here7. As the recovery continues, it
will be important that Irish-based firms expand their global footprint through material investment abroad in order to realise growth opportunities.
A trading economy
For a small open economy like Ireland, generating export-led growth is the only sustainable strategy to secure long term growth and prosperity. Our ability to export successfully represents one of the key indicators of competitiveness. At the same time, the growth in trade which accrues through strong international competitiveness offers the opportunity to expand our enterprise base and grow incomes on a sustainable basis.
In the face of difficult global market conditions, Ireland’s overall trade performance has remained largely positive since the recession, although a number of structural weaknesses need to be addressed to ensure sustainable longer-term competitiveness.
expansion into new markets and a deepening of trade links with the world’s leading developing economies is required, again with sustainability in mind (Figure 4.7).
Ireland’s share of world markets is a key measure of our international competitiveness and while Ireland has been successful in expanding its share of the world’s services market, it is of concern to the Council that our share of the global merchandise market (and consequently our share of total world trade) has decreased (Figure 4.8). Some of this decline can be attributed to the one-off
impact of the patent cliff8.
The concentration of our exports in a small number of sectors (Figure 4.10) and the domination of foreign-owned firms in Ireland’s trading activities (Figure 4.11) creates additional vulnerabilities in our trading profile. FDI is largely responsible for Ireland’s high participation in global value chains (Figure 4.13), and despite some impressive successes in the agri-food sector, domestic inputs to third country exports remain well below the OECD average, reducing the positive spill-overs into the economy. Developing greater linkages between domestic firms and multinationals based here, as well as increasing trade from domestic firms to foreign markets, is dependent on the ability of Irish-owned firms to enhance their competitiveness and outperform rival firms from overseas.
Productivity Growth - A prerequisite for employment creation and sustainable
growth
In the long run, an economy’s productivity performance is the ultimate determinant of success. In a time of austerity and reduced demand, productivity offers significant potential to enhance
competitiveness and living standards as it allows for sustainable pay increases without eroding cost competitiveness.
While Irish productivity levels improved considerably between 2008 and 2013 (Figure 4.14), previous NCC analysis showed that much of Ireland’s performance during this period arose from changes in the composition of employment in Ireland during the recession (for example a collapse in the numbers employed in the labour intensive construction sector), rather than broad based
productivity growth9. While it is encouraging to note that Ireland is one of the few benchmarked
countries to demonstrate positive total-factor productivity since 2010 (a measure of an economy’s long term technological dynamism) (Figure 4.15), tackling barriers to investment in high growth sectors is vital to support real and sustainable productivity growth leading to increased
employment.
The ramping up of world trade as we emerge from the global economic crisis presents the potential for Ireland’s productivity performance to be boosted by the increased competition and the diffusion of technology and skills. However, a range of domestic challenges remain to be tackled to ensure Ireland can achieve its productivity potential, for example enhancing the weak growth levels in net capital stock (Figure 5.24) particularly with regard to investment in machinery and equipment (Figure 5.25). It is encouraging to note that the ESRI has forecast a 2.5 per cent increase in the
volume of machinery and equipment investment for 201410. Since 2008, Ireland has seen a large
The productivity of the labour force could also be boosted by improving Ireland’s performance with regard to lifelong learning (Figure 5.45) and the maths and reading proficiency of the adult
population (Figure 5.46).
Prices and Costs – A turning point for the economy’s competitiveness
While in the long run, productivity performance determines success, cost performance plays an important role in determining a country’s ability to compete in international markets. A high cost environment weakens competitiveness in a number of ways – making Ireland less attractive in terms of foreign direct investment; making firms which rely on domestically sourced inputs less
competitive when they are selling into foreign markets; and adversely impacting upon the cost of living with knock-on implications for wage demands. For this reason, the Council has given significant consideration to cost competitiveness in its annual Costs of Doing Business reports. Ireland’s cost base has improved across a range of metrics over the last number of years making Irish firms more competitive internationally and making Ireland a more attractive location for firms to base their operations. Particularly strong medium-term cost improvements are evident in the property sector (office rents) for example (Figure 4.25). However, despite low levels of inflation in recent years, Ireland remains a high cost location (Figure 4.16).
Despite the positive trend since the beginning of the recession, analysis from the Council earlier this
year noted that the economy is now at turning point in terms of cost competitiveness11. The latest
data shows that overall relative cost competitiveness has begun to disimprove and a series of upward cost pressures are emerging: the harmonised competitiveness indicators show that Ireland’s relative cost competitiveness is now deteriorating vis-à-vis our main competitors (Figure 4.18); labour costs are rising again following a number of years decline – wage growth can boost domestic demand; from a competitiveness perspective, it is vital, however, that such growth is underpinned by productivity improvements (Figure 4.20); industrial electricity prices are above the euro area average and have increased since the global increase in gas prices from 2010 and the ending of the
rebate for large energy users (Figure 4.27)12; and an upward trend is evident across a range of
business service costs (Figure 4.30).
Employment and Labour Supply – Avoiding structural unemployment
Ireland’s labour market evolution closely mirrors the evolution of the economy. Following an unprecedented expansion in both the labour force and in employment (and a parallel decline in unemployment), Ireland is once again confronted by large scale unemployment, long term unemployment, emigration and a host of related labour market challenges.
Following an extended period of rising unemployment, by mid-2012 the early signs of a recovery in employment were apparent. In 2013, this recovery ramped up with an annual increase of 3.3 per cent in the number in employment (Figure 4.33). As a result of strong employment growth,
increased emigration (Figure 4.46) and a decrease in labour market participation (Figure 4.40), the numbers unemployed have decreased by 22.9 per cent since the unemployment peak in Q3 2011. While the turnaround in employment trends is welcome, the high rate of long term unemployed (Figure 4.33) remains a significant challenge: as well as the risk of deskilling the individual (which can occur as a result of disengagement from the labour market), and the cost to the State of income maintenance, long term unemployment damages competitiveness in other ways, reducing the growth potential of the economy, damaging consumer confidence and resulting in a lower level of consumer demand. At the same time, however, the increased availability of labour – and more specifically the availability of skilled labour, combined with lower churn rates – can represent a competitive advantage.
The need to alleviate long term unemployment was noted by the OECD in its review of the Action Plan for Jobs. Having noted significant successes to date in achieving employment targets, the
review warned that “unless more is done to help the long-term unemployed find jobs …there is a
risk that some of the cyclical increase in unemployment may become structural”13. While the Irish
exchequer spends a significant amount on labour market programmes compared to the OECD average, expenditure on active labour market programmes remains low by international standards – the majority of Irish expenditure is related to passive programmes such as income maintenance (Figure 4.45). The OECD also highlighted the high rate of youth unemployment as a cause for concern. Unemployment amongst 15-24 year olds stood at 26.8 per cent in 2013, double the level in 2008 (Figure 4.36). Among the unemployed youth population, 43.8 per cent are considered long term unemployed (i.e. unemployed for more than one year). The cohort of young people not in employment, education or training (NEET) is also notably high in Ireland (16.7%) compared to the OECD average of 11.8 per cent (Figure 4.37).
Labour market participation rates have also declined from a peak of 64 per cent in 2007 to 60.4 per cent in 2013 (Figure 4.39). This reflects greater labour market inactivity. While the female
rate than prior to the recession, reflects a combination of a shortage of appropriate skills to meet labour market needs in specific areas (Figure 4.38) and also inadequate work incentives in some sectors of the economy, despite the high rate of unemployment.
Social welfare policies impact on labour demand and supply and if poorly designed can weaken incentives to work. It is important that appropriate incentives exist to encourage participation in the labour market. While most Irish replacement rates are structured to incentivise the take-up of employment opportunities, replacement rates for the long-term unemployed in Ireland (i.e. including housing benefits) are significantly higher than the OECD average for both single earners and married couples with children (Figure 4.42). Figure 4.44 examines the implicit tax on returning to work. Ireland performs well in terms of the additional cost of social contributions, income tax and the decrease in benefits which result from a previously unemployed individual commencing employment. The cost of childcare, however, is a significant additional cost where it applies, and acts as a major disincentive in Ireland. This is reflected in Figure 4.43 which shows that childcare costs in Ireland are among the highest in the OECD. High childcare costs are a particular disincentive to work for lone parents.
Business Environment - Key Messages
The inputs (the bottom row of the competitiveness pyramid) represent the foundation stones of the economy and are the primary drivers of competitiveness. The NCC believes that it is within these particular areas that policymakers can have the greatest impact on competitiveness.
Taxation – Traditional strengths facing increased competition
Ireland has traditionally espoused a pro-enterprise approach towards taxation. Based on competitive tax rates and long-standing policy certainty and stability, Ireland remains an attractive location from which to do business.
Overall, State revenue and expenditure levels in Ireland are lower than the euro area average (Figure 5.1). The State, however, collects a higher proportion of its tax revenue through direct taxation (43.4%) than the euro area average of 30.5 per cent (Figure 5.2). The percentage of revenue raised through direct taxation in Ireland has also increased over the course of the recession (from approximately 37 per cent in 2008). In part this is a reflection of the reduction in receipts from indirect taxation as a result of the property collapse.
Looking at the types of taxes levied in Ireland, income tax and VAT continue to be the primary sources of Government revenue (Figure 5.3). Looking in more detail at income tax, it is clear that while Ireland remains competitive, marginal and average income tax rates have increased since 2008 (Figures 5.6-5.8). Such developments have adverse impacts upon labour market participation and damage Ireland’s attractiveness to internationally mobile high skilled workers.
Finance for Business – Creating affordable credit flows
The supply of credit is a critical determinant of the enterprise sectors ability to operate successfully and expand. Significant challenges persist in this space. On the supply side, funding conditions for the State and the banks have improved, benefitting from international developments. The
availability and cost of credit for enterprise, however, continues to be a cause for concern (Figures 5.11, 5.17 and 5.18). Loan rejection rates are also high (Figure 5.15). Further, two thirds of new SME lending is just rollover of existing loans.
On the other side of the equation, demand for credit in Ireland remains among the lowest in the euro area (Figure 5.14). While 57 per cent of Irish firms did not apply for finance because they have sufficient funds, 13 per cent of firms did not submit an application for fear of rejection, compared
with an EU average of just six per cent14.
There is also a sense that many issues in relation to credit remain unresolved with potentially serious implications for the SME sector of any attempted clean-up of the banks’ loan books. Ireland has the second highest Non-Performing Loan (NPL) ratio in the OECD which is undoubtedly hindering the return of banks to health (Figure 5.16) – raising the cost of market funding and draining
resources that could be used for new lending. Mortgage loans are a large part of the NPL problem – according to the IMF, 41 per cent of non-performing loans in Ireland relate to commercial real
estate loans, 34 per cent to mortgages and 19 per cent to business and SME loans15.
Making it easier to do business
A competitive product market environment that allows new firms to challenge incumbents, efficient firms to grow, and inefficient ones to exit, can help boost economic growth and living standards. In order to minimise costs and to ensure that Irish-based firms are in the best possible position to compete with international competitors, it is necessary to ensure that the regulatory environment does not impose unnecessary regulatory burdens. In parallel, however, sound corporate governance practices are required to support sustainable growth.
While Ireland has a strong international reputation as a good place in which to do business, there are a number of areas where performance could be improved. Overall, Ireland is a mid-table performer in terms of the World Bank’s Doing Business index – ranked 11th out of 32 OECD countries
(Figure 5.19)16. The index includes a range of measures where Ireland’s performance is particularly
good – for example, we are ranked 1st in terms of paying taxes; 3rd in relation to protecting
investors; 4th in terms of the ease of starting a business. On the other hand, performance is weak in relation to dealing with construction permits (30th in the OECD 32), getting electricity (27th), enforcing contracts (26th), and registering property (21st). While the World Bank report has been used by many Governments to promote and measure reform – mostly aimed at enhancing economic competitiveness – it also influences international perceptions about investment locations.
Based on OECD statistics, Ireland is also ranked mid-table in relation to product market regulation (Figure 5.20). Elements of Ireland’s environment for entrepreneurship are weak – particularly in terms of the complexity of regulatory procedures associated with start-up companies (Figure 5.22). This is a significant issue given the vital role that start-up firms play in terms of employment creation. The cost of insolvency, although not picked up directly in the data, is also a common concern expressed by firms.
is ranked 11th out of 29 OECD countries; in relation to the legal profession, Ireland is ranked 23rd. The poor performance with regard to the restrictiveness of the legal profession reflects a range of poor scores across indicators measuring “inter-professional cooperation”, “compulsory chamber membership” and “regulations of the form of business”. Many of these regulatory barriers arise as a result of the current system of self-regulation rather than from regulations imposed by the State.
Physical infrastructure – the building blocks of a dynamic economy
Infrastructure quality directly impacts on the ability of enterprises to conduct their business. Inadequate or inefficient infrastructure adds to costs, creates delays and generally makes it more difficult to conduct business, undermining the competitiveness of firms and ultimately the
competitiveness of the economy. Irish public investment levels have dramatically between 2008 and 2013, falling from 5.3 per cent of GNP to 1.8 per cent of GDP (Figure 4.1). This shows both the high level of Government investment pre-crisis and the scale of the cutbacks – by comparison euro area gross fixed capital formation fell from 2.6 per cent to 2.1 per cent over the same period.
Government investment in capital programmes is likely to continue to be restricted by ongoing fiscal challenges for the foreseeable future. This is a particular challenge given Ireland’s low scores in relation to the perception of overall infrastructure quality (Figure 5.27) and the need to continue to
investment in essential infrastructures such as broadband17 (Figure 5.31) and water, and to maintain
and develop infrastructure already in place (e.g. roads).
Knowledge infrastructure – embedding skills to support enterprise and enhance
employability
Ireland’s education system has been a key contributor to economic growth and improvements in living standards in recent years and the quality of education outcomes remains central to national competitiveness.
Overall, the data on Ireland’s education performance are positive and improving – attainment levels, particularly amongst younger cohorts are rising, with above average proportions attaining third level education (Figure 5.33). Graduation rate at upper secondary level have also improved over recent years (Figure 5.37), resulting in a lower proportion of early school leavers amongst 18 to 24 year olds (Figure 5.38).
On the downside, while both primary (Figure 5.36) and secondary (Figure 5.42) school students clock up relatively long days in the classroom, less time is dedicated to key subjects such as mathematics and science than is the norm across the OECD. Likewise, Irish secondary school students spend less time studying modern foreign languages than the OECD average (10 per cent of total compulsory hours in Ireland compared with 14 per cent in the OECD). Given the importance of foreign language skills, this is a cause for concern – a recent report from the Expert Group on Future Skills Needs noted that language skills are a prerequisite requirement to fill a large share of current vacancies. The report noted the “importance of foreign languages as an integral part of the skills portfolio of candidates across a range of occupational groups in areas such as business analysts, technical support engineers, fraud analysts, sales, customer service/sales administration and credit
control”18.
that few students in Ireland are achieving mathematics scores in the top two levels in the PISA
tests19.
Irish scores are slightly lower than the OECD average in relation to the problem solving abilities of students – this in an important new measurement conducted by PISA: changes in society and the workplace mean that the content of applicable knowledge evolves rapidly; adapting, learning, daring to try out new things and always being ready (and able) to learn are among the keys to future success (Figure 5.41).
Looking at the third level system, in 2010, Irish third level funding was on a par or exceeded many of our peers (Figure 5.34). Since this data was collated by the OECD, however, funding in Ireland has fallen over the course of the recession – total current expenditure on higher education by the State has fallen from approximately €1,887 million in 2008 to an estimated €1,449 million in 2014. The student contribution has risen rapidly in recent years and will reach around €3,000 by 2015. Moving beyond the formal education system, it is clear that many challenges remain. Participation in lifelong learning remains low (Figure 5.46) and this poses a particular problem given the need to tackle embedded structural unemployment. Specific issues in this regard include the need to retrain former construction workers, many of whom are young and who are unlikely to find future
employment in a more knowledge-intensive economy. As discussed in Chapter 4, while levels of expenditure on labour market programmes in Ireland are high, much of this relates to passive income maintenance schemes and some of the spending on active measures, such as Community employment, has had little effect in helping participants to re-enter the labour market (Figure 4.45).
Assessments of the competency of adults in terms of literacy and numeracy highlight the importance of embedding these essential basic skills across all cohorts of the adult population - the OECD’s Programme for the International Assessment of Adult Competencies finds that overall Irish adults were slightly below the survey average in terms of literacy (Figure 5.47). In terms of numeracy, Ireland’s performance is also below average, while the proportion of Irish adults deemed to have lower (i.e. weak) problem solving skills was broadly in line with the international average (although the number of adults scoring at higher levels in these skills was below average).
Research, Development and Innovation – Investing in our future
Over the course of the last decade or so, Ireland’s commitment to research, development and innovation has expanded significantly, both in terms of the level of investment (Figure 5.48) and the human resources engaged in R&D activity (Figure 5.49). Relative to the business and higher
education sectors, direct government expenditure on R&D remains relatively low.
While Ireland has made good progress towards building up its scientific capabilities, innovation capacity remains weaker than in leading small advanced OECD countries, Denmark, Sweden and Switzerland (Figure 5.54). Innovation levels tend to be higher in industrial sectors than service sectors (Figure 5.55) and previous results from the Community Innovation Survey show that
innovation is more concentrated in larger firms20. Perhaps not unsurprisingly, multinational firms
has grown over time, as in other countries, but remains in the lower half of the 18 OECD countries for which data are available (Figure 5.56).
Ireland’s competitiveness performance – the policy challenges
Despite (or indeed as a result of) the challenges which have beset the Irish economy over recent years, international competitiveness has improved. As evidenced through trade and investment flows, Ireland remains open for business and indeed, offers an attractive location from which to do business. Costs have been reduced and a number of structural reforms introduced. Many of the competitiveness gains achieved in recent years, however, have arisen as a result of cyclical factors. These gains could be quickly eroded as economic conditions improve – this risks a repeat of the Irish experience in the mid-2000s when much of Ireland’s international competitiveness was quickly eroded by the impact of rapid (unsustainable) economic growth.
It is important that we do not become complacent about the need for continued reform and that we focus our efforts on improving competitiveness in areas that are subject to domestic policy control. The key findings from this report highlight the range of challenges which are either outstanding or will require further work. These include:
Continued steady fiscal consolidation: The fiscal deficit is still high and public debt will remain elevated for the foreseeable future. Further consolidation is needed in coming years to put debt firmly on a declining path, to ensure public funds are spent in a productive and efficient manner and to safeguard Ireland’s return to market financing. Stable and sustainable public finances are a prerequisite for competitiveness: high deficits limit the scope for growth and productivity enhancing investments, have adverse impacts on consumer and investor confidence. Fiscal consolidation is supported by growing the economy and by managing debt levels – this is a challenging balance in the short term between downward fiscal adjustments and supporting recovery in domestic demand;
Supplying essential skills to enterprise and reducing unemployment: Taking action to address high levels of unemployment (particularly structural unemployment amongst particular cohorts where it exists) must remain a priority. Falling participation rates and high levels of outward migration reduce labour supply, while continuing high levels of inward migration indicate that there are issues either in relation to the supply of skills available in Ireland, or in relation to the incentives to take up employment. In order to address these challenges, the return on
exchequer spending on labour market programmes must be maximised, equipping individuals with marketable and employable skills. In this regard, it is also vital that welfare traps are eliminated to the extent possible and that employment is made as attractive an option as possible – marginal tax rates play a key role here. Likewise, as a primary driver of productivity and long term competitiveness, a focus on skills development across all levels of the education system must be a priority;
Developing a more sustainable enterprise base: A number of challenges remain to be addressed in order to create a stronger, more dynamic enterprise base. To ensure Ireland remains an attractive base for foreign direct investment, ongoing challenges to our
of small number of firms in niche sectors exporting to a narrow range of markets. In addition, we must ensure that business conditions here nurture greater entrepreneurship and investment. In this regard, actions that enhance the ease of doing business are important contributors to growth. Likewise it is vital that Ireland’s corporate governance and data protection regimes evolve – in particular ensuring that Ireland has a world class data protection regime will be a
key element in growing Ireland’s enterprise base in the area of big data and data analytics;
Enhancing access to finance: The twin factors of limited credit availability and the relatively high cost of credit where it is available are significant limiting factors on growth and
competitiveness. Addressing mortgage arrears and completing bank repairs is an essential element of ensuring that sufficient credit is available for enterprise investment. Such investment is absolutely necessary for firms to improve their productivity, expand their operations and ultimately grow the economy for the benefit of all;
Maintaining cost competitiveness: Against a backdrop of modest recovery, cost pressures are already emerging across a range of sectors. Particular focus is required to address domestically-influenced cost factors in the energy, legal and health sectors. Likewise, the current rapid increases in house prices and residential rents have the potential to produce adverse knock-on consequences in terms of prices and wage expectations across the entire economy. Such adverse cost developments put all of the recent hard-won cost competitiveness gains at risk.
Ireland’s Competitiveness Scorecard does not propose the answers to these challenges. Many of
these issues will be revisited in more detail in the Council’s annual policy document Ireland’s
Chapter 2
2.
Methodology
Competitiveness refers to the ability of firms to compete in markets. Ireland’s national
competitiveness refers to the ability of the enterprise base in Ireland to compete in international markets. The NCC uses a competitiveness pyramid to outline the framework within which it assesses Ireland’s competitiveness (Figure 2.1).
At the top of the pyramid is sustainable growth in living standards – the fruit of past
competitiveness success. Below this are the essential conditions for achieving competitiveness, including business performance (such as trade, investment, and business sophistication),
productivity, prices and costs and labour supply. These can be seen as the metrics of current competitiveness. Lastly, there are the policy inputs covering three pillars of future
competitiveness, namely the business environment (taxation, regulation, finance and social capital), physical infrastructure and knowledge infrastructure.
2.1 How to read this report
The rest of this report is divided into three main sections - sustainable growth (Chapter 3), essential conditions for competitiveness (Chapter 4) and policy inputs (Chapter 5) - which correspond to the segments of the competitiveness pyramid.
This report uses internationally comparable metrics, with the OECD, the EU, the UN, IMF and the WTO as the sources for the majority of indicators. Indicators from specialist international
competitiveness bodies (e.g. from the World Bank’s Doing Business report, the World Economic Forum’s Global Competitiveness Report and the Institute for Management Development’s World
Figure 2.1 The NCC Competitiveness Pyramid
Competitiveness Yearbook) are also used. Where further depth is of benefit, national sources such as Forfás, the Central Bank, the CSO, and the ESRI are used.
Subject to data availability, Ireland’s performance is benchmarked against 19 other countries. Countries have been chosen to provide a mix of euro area members (Finland, France, Germany, Italy, the Netherlands and Spain), other non-euro area European countries (Denmark, Sweden, Switzerland and the UK), and two newer EU member states (Hungary and Poland). Seven non-European countries which are global leaders or are of a similar size or pace of development to Ireland are also included. These countries are Brazil, China, Japan, South Korea, New Zealand, Singapore, and the US. This allows for a detailed comparison between Ireland and many of its closest trading partners and competitors. Ireland is also compared to a relevant peer group average
– either the OECD or the euro area average1.
Benchmarking competitiveness is useful - it informs the policymaking process and raises awareness of the importance of national competitiveness to Ireland’s wellbeing. Nonetheless, there are limitations to benchmarking:
While every effort is made to ensure the timeliness of the data, there is a natural lag in
collating comparable official statistics across countries. There are also factors that are difficult to benchmark (e.g. the benefit of being in the GMT time zone or of speaking English fluently);
Secondly, given the different historical contexts and economic, political and social goals of
various countries, and their differing physical geographies and resource endowments, it is not realistic or even desirable for any country to seek to outperform other countries on all measures of competitiveness. There are no generic strategies to achieve national competitiveness as countries face trade-offs; and
Finally, it is important to note that trade and investment between countries is not a zero-sum
game; economic advances by other countries can, in aggregate terms, lead to improvements in living standards for the Irish population.
2.2
Interpretation of the charts
We have endeavoured to ensure that all charts are self-explanatory. However, with reference to the sample chart that follows, the following points may be of value when interpreting the charts:
Figure 3.1: Gross domestic product at market prices, € per inhabitant, 201221
Despite the negative impact of the recession on the entire Irish economy, Ireland’s GDP per capita remains well above the euro area average. However when measured in terms of GNP per capita (i.e. with the impact of the foreign owned sector removed) Ireland ranks just marginally ahead of the euro area-17 average. Since their peak in 2007, both GDP and GDP per capita have declined by just under 20 per cent. Euro area-18 Ranking: GDP: 4th (↓2)
GNP: 8th (↓6)
Source: Eurostat
The majority of chart titles are given a traffic light colour, green, orange or red, in order to
provide a general indication of Ireland’s performance. Green indicates a strong performance (top third of OECD, euro area, or comparator group), orange signals an average performance, while red means that Ireland is ranking within the bottom third of the comparator group. Certain indicators, which are not ranked, are also given a traffic light colour, in which case the colour is determined (somewhat subjectively) based on Ireland’s performance over time, or vis-à-vis a peer group average.
Rankings are provided where appropriate, but in a number of charts, it is not possible to
designate a best performer. In charts with both GDP and GNP performance for Ireland, rankings are provided for both sets of data.
In interpreting the ranking for each indicator, a low ranking (i.e. close to 1st) implies a healthy
competitiveness position, while a high ranking implies an uncompetitive position.
Changes in rankings refer to the change in Ireland’s position since either the previous year, or in
the case of charts displaying more than one year of data, since the oldest data displayed. Exceptions to this are highlighted in endnotes. ( ) refers to an improvement in Ireland’s competitive position, so 4 means an improvement of four places in Ireland’s ranking. (-) means that there has been no change in Ireland’s ranking, while ( ) refers to a fall in ranking.
€35,600
€29,070 €28,600
€25,700
€0 €10,000 €20,000 €30,000 €40,000 €50,000 €60,000 €70,000
Sw
itz
er
lan
d
De
nm
ark
Sw
ed
en US
Ne
th
er
la
nd
s
Ir
elan
d GDP Finla
nd
Ge
rm
an
y
Franc
e
UK
Ir
el
an
d GNP
eu
ro
a
re
a-1
8
Ja
pa
n
EU2
8
Ita
ly
Sp
ai
n
Po
la
nd
Hu
ng
ary
GD
P per c
apita
(€
)
Chapter 3
Sustainable Growth
Competitiveness is not an end in itself, but is a means of achieving sustainable improvements in living standards and quality of life. This section benchmarks Ireland’s performance under three headings: macroeconomic sustainability, quality of life and environmental sustainability.
Macroeconomic Sustainability (Section 3.1): The indicators in this section cover the level,
growth and drivers of Ireland’s national income. From a sustainability perspective, the indicators examine Ireland’s current account performance and Ireland’s debt dynamics.
Quality of Life (Section 3.2): Nations and regions do not pursue competitiveness merely for the
sake of trade. Competitiveness supports living standards and ultimately contributes to the quality of life of citizens. In measuring quality of life, the Scorecard examines indicators on income levels, poverty and health.
Environmental Sustainability (Section 3.3): The essence of environmental sustainability is a
stable relationship between human activities and the natural world. To be truly sustainable, development must respect the core pillars of sustainability: the environment, the economic and the social. This section examines Ireland’s broad environmental performance and focuses specifically on energy, carbon emissions and waste management.
3.1 Macroeconomic
Sustainability
Figure 3.1: Gross domestic product at market prices, € per capita, 201322
Despite the negative impact of the recession on the entire Irish economy, Ireland’s GDP per capita remains well above the euro area average. However when measured in terms of GNP per capita (i.e. with the impact of the foreign owned sector removed) Ireland ranks just marginally ahead of the euro area-17 average. Since their peak in 2007, both GDP and GDP per capita have declined by just under 20 per cent. Euro area-18 Ranking: GDP: 4th (↓2)
GNP: 8th (↓6)
Source: Eurostat
Figure 3.2: Average annual growth rate in gross domestic product at market prices per capita (Purchasing power standard), 2012
Between 2007 and 2011, an average annual decline of 2.4 percent in GDP was recorded (-3.3% in GNP terms). In 2012, however, Ireland experienced GDP growth of 1.9% (and 3.5% in GNP terms). The GDP growth rate, while largely reflecting the activities of MNCs in our economy, has been somewhat less volatile than the GNP growth rate.
Euro area-18 Ranking: GDP: 6th (↑12)
GNP: 3rd (↑15)
Source: Eurostat €35,60 0 €29,07 0 €28,600 €25,700 €0 €10,000 €20,000 €30,000 €40,000 €50,000 €60,000 €70,000 Sw it ze rla nd De
nmark Swed
en US Ne th er la nd s Ir el an
d GDP Finla
nd Ge rm an y Fr an ce UK Irela nd G N P eu ro a re a-1 8 Ja pa n EU 28 Ita ly Sp ai n Pola nd Hu ng ar y
GDP per ca
pi ta ( €) 2013 2008 3. 5% 1. 9% 1. 5% -4.0% -3.0% -2.0% -1.0% 0.0% 1.0% 2.0% 3.0% 4.0% 5.0% Pol and Switz erl and US Ir el an d GNP Swed en Ge rma ny De nmark Irela nd
GDP EU-2
Figure 3.3: Components of Irish economic Growth (GDP), 1998-2013
Over the course of the recession, net exports (the value of a country's total exports minus the value of its total imports) were the only positive factor contributing to Irish growth. In 2013, however, net exports actually made a marginally negative contribution. On the other hand, consumption growth was positive for the first time in a number of years, while the government contribution was flat. Investment, whilst negative, showed signs of stabilisation.
Ranking: n/a
Source: CSO National Accounts
Figure 3.4: Balance of payments, current account balance (€millions), 2000-2013
The current account balance measures earnings from merchandise and services net exports plus net factor income and other transfers. Since 2008, the current account has moved from deficit to surplus, reflecting improved cost competitiveness, allied to reduced consumer demand for imported goods and services. The impact of the ‘patent cliff’ has reduced net factor incomes in 2012 and 2013. The impact of re-domiciled plcs also reduces the current account surplus23.
Ranking: n/a
Source: CSO Balance of Payments / National Accounts
-14% -12% -10% -8% -6% -4% -2% 0% 2% 4% 6% 8% 10% 12%
19
98
19
99
20
00
20
01
20
02
20
03
20
04
20
05
20
06
20
07
20
08
20
09
20
10
20
11
20
12
20
13
Pe
rcen
tage of GDP
Growth
Consumption Government Investment Net Exports
-€15,000 -€10,000 -€5,000 €0 €5,000 €10,000 €15,000
20
00
20
01
20
02
20
03
20
04
20
05
20
06
20
07
20
08
20
09
20
10
20
11
20
12
20
13
€m
ill
io