1
Headroom analysis and systematic
review for big-3 screening
Carina Marié Behr
28 January 2020
Thesis submitted in partial fulfilment of the requirements for the
degree of MSc in Industrial Engineering and Management -
Healthcare Technology and Management
Under Supervision of
Dr. Ir. H. Koffijberg
&
ii Preface
Two years ago I started packing my bags to move to a faraway, and apparently cold and wet country in the northern hemisphere to start a journey to further my knowledge towards a master’s degree at the University of Twente in Enschede. The start of this journey is to a large extent the result of two inspiring industrial engineers, Mr Roland Rӧhrs and Prof. Erwin Hans to whom I am very thankful for their influence on my journey as an industrial engineer so far. In my journey as a master’s student, a new and interesting world of healthcare was opened up for me including vocabulary and industry challenges which have never even crossed my mind.
Every step of this journey took me farther down the path of self-mastery. I was exposed to many different cultures and also learned some Dutch, to better interact with the local students. This road of self-mastery has given me the opportunity to be content with myself wherever I am and to
constantly attempt new things even when I know the chance of failure is high. I have many people to thank for support and friendship during the journey.
Thank you to all my lecturers for your guidance and support during my course work. A special thank you to my supervisors, Dr H. Koffijberg and Prof. M.J. IJzerman, whom I have predominantly worked with in the last five months during my graduation project. I could not have done this work in a limited amount of time without your support and leadership. Thank you for our brainstorming sessions and your valuable feedback. I look forward to working with you in the future.
iii Abstract
Lung cancer screening has already been proven to be effective in many countries including countries in Europe. The approach to lung cancer screening will influence the extent to which it is
cost-effective. One approach to improve cost-effectiveness is screening for more diseases in a single screening program. Together with lung cancer, cardiovascular disease (CVD) and chronic obstructive pulmonary disease (COPD) are highly prevalent diseases in the western world, with a large health burden to patients and financial burden to society. All three these diseases can be detected using low-dose computed tomography (CT) and have as a combination been defined as the big-3. In this study, a headroom analysis is conducted to evaluate the potential cost-effectiveness of screening for the big-3 separately and in combination using low-dose CT. In the headroom analysis, the health outcomes of detecting and treating patients following early detection were compared to the outcomes of the current diagnosing process in the Netherlands. Early detection is combined with the assumption that asymptomatic patients undergoing screening will be detected in an earlier disease stage than normal, also referred to as a stage shift. The proportion of patients diagnosed in early disease stages will be higher and the proportion of patients diagnosed in later stages will be lower than in the current diagnostic process. In the current diagnostic process, there is no screening for the big-3, therefore, patients are only diagnosed after symptoms are experienced. A perfect scenario where all patients are detected in an early disease stage was also compared to the health outcomes under currently used diagnostic processes. Both the results of early detection through screening and the perfect scenario resulted in the largest headroom when screening for three diseases simultaneously. The effect of screening for a population with risk factors for lung cancer specifically or risk factors which also increases the risk of CVD and COPD, on the headroom is
investigated. These scenarios, which are all calculated for combination screening, indicate that when adjusting the target population of lung cancer screening for combination screening, the effect of shared big-3 risk factors is larger than the effect of an increased lung cancer risk on the headroom. Lastly, the effect on the headroom was investigated when clearly definable groups were used as the target population. Here, a target population of current smokers and a group of individuals over 60 years of age were investigated separately. From these results, screening with low-dose CT in the ageing population had a higher headroom, indicating more promising results. However, it is expected that a target population of aged smokers would result in an even higher headroom value.
The results of the headroom indicate cost-effectiveness potential for screening for all three diseases simultaneously. Based on this conclusion, a systematic review is conducted to determine what has been reported in literature with regards to the cost-effectiveness of multiple disease screening programs using CT-scans. After a search was conducted in Scopus and Pubmed, 24 publications were reviewed in full-text of which seven studies included some form of cost-effectiveness analyses. When reviewing these articles, the focus was mainly on identifying approaches to incorporate comorbidity into the models. These studies did not provide comprehensive insight into existing structured approaches to deal with multiple diseases in the cost-effectiveness analysis of a multi-disease screening program. However, from these publications, a list of options was put together on how to incorporate comorbidity in a cost-effectiveness model, especially focusing on the combined disease incidences.
iv
Table of Contents
1. Introduction ...1
2. Headroom analysis ...4
2.1. Methodology...5
2.2. Results ...9
2.3. Discussion ... 19
3. Systematic review ... 21
3.1. Methodology... 21
3.2. Results ... 23
3.3. Discussion ... 24
4. Discussion ... 25
4.1. Conclusion ... 25
4.2. Limitations ... 25
4.3. Future work ... 26
References ... 27
1
1.
Introduction
Lung cancer is a highly prevalent disease in the Netherlands and the western world. One way of reducing disease burden is using screening to promote the early detection of diseases by diagnosing patients while they are still asymptomatic, which leads to early treatment. This early diagnosis and treatment can be represented using stage shifts, where the severity of the disease is represented by different stages and more advanced stages of the disease mean that the disease is classified as being more severe. Stage shifts (Connor, Chu, & Smart, 1989) is commonly used as the reasoning behind screening and suggests the disease stage at diagnosis to be one stage lower or in the same disease stage, but with less disease progression in that stage, as a result of early diagnosis through screening. Subsequently, the disease is also treated earlier leading to better health outcomes and often also less costly treatment.
Screening for lung cancer has already proven to be effective in the USA (Aberle et al., 2011) and in the United Kingdom lung cancer screening trial (UKLST) (J. K. Field et al., 2016) by reducing mortality. For the implementation of such a screening program, cost-effectiveness is also an important driver. In the UKLST, no conclusions are drawn with regards to cost-effectiveness yet, but a collaboration with the NELSON (Nederlands Levens Longkanker Screenings: Dutch-Belgian Randomised Lung Cancer Screening Trial) trial and more European trials to gather data has been suggested to further the research and support impact analyses (J. K. Field et al., 2016). In high-income countries like Canada (ten Haaf et al., 2017) and Switzerland (Tomonaga et al., 2018) the cost-effectiveness of lung cancer screening has already been proven. In Canada, pilot studies are currently being conducted to investigate the feasibility of implementing lung cancer screening (Canadian Cancer Statistics Advisory Committee, 2018), while in Switzerland it is not yet clear if screening will be more cost-effective than other interventions such as smoking cessation. Implementing a screening program requires a large upfront investment before any health outcomes are achieved or possible long term economic benefits for the health system can be observed. Therefore, considering a screening program raises the question of whether the long term benefits are worth the investment costs, an analysis which is often referred to as a cost-effectiveness analysis. The results from the NELSON trial provides evidence for the effectiveness of lung cancer screening in Europe by illustrating, for example, a 25% reduction in mortality in men at 10-years follow-up (De Koning, Van Der Aalst, Ten Haaf, & Oudkerk, 2018). The effectiveness of lung cancer screening is confirmed by a published multidisciplinary round table discussion, where the conclusion is that low-dose CT screening for lung cancer should be implemented (John K Field et al., 2019). However, there is still insufficient evidence on the cost-effectiveness of such a screening program in Europe and it was recognised that the screening set-up could still be improved through “implementation research programs”.
2 In a project funded by ZonMW and executed by the UMC Groningen and the University of Twente different imaging biomarkers are being developed and evaluated to detect three diseases on one low-dose Computed Tomography-scan. The three diseases are cardiovascular disease (CVD), Chronic Obstructive Pulmonary Disease (COPD) and lung cancer, sometimes combined referred to as the big-3. These diseases are highly prevalent in the western world and are expected to cause the most deaths by 2050 (Heuvelmans et al., 2018). The high prevalence of these diseases puts a high burden on patients and the health system with regards to care provision and costs.
The potential advantages of combination screening and the potential to detect the big-3 using low-dose CT create the opportunity to improve the cost-effectiveness of lung cancer screening by
additionally screening for CVD, COPD or both. A low-dose CT-scan is potentially worthwhile, because of its low cost and because image markers for the big-3 can all be visualised using a thorax CT preventing additional tests. These diseases also share common risk factors such as advanced age and smoking or smoking history, which indicates a similar target population.
In addition to the evidence that lung cancer screening shows cost-effectiveness potential, more research and data is becoming available to show the potential of screening programs for CVD and COPD. The ROBINSCA trial in the Netherlands aims to gather data to determine if early detection of CVD will influence the morbidity and mortality of patients, using the classical risk score (SCORE) or coronary artery calcium-scoring using CT (ROBINSCA, 2019). For COPD screening, filling out a
questionnaire with a general practitioner is considered a basic but effective form of screening, which does not require a large amount of effort to detect patients even though it is known that this method does not result in earlier detection (Ferrer, 1997).
The lack of knowledge of the potential benefits of a combined disease screening program raises problems when considering to do combination screening. A problem cluster shown in Appendix A outlines the main identified problems and two core knowledge problems that this project aims to address. Firstly, it is unknown if expanding lung cancer screening to include either or both CVD and COPD could potentially result in a cost-effective screening program. Secondly, in combination with the first problem, it is unknown how simulation modelling (which is often used for early health technology assessment) can be used in the context of multi-disease screening programs.
Firstly, the problem regarding the expansion of lung cancer screening will be addressed by answering the following research question, what could the maximum acceptable price per screened individual in the Netherlands be for lung cancer screening, with currently available data, and what effect will additionally screening for CVD, COPD or both and different target screening populations have on these outcomes?
3 when diseases occur, which should also address which disease occurs first if comorbidity exists. Determining the target screening population is a challenge which is caused by the uncertainty in the correlation of diseases and how common risk factors influence the risk of having one or more diseases.
The mentioned modelling challenges help to form the second research question which should be answered in this study and is defined as follows. Which model type, simulation modelling techniques, and model structure can be used to assist in the evaluation and optimization of a multi-disease screening program?
4
2.
Headroom analysis
When estimating the maximum acceptable price per screened individual, an early-stage cost-effectiveness analysis should be conducted. Such a cost-cost-effectiveness analysis is done within the research field of Health Technology Assessment (HTA). HTA is defined as “a multi-disciplinary
evaluation process that allows the analysis and assessment of health technologies by considering the direct or indirect medical-clinical, organizational, economic, social, legal and ethical implications in the short and long term using the same technologies” (Improta et al., 2018). HTA’s often use simulation modelling to estimate the outcomes, in particular when long term outcomes are of primary interest. These models can be developed following the implementation of a new
intervention or technology or in the early developmental phases of new interventions, where the latter forms part of the study field called early HTA.
Health economic evaluations are one of the components of HTA and early HTA and consider the health and economic outcomes of a new intervention. When conducting a health economic
evaluation, the effects or health outcomes are measured by means of, for example, utility, life-years gained, quality-adjusted life-years (QALY) and quality of life (Drummond, Schulper, Torrance, O’Brien, & Stoddart, 2015; Wattson et al., 2014). These are all measures of how an intervention such as screening (eventually) affects the patient’s life. The economic outcomes are commonly expressed as costs of an intervention, technology, treatment or, more comprehensively, of the entire clinical pathway that a patient follows. To compare the health and economic outcomes of a new
intervention with a comparator (for example usual care), the incremental cost-effectiveness ratio (ICER) is calculated, which is the most popular method of reporting the results of cost-effectiveness and cost-utility analyses (Drummond et al., 2015). This ratio relates the difference in mean costs to the difference in mean health outcomes of two interventions and is measured in additional costs to obtain one additional unit of health effect e.g. QALY (Institute for Clinical and Economic Review, 2018). This ratio is compared to a willingness-to-pay threshold which has the same unit as the ICER. The willingness-to-pay threshold is often country-specific.
As an alternative to conducting a full cost-effectiveness analysis, an initial analysis can be done by means of a headroom analysis. This analysis is a threshold approach, which should determine the maximum amount that could be spent on the screening intervention to still be regarded as cost-effective, also known as the maximum reimbursable price (MRP) (Girling, Lilford, Cole, & Young, 2015). The headroom analysis follows the same principles as a full HTA but is normally conducted in early phases with limited data available and with an optimistic perspective on the new
intervention(Cosh, Girling, Lilford, McAteer, & Young, 2007). This leads to simplification of analysis, which could disregard some effects, but it is still a useful estimation for the maximum, hypothetical value of an intervention. It is not directly useful to accurately estimate the expected benefits of an intervention. Rather, it produces a ‘hurdle’ in the sense that a low headroom value indicates that the intervention is unlikely to ever be cost-effective. When this hurdle is not passed, further
development and assessment of the invention is very unlikely to be worthwhile. A headroom approach is chosen in this study because this study serves as an initial investigation of the cost -effectiveness of expanding lung cancer screening. Based on the results achieved in this study, a decision can be made on whether a full cost-effectiveness analysis should be conducted.
As explained in chapter 1, it is expected that screening for more than one disease simultaneously will improve health outcomes with only a minor cost increase. The economic impact and health
5 subsequently calculate the maximum price per screened person. The maximum price per screened person covers the costs of screening individuals from the target population and treating the
diagnosed patients, thus including the entire care-pathway in the calculated price. In this headroom analysis, a comparison of different scenarios regarding stage shifts (realistic and perfect stage shifts), disease incidence combinations and different target populations is done to determine what effect it might have on outcomes.
2.1.
Methodology
The headroom analysis is a deterministic analysis conducted in R with publically available data sourced from publications and websites providing summary statistics, health outcome information, costs and other relevant information relating to the big-3 diseases. The headroom analysis is
conducted based on a preliminary, predefined screening strategy using low-dose CT for the screening of lung cancer with the addition of either CVD, COPD or both these diseases simultaneously. The target screening population for the initial analysis is a high-risk group of current and former smokers between 50 and 75 years of age in the Netherlands.
The analysis is conducted based on the theory that screening causes a stage shift as explained in chapter 1. The proportion of patients in each stage can be found from literature and changes when screening is implemented. This stage shift results in better health outcomes for the disease
population because more patients identified with disease already in earlier (lower) disease stages mean that more patients have better health outcomes. Patients from the big-3 diseases are classified into such stages according to the severity of a disease. All patients with a disease are thus classified to be in one of the stages. The disease stages used for lung cancer is according to standard TNM staging and for COPD according to the GOLD criteria for COPD severity. For CVD, however, such a stage classification is not always suitable, as health outcomes and costs are often rather dependent on the occurrence of a CVD event (such as a stroke) than on the severity of the disease. Therefore, the stages of CVD are defined in terms of CVD risk categories. The proportion of CVD patients in each risk category can be found in literature as well as the risk of an individual in each risk category to experience a CVD event. Instead of assuming that early detection through screening will result in a shift of patients to lower risk categories, the application of a stage shift for CVD patients is
interpreted in a way that early detection through screening and consequently, early treatment of CVD will cause a reduction in the number of CVD events experienced by patients in each risk category. For ease of reporting, the risk categories of CVD patients are referred to as stages in the remainder of this report.
6 The data to be gathered and used as inputs are listed here. The sources and adjustments made to the data are explained in chapter 2.2. Results.
- Incidence rates of the disease separately - Co-occurrences of the big-3
- The stage distribution of patients over disease stages under the current diagnostic process - The expected distribution over stages when screening is implemented
- Utilities for the diseases per stage
- Survival of patients per disease and stage - Disease costs of patients in each disease stage
[image:11.595.70.518.305.650.2]In all applications of the headroom analysis in this report, the following outcomes are calculated as intermediate steps in the analysis to determine the potential headroom of the predefined screening strategy. The outcomes in Table 1 were then calculated for the corresponding screening strategy, which is for example only screening for lung cancer or lung cancer and COPD.
Table 1 Outcomes of the headroom calculations
Outcome name Description Disease
population
The absolute number of individuals in the screening population with the specified disease or diseases. This is calculated based on the number of individuals in the screening population multiplied by the proportion of
individuals who have a certain disease. If more than one disease is considered, the patients with comorbidities are only included once.
QALY Diagnosis The number of QALYs of a patient diagnosed with one or multiple diseases, compared to a healthy individual in case of no screening program. This outcome reflects the current health state of the screening population. Calculated as the specific disease group (e.g. LC or LC with COPD) divided by the target population, multiplied by the expected difference in survival and expected utility for the specific disease group. Because the utility is multiplied by a difference in survival, the QALYs used throughout this study can also be interpreted as quality-adjusted life expectancy (QALE).
QALY Screening The expected QALY by the disease population compared to a healthy individual if a screening program is implemented. It is calculated in the same way as QALY Diagnosis.
Effectiveness Gap
The difference between QALY Diagnosis and QALY Screening, representing the average incremental health outcomes per diagnosed individual if a screening program is implemented compared to usual care (no screening).
Headroom The headroom reflects the maximum acceptable price per screened individual, for the screening strategy to be considered cost-effective. This is calculated with the assumption that the screening program would exactly meet a willingness-to-pay threshold of €20 000/QALY. The headroom also includes the cost-savings (or increase in costs) incurred due to the stage shift.
7
Stage distributions
For varying stage distributions, three scenarios are depicted and labelled as A, B and C.
- Scenario A represents the scenario with current distributions as found in the Netherlands without a screening program.
- Scenario B represents the findings as it would be realistic given published results of clinical trials or screening programs. For CVD the ‘shift’ is not related directly to the severity of disease but to the risk of experiencing a CVD event (for example, a stroke). The benefits of early detection are therefore calculated based on the risk reduction of CVD events. Thus a smaller proportion of patients experience a CVD event with screening, due to preventative treatment, as compared to without screening.
- Scenario C represents what is referred to as the perfect screening scenario. This scenario is included to get an idea of the maximum health outcomes which could be achieved in an unrealistically optimistic scenario, representing the upper bound for the headroom. In this hypothetical scenario, all patients are detected in the first disease stage for lung cancer and COPD. For CVD, the perfect scenario assumes that no patients experience a cardiovascular event. This is equivalent to the scenario interpretation for lung cancer and COPD because without any cardiovascular events, patients still have health losses and cost of low-dose treatment after being diagnosed for screening.
The headroom, based on different stage distributions, is calculated for the comparison between scenarios A and B and for scenarios A and C.
Influence of incidence rates
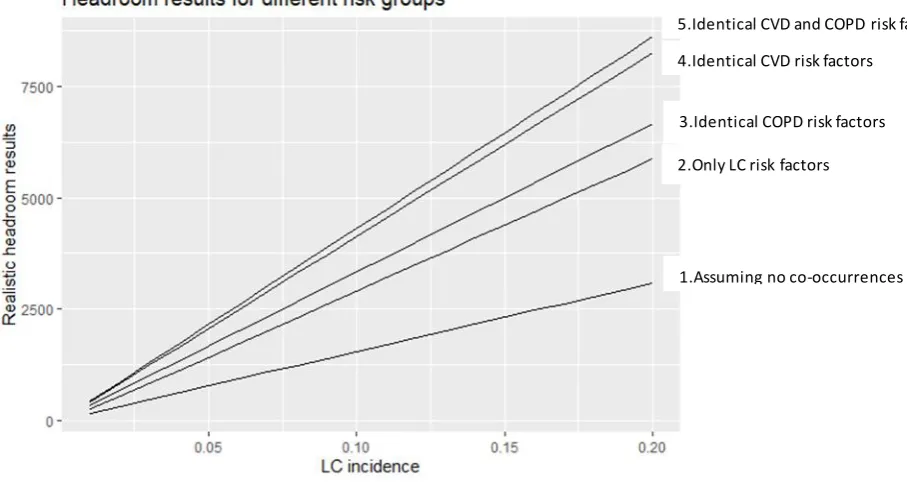
The impact of different combinations of incidence rates of the big-3 on headroom is an interesting topic to explore. It could give an indication of which of the big-3 diseases are the most important when determining the target population if combination screening is considered. It is ideal to choose a target screening population in such a way that the yield of screening is as high as possible but it is also important to see what effect different combinations of incidence for the diseases have on the magnitude of increase in headroom. For this study, the headroom increase for lung cancer screening is used as a baseline and the effects of CVD and COPD on the headroom are additions to lung cancer screening. This part of the analysis could give insight into which disease, other than lung cancer, has a larger impact on the headroom when a screening population with a higher incidence is chosen. For this analysis, the headroom can be calculated over a number of different incidence rates of the big-3. This could serve as an estimate of what the headroom would be if a screening population contains individuals with the relevant incidence rates. Five scenarios will be considered in this part of the headroom analysis.
1) As a baseline, the headroom is calculated for multiple lung cancer incidences with the assumption that there are no shared risk factors between lung cancer and, CVD and COPD, thus assuming that no co-occurrences of CVD and COPD exist.
2) The headroom is calculated over multiple lung cancer incidences, where the target population is defined as a group of patients with risk factors related to lung cancer, which has a small impact on the risk of having COPD and CVD. Co-occurrences are detected in this group, but no patients are detected with only CVD or COPD.
3) The headroom is calculated over multiple lung cancer incidences, where the target group is defined to consist of individuals with risk factors for lung cancer, which increases the COPD risk identically in all individuals. Individuals with CVD are only detected if they have
8 4) The headroom is calculated over multiple lung cancer incidences, where the target group is
defined to consist of individuals with risk factors for lung cancer, which increases the CVD risk identically in all individuals. Individuals with COPD are only detected if they have comorbidity.
5) The headroom is calculated over multiple lung cancer incidences, where the target group is defined to consist of individuals with risk factors for lung cancer, which increases the CVD and COPD risks identically in all individuals. Individuals with CVD are only detected if they have comorbidity.
Comparing the headroom calculated for these five scenarios should assist in identifying the type of risk factors which could maximise the cost-effectiveness of lung cancer screening or an expansion thereof.
Varying target populations
The effect of different screening populations on the headroom is important. After determining the effect of incidence rates on the headroom, it could be interesting to look at the effect that specific target screening populations would have on the headroom. The screening population is adjusted to make a comparison between two specific target screening populations with their group-specific incidence rates. These screening populations are typically mentioned as high-risk groups of the big-3 (Heuvelmans et al., 2018) and are used to provide insight into headroom results when screening easily definable risk groups. The target screening population should define a specific group of
individuals who can be invited for screening, for example specifying an age range and adding that the individuals should be current smokers. To determine an optimal screening population, a detailed analysis is needed including data with more patient characteristics showing, for example, the characteristics in terms of smoking history and age of patients who were diagnosed with one or multiple of the big-3. In this analysis, the defined groups are based on known common risk factors of the big-3 diseases which are smoking and age. The following two easily definable groups are
considered and their headroom is calculated.
(1) a screening population of only current smokers (2) a screening population of older individuals
The age of the second group is chosen based on data availability.
General analysis assumptions
For simplification of the headroom analysis, some assumptions need to be made. These assumptions were made to simplify the preliminary calculation which is common in headroom analyses. Given the purpose of headroom analysis, the assumptions were defined such that the benefits of screening are systematically overestimated. General assumptions are listed here and assumptions based on the data that could be gathered are provided in chapter 2.2.
1. All patients with a disease are detected with screening, thus assuming 100% sensitivity and specificity for all three diseases using low-dose CT.
2. For the stage distribution scenarios and the varying target population parts of the analysis, the target screening population is chosen in such a way that it can be assumed that all incidences occur within the target population. This assumption does not apply when varying the disease incidence rates.
3. All individuals invited for screening show up.
9
2.2.
Results
Before the headroom calculations can be made, input data is gathered and adjusted to fit the method of analysis as conducted in this study.
Input parameters
The inputs used to calculate the headroom are given in Table 2, Table 3 and Table 4. The input parameters are accompanied by their values, description and source. Some adjustments had to be made to the data found in literature to ensure that it is in the correct format for the analysis. Such adjustments, if applicable, are explained in the footnotes of each table.
IA IB IIA IIB 1 Major risk factor >1 Major risk factor Mild Moderate Severe Very severe IIIA IIIB IV IA IB 0.087 0.066 0.048 0.044 0.155 0.101 0.499 0.310 0.690 0.340 0.290 0.046 0.026 0.079 0.091 0.128 0.310 0.690 1.000 0.000 0.000 0.000 0.000 0.000 0.000 1.000 0.000 Stage LC CVD COPD NSCLC SCLC
Probabilities per stage in scenario:
A B C
Combinations of diseases based on comorbidities
[image:14.595.166.427.216.697.2]0.493 0.236 0.173 0.584 0.202 0.040 0.393 0.515 0.089 0.001 1.000 0.000 0.000 0.000 CV-event 0.278 CV-event 0.455 No CV-event 0.546 No CV-event 0.722 CV-event 0.209 CV-event 0.341 No CV-event 0.660 No CV-event 0.792 No CV-event 1 CV-event 0 No CV-event 1 CV-event 0 1 Elevated risk factor 0.270 CV-event 0.203 No CV-event 0.797 CV-event 0.152 No CV-event 0.848 No CV-event 1 CV-event 0
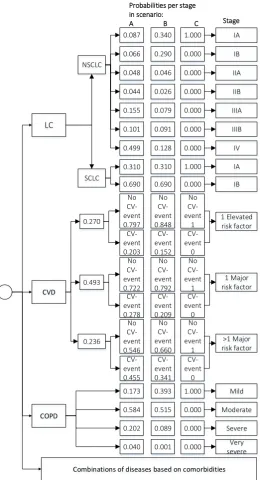
10 The stage shift on which this analysis is based is illustrated in Figure 1, showing the three scenarios A, B and C as explained in chapter 2.1. The data used here are explained in Table 2. The stages of CVD are defined based on the literature used for inputs in the analysis (Lloyd-Jones et al., 2006). The three categories used as stages are I) One or more elevated risk factor, II) One or more major risk factor and III) More than one major risk factor. An elevated risk factor is defined as total cholesterol 5.16 to 6.19 mmol/L (200 to 239 mg/dL), systolic blood pressure 140 to 159 mm Hg, diastolic blood pressure 90 to 99 mm Hg, non-smoker, and non-diabetic. Major risk factors are defined as total cholesterol ≥6.20 mmol/L (≥240 mg/dL), systolic blood pressure ≥160 mm Hg, diastolic blood pressure ≥100 mm Hg, smoker, or diabetic. Smoking is considered to be a major risk factor and it is assumed that being a former smoker is considered to be an elevated risk factor. Therefore the screening population of former and current smokers, used in this study, are all categorised in these three stages. Categories with fewer risk factors were not included. The proportion of CVD patients in each stage is known as well as the risk of experiencing a CVD event in each risk category. The
incidence rates of the three diseases, as well as the stage distributions as explained, are given in Table 2.
Table 2: Input parameters for headroom analysis (Part 1)
Input Value Description Source
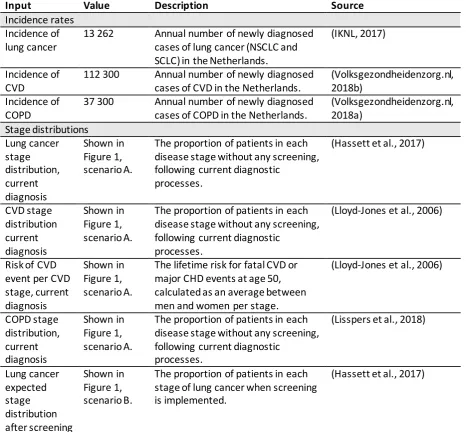
Incidence rates Incidence of lung cancer
13 262 Annual number of newly diagnosed cases of lung cancer (NSCLC and SCLC) in the Netherlands.
(IKNL, 2017)
Incidence of CVD
112 300 Annual number of newly diagnosed cases of CVD in the Netherlands.
(Volksgezondheidenzorg.nl, 2018b)
Incidence of COPD
37 300 Annual number of newly diagnosed cases of COPD in the Netherlands.
[image:15.595.71.541.321.753.2](Volksgezondheidenzorg.nl, 2018a) Stage distributions Lung cancer stage distribution, current diagnosis Shown in Figure 1, scenario A.
The proportion of patients in each disease stage without any screening, following current diagnostic
processes.
(Hassett et al., 2017)
CVD stage distribution current diagnosis Shown in Figure 1, scenario A.
The proportion of patients in each disease stage without any screening, following current diagnostic
processes.
(Lloyd-Jones et al., 2006)
Risk of CVD event per CVD stage, current diagnosis
Shown in Figure 1, scenario A.
The lifetime risk for fatal CVD or major CHD events at age 50, calculated as an average between men and women per stage.
(Lloyd-Jones et al., 2006)
COPD stage distribution, current diagnosis Shown in Figure 1, scenario A.
The proportion of patients in each disease stage without any screening, following current diagnostic
processes.
(Lisspers et al., 2018)
Lung cancer expected stage distribution after screening Shown in Figure 1, scenario B.
The proportion of patients in each stage of lung cancer when screening is implemented.
11 CVD expected stage distribution after screening Shown in Figure 1, scenario B.
After treatment using low-dose aspirin, the relative risk reduction of a stroke in patients without clinical vascular disease is up to 25% according to literature. In this analysis, 25% is used as an overestimation.
(Godley & Hernandez-Vila, 2016) COPD expected stage distribution after screening Shown in Figure 1, scenario B.
The proportion of patients in each disease stage of COPD when screening is implemented.
(Kjeldgaard, Lykkegaard, Spillemose, & Ulrik, 2017)
[image:16.595.69.536.464.763.2]As an extension to the incidence and staging inputs in Table 2, the analysis also incorporates comorbidities in the form of conditional probabilities as explained in Table 3. The incidence rates or probability of single disease occurrences are assumed to be independent. This analysis makes use of conditional probabilities as a suitable method for including comorbidities, which is the overlap between the two independent diseases. Table 3 presents the inputs regarding the probabilities of having comorbidity, the differences in life expectancy of a patient compared to a healthy individual and the utility values. Utility or health state utility is a value between 0 (representing death) and 1 (representing full health). Utility values are used especially in cost-effectiveness analyses to estimate the effect of interventions. The utility can, for example, be used to calculate the QALYs by multiplying the utility of a health state by the time spent in that health state (Paracha, Abdulla, & MacGilchrist, 2018). For CVD, the utilities and costs (in Table 4) are used for strokes as strokes are one of the subcategories of CVD with the highest mortality rate in the Netherlands (de Boer, Bots, van Dis, Vaartjes, & Visseren, 2019)
Table 3 Input parameters for headroom analysis (Part 2)
Input Value Description Source
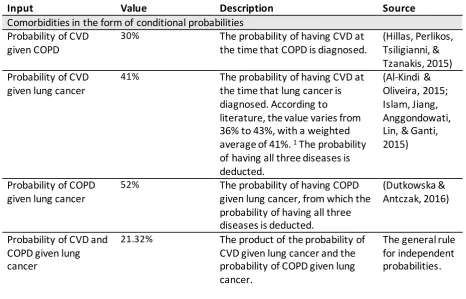
Comorbidities in the form of conditional probabilities Probability of CVD
given COPD
30% The probability of having CVD at the time that COPD is diagnosed.
(Hillas, Perlikos, Tsiligianni, & Tzanakis, 2015) Probability of CVD
given lung cancer
41% The probability of having CVD at the time that lung cancer is diagnosed. According to literature, the value varies from 36% to 43%, with a weighted average of 41%. 1 The probability
of having all three diseases is deducted.
(Al-Kindi & Oliveira, 2015; Islam, Jiang, Anggondowati, Lin, & Ganti, 2015)
Probability of COPD given lung cancer
52% The probability of having COPD given lung cancer, from which the probability of having all three diseases is deducted.
(Dutkowska & Antczak, 2016)
Probability of CVD and COPD given lung cancer
21.32% The product of the probability of CVD given lung cancer and the probability of COPD given lung cancer.
12 The difference in life expectancy compared to a healthy individual
Difference in life expectancy of CVD patients per stage (in years)
I: -2 II:-6.5 III: -9.5
The difference between the median survival in years of patients in each risk group and a patient with all optimal risk factors.
(Lloyd-Jones et al., 2006)
Difference in life expectancy of COPD patients per stage (in years)
I: 0.1 II: -1.4 III: -4.0 IV: -4.0
A study in the United States of America showed 10-year survival probabilities for the different stages which are converted to difference in life expectancy. 2
(Shavelle, Paculdo, Kush, Mannino, & Strauss, 2009) Difference in life
expectancy of lung cancer patients per stage (in years)
NSCLC
IA: 1.5 IB: -2.4 IIA: -4.2 IIB: -5.9 IIIA: -7.0 IIIB: -7.7 IV: -8.5
SCLC
IA: -7.1 IB: -8.5
The probability of survival per stage is converted to difference in life expectancy. 3
(iknl, 2012)
Utility
These values were used to calculate the quality-adjusted life-years (QALY) of patients. Utilities of lung cancer
patients per stage
NSCLC
IA: 0.60 IB: 0.60 IIA: 0.54 IIB: 0.54 IIIA: 0.54 IIIB: 0.54 IV: 0.47
SCLC
IA: 0.60 IB: 0.47
The utilities of NSLC and SCLC patients are available per stage.
(Paracha et al., 2018)
Utilities of CVD patients with or without CVD events
Patient without a CVD event: 0.83 Patient with a non-fatal CVD event: 0.76
The utilities of patients with or without non-fatal CVD events.4
(Lewis et al., 2014)
Utilities of COPD patients per stage
I: 0.897 II: 0.755 III: 0.748 IV: 0.549
The mean utility scores by COPD severity stage according to GOLD stages. (Hoogendoorn, Rutten-van Mölken, Hoogenveen, Al, & Feenstra, 2010)
1 One study of 5 683 lung cancer patients, indicated that 2034 patients had comorbidities including
13
2 The 10-year survival probabilities can be transformed into constant yearly mortality rates using
Formula 1. Assuming an exponential distribution for the corresponding survival times defined by these rates, the survival times were used to calculate the difference in life expectancy compared to a healthy individual.
𝑀𝑜𝑟𝑡𝑎𝑙𝑖𝑡𝑦 𝑟𝑎𝑡𝑒 =− ln(−𝑠𝑢𝑟𝑣𝑖𝑣𝑎𝑙𝑝𝑟𝑜𝑏𝑎𝑏𝑖𝑙𝑖𝑡𝑦 + 1)
time (1)
3 The same method as above was used, with Formula 1 to calculate the survival rates of non-small
cell and small cell lung cancer patients (NSCLC and SCLC), with the probability of survival per stage converted to yearly mortality rates using Formula 1, and then incremental survival, corrected for mean age at diagnosis by subtracting the mean life expectancy of a healthy individual at that age.
4 For CVD, the utilities were obtained from literature (Lewis et al., 2014), where the utility of patients
with a non-fatal CVD event is 0.76 and for those without a subsequent non-fatal CV event is 0.83. The probability of a patient from each risk group to experience a cardiac event is reflected in Figure 1 and has been used in combination with these utility values in the analysis.
The cost savings that are incurred when screening is implemented are also important for the headroom calculations. The cost-savings results from a stage-shift when screening is implemented because the cost of disease (for example, the cost of treatment, monitoring, side effects etc.)
generally increases as the disease progresses. The input values shown in Table 4 are used to calculate the average cost per individual in each disease stage, which can be used to calculate the total cost-savings per disease if a stage shift is applied. The annual disease costs for COPD and lung cancer are multiplied by the survival of patients after diagnosis to calculate the total cost per patient in each disease stage.
For CVD, the costs are calculated differently than for lung cancer and COPD. The average cost of CVD patients depends on patients having fatal, non-fatal or no CVD events and not on the stage of the disease. In this study, strokes are the only CVD event considered and the fatality rate within 1 year after a haemorrhagic or ischemic stroke is considered to be the risk of a stroke being fatal. The risk of a stroke being fatal is given as 22% based on an average of 55-year-old men and women (Greving, Buskens, Koffijberg, & Algra, 2008). In addition to the textual explanation, Figure 2 visualises the cost calculations for the three types of patients, either with or without screening. There are no costs for patients without CVD events when no screening strategy is applied, but the once-off costs for fatal CVD events and the once-off and subsequent costs of non-fatal CVD events are incurred. When screening is applied, an annual aspirin treatment cost for patients who do not experience a CVD event is applied for the years since CVD is detected through screening until the patient dies at the same age as an individual without CVD risk factors which relates to an age of 89 (Lloyd-Jones et al., 2006). Individuals undergoing screening are aged 50 to 75 years and will be screened at different ages and will, therefore, be detected at different ages. The age of CVD detection will on average be 63 (the average of 50 to 75) and is used, within the cost calculation, as the age of detection through screening. For patients experiencing a non-fatal CVD event, aspirin treatment costs are applied since detection through screening up to the age of stroke, which is on average 76.6 years in the
Netherlands (Volksgezondheidenzorg.nl, 2018b). Thereafter, the costs incurred for non-fatal stroke patients are a once-off cost for patients with a non-fatal stroke and annual subsequent costs which are incurred for the number of survival years after stroke as shown in Table 4 below. Aspirin costs for patients experiencing a fatal CVD event are applied for the years between diagnosis through
screening and the average age of fatal strokes in the Netherlands given as 82 years
14 Figure 2 Visualisation of CVD costs
The annual or once-off costs and the survival of patients are given in Table 4 below. Table 4 Input parameters for headroom analysis (Part 3)
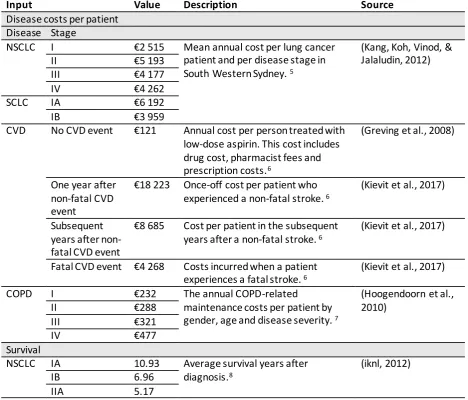
Input Value Description Source
Disease costs per patient Disease Stage
NSCLC I €2 515 Mean annual cost per lung cancer patient and per disease stage in South Western Sydney. 5
(Kang, Koh, Vinod, & Jalaludin, 2012)
II €5 193
III €4 177
IV €4 262
SCLC IA €6 192
IB €3 959
CVD No CVD event €121 Annual cost per person treated with low-dose aspirin. This cost includes drug cost, pharmacist fees and prescription costs.6
(Greving et al., 2008)
One year after non-fatal CVD event
€18 223 Once-off cost per patient who experienced a non-fatal stroke. 6
(Kievit et al., 2017)
Subsequent years after non-fatal CVD event
€8 685 Cost per patient in the subsequent years after a non-fatal stroke. 6
(Kievit et al., 2017)
Fatal CVD event €4 268 Costs incurred when a patient experiences a fatal stroke. 6
(Kievit et al., 2017)
COPD I €232 The annual COPD-related
maintenance costs per patient by gender, age and disease severity. 7
(Hoogendoorn et al., 2010)
II €288
III €321
IV €477
Survival
NSCLC IA 10.93 Average survival years after diagnosis.8
(iknl, 2012)
IB 6.96
[image:19.595.70.539.373.773.2]15
IIB 3.46
IIIA 2.36
IIIB 1.69
IV 0.93
SCLC IA 2.291
IB 0.855
CVD I 15.07 Average survival years in patients surviving at least 12 months after a non-fatal stroke. 9
(Bronnum-Hansen, Davidsen, & Thorvaldsen, 2001)
II 13.11
III 11.81
COPD I 14.0 The average survival after diagnosis of current and former smokers. 10
(Shavelle et al., 2009)
II 12.1
III 8.5
IV 8.5
5 The costs were given as a total cost spent per patient between 1 December 2005 and 31 October
2008. The costs were first adjusted from the Australian dollar to Euro with the average exchange rate from 2012 (0.8057 EUR) and then adjusted for 2019 using the Dutch consumer price index (CPI). Lastly, the costs were converted from a 35-month cost to an annual cost. Counterintuitively, the mean costs per patient do not increase with an increase in stage. In the cited study, the median costs for both small cell and non-small cell lung cancer increased with increase in stage, however, the mean costs are more relevant in this analysis.
6 The costs are adjusted for 2019 using the Dutch CPI.
7 The prevalence fraction according to age and gender was used together with the COPD-related
maintenance costs per patient by gender, age and disease severity to calculate an average cost per patient for each disease stage. Only data from patients between 50 and 75 years of age were used, as this is the initial target population group for the headroom analysis. The result is adjusted for 2019 using the Dutch CPI.
8 The 10-year survival probabilities can be transformed into constant yearly mortality rates using
Formula 1. The inverse of the mortality rate is the number of survival years after diagnosis.
9 After surviving at least 12 months after a stroke, the annual probability of mortality is 10% and
remained almost constant (Bronnum-Hansen et al., 2001). This probability is used with the corresponding life expectancy as used in the calculation for the difference in life expectancy parameter for CVD (Lloyd-Jones et al., 2006). The probability and life expectancy per stage is transformed into constant yearly mortality using Formula 1 and the inverse of this rate gives the number of expected years of survival. Five years are deducted from the values because the life expectancy values are retrieved from a population at 50 years old, while the screening population in this study starts at age 55.
10 The life expectancies of 65-year old Caucasian COPD patients are stratified over gender and current
and former smokers. The average of these life expectancies is used because the proportion of current and former smokers in the target screening population is not known. In the cited publication, the life expectancies of stage 3 and 4 patients are only presented as an aggregate, therefore the same values will be used for stage 3 and 4 COPD patients.
Assumptions based on available data
16 analysis, the assumptions were defined such that the benefits of screening are systematically
overestimated, except for the underestimation of the comorbidity utilities (point 3) due to lack of a more accurate estimate.
1. If a patient has comorbidities, the patient will have the utility of the most severe disease (thus the lowest utility of the diseases present).
2. In this analysis, the yearly incidences of diseases are detected by means of screening. The underlying assumption here, is that a disease is only detected within the first year of getting the disease, where after the disease will be detected using the current diagnostic process. 3. All patients with CVD are being treated with low-dose aspirin.
4. CVD patients get four aspirin prescriptions per year.
5. CVD patients experience only strokes. No other CVD events are included.
6. Patients with CVD who undergo screening are, on average, detected at the age of 63, which corresponds to an age halfway through the ages included in the screening program (50 to 75).
7. The cost of stages 1a and 1b non-small cell lung cancer are equal. The same assumption applies for stages 2a and 2b and stages 3a and 3b.
Varying target populations
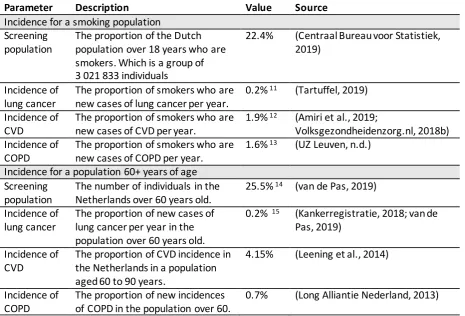
For the part of the headroom analysis where the target population is varied, additional inputs are needed. Data is gathered for a population of current smokers in the Netherlands, as well as a
[image:21.595.72.538.443.759.2]population of individuals in the Netherlands over 60 years of age. The specific lower bound for ageing individuals has been chosen based on the availability of data. The incidence rates (expressed as a percentage of patients detected in the target population) of the big-3 within these two groups are given in Table 5 below.
Table 5 Additional input parameters for two screening populations
Parameter Description Value Source
Incidence for a smoking population Screening
population
The proportion of the Dutch population over 18 years who are smokers. Which is a group of 3 021 833 individuals
22.4% (Centraal Bureau voor Statistiek, 2019)
Incidence of lung cancer
The proportion of smokers who are new cases of lung cancer per year.
0.2% 11 (Tartuffel, 2019)
Incidence of CVD
The proportion of smokers who are new cases of CVD per year.
1.9% 12 (Amiri et al., 2019;
Volksgezondheidenzorg.nl, 2018b) Incidence of
COPD
The proportion of smokers who are new cases of COPD per year.
1.6% 13 (UZ Leuven, n.d.)
Incidence for a population 60+ years of age Screening
population
The number of individuals in the Netherlands over 60 years old.
25.5% 14 (van de Pas, 2019)
Incidence of lung cancer
The proportion of new cases of lung cancer per year in the population over 60 years old.
0.2% 15 (Kankerregistratie, 2018; van de
Pas, 2019) Incidence of
CVD
The proportion of CVD incidence in the Netherlands in a population aged 60 to 90 years.
4.15% (Leening et al., 2014)
Incidence of COPD
The proportion of new incidences of COPD in the population over 60.
17
11 According to Tartuffel, 200 out of 100 000 Dutch men who smoke get lung cancer, yearly. This is
0.2% of smokers.
12 Similarly to the calculation of lung cancer incidence, the prevalence of CVD in occasional and heavy
smokers from Amiri et al. is given as 11.6%. With Dutch incidence (244 100) and prevalence (1 517 500) rates from 2018 for coronary heart disease, stroke and heart failure, it can be calculated that the annual incidence rates are 16% of the prevalence rate, which is based on the assumption that the ratio of incidence to prevalence remains constant. The product of these proportions (11.6% and 16%) results in 1.9% of Dutch smokers who are new cases of CVD.
13 From a study done at UZ Leuven, it is known that 30% of smokers develop COPD. Combined with
Dutch incidence (27 100) and prevalence (496 800) rates, which shows 5.5% incidences of the annual prevalence. These proportions combined results in 1.6% of current smokers developing COPD per year.
14 The number of individuals in the Netherlands over 60 years of age is 4 410 843. Which is 25.5%
within a population of 17 282 163.
15 The number of new lung cancer cases per 100 000 individuals are given per age group
(Kankerregistratie, 2018). This is used in combination with the population per age group (using only data from the age groups over 60 years) to determine the absolute number of new cases per year and then expressed as a percentage of individuals over 60 years of age.
Analysis outputs
The outputs of the stage distributions, influence of incidence rates and varying target populations are presented in the three parts respectively.
Stage distributions
Different stage distributions of the big-3 are presented in three scenarios. Scenario B compared to A, is used to show if screening could be beneficial compared to what the current diagnostic situation is and scenario C compared to A is added to determine what the maximum potential benefit or upper bound will be if screening would ensure detection of all patients in the least severe or first disease stage. For these scenarios (A-C), a screening population of current and former smokers between 50 and 75 years of age is used, which corresponds to 3 476 540 individuals in the Netherlands.
The results in both Table 6 and Table 7 show that screening for all big-3 diseases simultaneously will result in the largest headroom. This can primarily be ascribed to the effectiveness gap which
[image:22.595.72.536.596.701.2]indicates that the combination screening program results in the highest health gain per individual. Table 6 Outcomes of realistic screening scenario (B)
Screening for diseases:
Screening Population
Disease Population
QALY Diagnosis
QALY Screening
Effectiveness Gap
(QALY/person)
Headroom (€/person)
LC+CVD+COPD 3 476 540 155 966 -4.20 -3.14 0.0477 974
LC+CVD 3 476 540 136 752 -4.60 -3.46 0.0449 918
LC+COPD 3 476 540 43 666 -2.57 -1.82 0.0094 223
LC 3 476 540 13 262 -2.60 -1.70 0.0035 94
18 Table 7 Outcomes of perfect screening scenario (C)
Screening for diseases:
Screening Population
Disease Population
QALY Diagnosis
QALY Screening
Effectiveness Gap
(QALY/person)
Headroom (€/person)
LC+CVD+COPD 3 476 540 155 966 -4.20 -1.32 0.1293 2 828
LC+CVD 3 476 540 136 752 -4.60 -1.52 0.1212 2 667
LC+COPD 3 476 540 43 666 -2.57 -0.46 0.0265 583
LC 3 476 540 13 262 -2.60 -0.24 0.0090 213
Note: The + in the screening strategy refers to the diseases separately and as comorbidity. Thus, LC+COPD refers to detecting patients with LC, or COPD, or LC with COPD.
Influence of incidence rates
[image:23.595.75.529.348.589.2]The five scenarios explained in chapter 2.1 are depicted in Figure 3, where the headroom increases as the screening population cover a larger group of patients with the diseases. Theoretically, it is also possible to find a group of patients with higher CVD and COPD incidences than lung cancer which could result in a line above line 5. However, because this study focuses on lung cancer and the expansion thereof, it is assumed that any defined screening population would focus primarily on risk factors for lung cancer and only secondary to that focus on CVD and COPD. Thus, the incidence rates for COPD and CVD are considered not to be higher than that of lung cancer.
Figure 3 The headroom of different lung cancer, CVD and COPD risk factor combinations
The headroom values displayed in Figure 3 are much higher than in the previous results because the proportion of the disease population within the screening population is much larger. The headroom values here are thus not entirely realistic because in these hypothetical incidence combinations, an instance could exist where the absolute disease population within this screening population is larger than the actual disease population in the Netherlands. However, from Figure 3, it is rather important to notice the order of magnitude with which the headroom changes as the incidence rates change. It is clear from the graph that, when determining a target screening population for combination screening, the increase in headroom for risk factors which also increase the risk of CVD and COPD is larger than when trying to identify a group of individuals with a larger lung cancer risk.
1.Assuming no co-occurrences 2.Only LC risk factors
3.Identical COPD risk factors 4.Identical CVD risk factors
19
Varying target populations
[image:24.595.70.526.217.314.2]Using the data from Table 5 as input for the headroom analysis, the headroom is calculated and results are displayed in Table 8. These results do not differ significantly from Table 6, which is mostly due to the fact that the sizes of the screening population and the disease populations are only slightly smaller in these results. In Table 6 the screening population consists of current and former smokers between 50 and 75, in Table 8 the screening population consists of current smokers in the Netherlands over the age of 18. The results presented here, suggest that these two target screening populations will result in similar cost-effectiveness.
Table 8 Realistic Screening Results when screening the smoking population of the Netherlands
Screening for diseases:
Screening Population
Disease Population
QALY Diagnosis
QALY Screening
Effectiveness Gap
(QALY/person)
Headroom (€/person)
LC+CVD+COPD 3 021 833 108 665 -3.70 -2.75 0.0342 703
LC+CVD 3 021 833 77 963 -4.62 -3.50 0.0290 601
LC+COPD 3 021 833 51 250 -2.43 -1.74 0.0116 262
LC 3 021 833 6 044 -2.60 -1.70 0.0018 49
Note: The + in the screening strategy refers to the diseases separately and as comorbidity. Thus, LC+COPD refers to detecting patients with LC, or COPD, or LC with COPD.
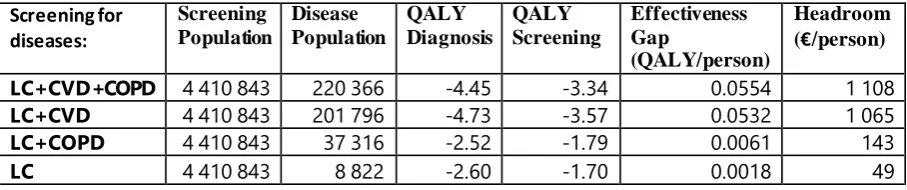
Another common risk factor for the big-3 is older age. An older group of individuals are therefore an interesting target population to consider. The headroom is calculated for individuals in the
Netherlands aged 60 years and older. This specific age group was chosen due to the availability of data for this age group.
Table 9 Realistic Screening Results when screening individuals over 60 years of age in the Netherlands
Screening for diseases:
Screening Population
Disease Population
QALY Diagnosis
QALY Screening
Effectiveness Gap
(QALY/person)
Headroom (€/person)
LC+CVD+COPD 4 410 843 220 366 -4.45 -3.34 0.0554 1 108
LC+CVD 4 410 843 201 796 -4.73 -3.57 0.0532 1 065
LC+COPD 4 410 843 37 316 -2.52 -1.79 0.0061 143
LC 4 410 843 8 822 -2.60 -1.70 0.0018 49
Note: The + in the screening strategy refers to the diseases separately and as comorbidity. Thus, LC+COPD refers to detecting patients with LC, or COPD, or LC with COPD.
The results in Table 8 and Table 9 suggest that, when comparing a target population of current smokers, or individuals over 60 years of age, the latter results in higher health benefits and a more cost-effective screening program. To determine the outcomes of an even smaller population, for whom it is expected that the incidence rates are extremely high and therefore the benefits of
screening very substantial, a population of smokers within the elderly population could be defined as the screening population. This scenario is not possible to execute yet because of a lack of data for age-specific disease incidence rates amongst smokers.
2.3. Discussion
[image:24.595.72.526.432.527.2]21
3. Systematic review
The headroom indicated potential for combined disease screening. To further investigate this potential, an in-depth cost-effectiveness analysis should be conducted. To find out how to approach this modelling problem and to find answers to some of the modelling questions identified, it is advisable to look at what other experts have done with similar problems.
A systematic review is conducted to cover the current literature on multiple disease screening programs using CT scans and particularly, to investigate questions regarding the modelling
approaches and strategies (if applicable) that were used to assess screening program impact. From literature, information is gathered about which model types have been used, how interaction and competing risks between the different diseases have been reflected, how uncertainty in co-dependence and multimorbidity is handled, how disease progression is incorporated and how screening thresholds and target populations are determined. The search is restricted to CT to reduce the search space and is chosen because this is the technology to be used in the screening program for which the headroom analysis and later a decision support model is being developed.
3.1. Methodology
Following the Preferred Reporting Items for Systematic Reviews and Meta-analysis (PRISMA) guidelines, the review was performed in Scopus and PubMed using primary search terms for finding screening programs using CT. Secondary search terms on simulation modelling and health
economics are used as previously applied in literature (Degeling, Koffijberg, & IJzerman, 2017). All the terms are searched for in the title or abstract of publications. The acronym, CT, could be present in articles referring to other concepts like carboxytherapy and Chlamydia trachomatis which was excluded in Scopus and implicitly excluded in PubMed by using MeSH terms. In the PubMed search strategy, the term costs* was added in addition to cost*, because of a warning mentioning that only the first 600 extensions of cost* could be included.
The following search queries were used:
Scopus: ( TITLE-ABS (screen* OR "early detect*") AND ( TITLE-ABS ( comput* PRE/15 tomograph* ) OR TITLE-ABS ( "ct" ) ) AND TITLE-ABS ( model* OR simula* ) AND TITLE-ABS ( *effect* OR *util* OR *benefit* OR cost* OR decision-anal* ) ) AND NOT (chlamydia OR carbox* ) And
PubMed: ( screen* [Title/Abstract]OR "early detect*" [Title/Abstract] ) AND computed tomography [MeSH Terms] AND (model* [Title/Abstract] OR simula* [Title/Abstract] ) AND (*effect*
[Title/Abstract] OR *util* [Title/Abstract] OR *benefit* [Title/Abstract] OR cost* [Title/Abstract] OR costs* [Title/Abstract] OR decision-anal* [Title/Abstract] ) )
The systematic review follows the PRISMA guidelines of which the completed steps are shown in Figure 4. During the identification phase, 1075 results were found through Scopus and 474 results were found through PubMed when the final search was conducted on 6 November 2019. Due to overlap in these databases, 307 duplicate publications were found, and these were removed from the set of results. The abstracts of the remaining 1242 publications were read where 1210 papers were excluded based on the following reasons in the given order:
In the Scopus search,
- the acronym “CT” used in the publication does not refer to any form of computed tomography (n=119)
22 - the publication is not on population screening (n=627)
- the study only focuses on a single disease (n=401).
In the last exclusion criterium, publications which reported on screening for one disease in individuals with another, previously diagnosed, disease were still included. This screening phase resulted in 31 publications remaining for full-text assessment, from which 7 papers were excluded because screening strategies for the different diseases were separately evaluated with different screening target populations or because screening was merely a suggestion following some other analysis, with no concrete plans to implement or assess the mentioned screening program.
Records identified through database
searching (n = 1 549)
Sc
re
e
ni
ng
Id
e
n
ti
fi
ca
ti
o
n
Records after duplicates removed (n = 1 242)
Records screened (abstract and title)
(n = 1 242)
Records excluded (n = 1 211)
El
ig
ibi
li
ty
Full-text articlesassessed for eligibility (n = 31)
In
cl
ud
e
d
Full-text articles excluded
(n = 7)
• Separate evaluation of diseases (n=3)
• Screening only mentioned as alternative or suggestion for future work (n=4)
Studies included in qualitative synthesis
(n = 24)
23 From the remaining 24 publications, the full text was evaluated to extract information regarding general aspects, diseases, evaluation, evidence and modelling aspects. General aspects include publication year and journal, which country was the screening program intended for and which type of CT scan was evaluated. Regarding the disease, it is interesting to know which diseases were screened for. For evaluation aspects, from the papers which included cost-effectiveness, cost-utility or other quantitative health economic analyses, it is interesting to note which type of models were used, which outcome measures were used, and which screening options or strategies were
compared. Evidence related information extracted includes where data was retrieved from including prevalence, probability of disease progression, care pathway followed etc. If the evaluation used some form of modelling, it is valuable to know how the co-morbidity/interactions between diseases have been incorporated into the decision model, how the disease progression was modelled and how the risk-group or target population was determined.
3.2. Results
The full-text review contained papers with many different disease combinations being evaluated for screening using CT. The most common combination of diseases is lung cancer combined with CVD. The final studies included in the qualitative synthesis screened for lung cancer (LC) given that a patient has COPD (n=4), CVD (including CAC) (n=5), chronic thromboembolic pulmonary hypertension (CTEPH), a type of smoking-attributable disease or Hodgkin lymphoma (n=1). There was also
screening in the form of a full-body scan screening for six types of cancers (ovarian, pancreatic, lung, liver, kidney, and colon cancer), abdominal aortic aneurysm (AAA) and coronary artery disease (CAD) (n=1) and full-body scans for any actionable diseases in the lungs, heart or abdomen. More diseases screened for include colorectal cancer (CRC) and AAA (n=1), CRC and adenomatous polyps (n=1), CAC in HIV-positive patients (n=2), CVD in patients with type-2 diabetes (n=1), LC in HIV-positive patients (n=1), CVD and female reproductive diseases (n=1), cystic lung diseases in patients with spontaneous pneumothorax (n=1), a range of cancers (lung, esophagus, stomach, colon, rectum, liver, gall bladder, pancreas and kidneys, in addition to prostate cancer screening for men and breast, cervical,
endometrial and ovarian cancer screenings for women) (n=1) as well as CRC with extracolonic neoplasms and AAA (n=1).
Based on the research question stated in chapter 1, it is important to review the methodology used in papers conducting cost-effectiveness analyses, in detail. From the final studies included, seven papers conducted a cost-effectiveness analysis and a summary of the findings for these papers are included in the first seven lines of Appendix B. From these papers, five used Markov modelling from which three used specifically state transition modelling. One used microsimulation and the other used a Monte Carlo decision analytical model. All studies compared two to three predetermined screening strategies or no-screening. Data was gathered from different resources, but all data came from publications, health insurers and hospitals. In terms of disease interaction and comorbidity, modelling and assumptions thereof were not always clear.
Two papers assumed the occurrence of diseases to be mutually exclusive. This assumption does not deal with comorbidity but rather assumes that the co-occurrence of diseases is not possible. This was assumed in screening for Coronary Artery Disease (CAD) in HIV-positive patients, where the
occurrence of moderate or severe obstructive CAD, CHF and having no cardiac disease are modelled as mutually exclusive events (Nolte et al., 2014). Similarly, when screening for CRC and AAA