Original citation:
Rees, Gregory J., Day, Stephen P., Lari, Alberth, Howes, Andrew P., Iuga, Dinu, Pitak,
Mateusz B., Coles, Simon J., Threlfall, Terry L., Light, Mark E., Smith, Mark E., Quigley,
David, Wallis, John D. and Hanna, John V.. (2013) A multinuclear solid state NMR,
density functional theory and X-Ray diffraction study of hydrogen bonding in Group I
hydrogen dibenzoates. CrystEngComm, Volume 15 (Number 43). pp. 8823-8839.
Permanent WRAP url:
http://wrap.warwick.ac.uk/58089
Copyright and reuse:
The Warwick Research Archive Portal (WRAP) makes this work of researchers of the
University of Warwick available open access under the following conditions.
This article is made available under the Creative Commons Attribution-NonCommercial
3.0 (CC BY-NC 3.0) license and may be reused according to the conditions of the
license. For more details see:
http://creativecommons.org/licenses/by-nc/3.0/
A note on versions:
The version presented in WRAP is the published version, or, version of record, and may
be cited as it appears here.
PAPER
Cite this:CrystEngComm, 2013,15, 8823
Received 28th June 2013, Accepted 6th September 2013
DOI: 10.1039/c3ce41258j
www.rsc.org/crystengcomm
A multinuclear solid state NMR, density functional
theory and X-Ray diffraction study of hydrogen
bonding in Group I hydrogen dibenzoates
†
Gregory J. Rees,
aStephen P. Day,
aAlberth Lari,
bAndrew P. Howes,
aDinu Iuga,
aMateusz B. Pitak,
cSimon J. Coles,
cTerry L. Threlfall,
cMark E. Light,
cMark E. Smith,
adDavid Quigley,
aJohn D. Wallis*
band John V. Hanna*
aAn NMR crystallographic approach incorporating multinuclear solid state NMR (SSNMR), X-ray structure determinations and density functional theory (DFT) are used to characterise the H bonding arrangements in benzoic acid (BZA) and the corresponding Group I alkali metal hydrogen dibenzoates (HD) systems. Since the XRD data often cannot precisely confirm the proton position within the hydrogen bond, the relationship between the experimental SSNMR parameters and the ability of gauge included plane augmented wave (GIPAW) DFT to predict them becomes a powerful constraint that can assist with further structure refinement. Both the1H and13C MAS NMR methods provide primary descriptions of the H bondingviaaccurate measurements of the1H and13C isotropic chemical shifts, and the individual13C chemical shift tensor elements; these are unequivocally corroborated by DFT calculations, which together accurately describe the trend of the H bonding strength as the size of the monovalent cation changes. In addition,17O MAS and DOR NMR form a powerful combination to characterise the O environments, with the DOR technique providing highly resolved17O NMR data which helps verify unequivocally the number of inequivalent O positions for the conventional
17O MAS NMR to process. Further multinuclear MAS and static NMR studies involving the quadrupolar7Li,39K,
87Rb and133Cs nuclei, and the associated DFT calculations, provide trends and a corroboration of the H bond
geometry which assist in the understanding of these arrangements. Even though the crystallographic H positions in each H bonding arrangement reported from the single crystal X-ray studies are prone to uncertainty, the good corroboration between the measured and DFT calculated chemical shift and quadrupole tensor parameters for the Group I alkali species suggest that these reported H positions are reliable.
Introduction
The characterisation of hydrogen bonds between organic or biological molecules studied by 1H, 13C and 15N solid state NMR has become very common in the past few decades.1–6 Hydrogen bonding has a critical role in the higher order struc-ture formation in proteins, DNA, RNA, polymers and in more general crystal packing and self-assembly phenomena;7–9it is
interesting to note that a new definition of hydrogen bonding has been published recently by an IUPAC task force.10 Hydro-gen bonding is commonly studied by infra-red (IR) spectros-copy, solution state NMR and neutron diffraction.11–13Neutron diffraction is a facile method of measuring the hydrogen bond-ing interaction as it gives precise atomic positions and bond lengths.14The IR stretching frequencies have been shown to be proportional to these distances determined by neutron diffrac-tion, however it suffers from the limitation of resolution when multiple hydrogen bonded sites are present in the sample.15–17 Solid state NMR (SSNMR) is a powerful technique for the eluci-dation of the local structure by providing a description of the short-range environment around each nucleus, which naturally complements the longer-range structural information obtained by diffraction techniques.
Most SSNMR studies of H bonding arrangements have tra-ditionally focussed on the more straightforward spin-½ nuclei (i.e.1H,13C,15N) that are typically engaged in this structural motif.3,4,18,19 However, with the availability of much higher magnetic field strengths and a greater understanding of the
aDepartment of Physics, University of Warwick, Gibbet Hill Road, Coventry,
CV4 7AL, UK. E-mail: [email protected]; Fax: +44 (0)247 6150954; Tel: +44 (0)247 6150806
bSchool of Science and Technology, Nottingham Trent University, Clifton Lane,
Nottingham, NG11 8NS, UK. E-mail: [email protected]; Fax: +44 (0)115 8488077; Tel: +44 (0)115 8488053
cNational Crystallography Service, School of Chemistry, University of
Southampton, Southampton, SO17 1BJ, UK. E-mail: [email protected]; Fax: +44 (0) 238 0596723; Tel: +44 (0) 238 0596721
dLancaster University, Bailrigg, Lancaster, LA1 4YW, UK. E-mail: m.e.
[email protected]; Fax: +44 (0)152 4592001; Tel: +44 (0)152 592001
†Electronic supplementary information (ESI) available. CCDC numbers 940110–940116. For crystallographic data in CIF or other electronic format. see DOI: 10.1039/c3ce41258j
Open Access Article. Published on 06 September 2013. Downloaded on 20/10/2014 16:25:35.
This article is licensed under a
Creative Commons Attribution-NonCommercial 3.0 Unported Licence.
View Article Online
experimental methodologies required to treat quadrupolar (I > ½) nuclei, 17O static and magic-angle-spinning (MAS) NMR have now become a routine analytical tool for many chemical and materials systems, including those which are characterised by H bonding schemes.20–27
Earlier work on small organic molecules and biological systems has attempted to describe the‘strength’of the H bond using the precise measurement of one or more NMR interac-tion parameter(s).18,19,28–35 From both the 1H solution and solid state MAS NMR studies the1H isotropic chemical shift (δiso) of the carboxylic acid protons was shown to vary substan-tially over a 10–25 ppm range as the deshielding (i.e.tendency to higher ppm values) increases with the increased H bond character.28,30–32For example, previous1H measurements have reported a value of δiso12.7 ppm for the carboxyl proton in benzoic acid (BZA).31
Other studies have focussed on the 13C carboxylic acid chemical shift anisotropy (CSA) and the sensitivity of specific tensor components towards the H bonding phenomena. As depicted in Fig. 1, the δ11element of the CSA tensor repre-sents the least shielded (most downfield) component of the 13C static lineshape, and it has been shown to shift to a lower
ppm value (upfield) upon deprotonation and shift to a higher ppm value when protonated. The δ33 element is the most shielded (i.e.most upfield) component and it has been dem-onstrated to be located within the plane of the CO2H func-tional group, while theδ22element is aligned along the CO bond and varies substantially with the H bond length.4,18In a similar fashion, the17O CS and EFG tensorial elements of the 17O SSNMR resonance exhibit similar trends and have been reported to exhibit considerable variation with the decreasing H bond length. Preceding work on carboxylic acid-bearing systems has determined that theδ11element of the O–H moiety, and the δ22 element of the CO moiety comprising the CO2H group are aligned nearly parallel with the strong H bond vector, and they shift away and become misaligned as the H bond strength decreases (i.e. H bond length increases).20,35 Wu et al. have previously undertaken 17O MAS NMR studies on a range of small molecules which
included benzoic acid (BZA) and potassium hydrogen dibenzoate (KHD) and measured the electric field gradient and chemical shift tensors. These studies confirmed previous nuclear quadrupole resonance (NQR) measurements, and from the deconvolution of these tensorial interactions it was deduced that the hydrogen bond distance was reflected in the anisotropic parameters.24,25
In this work, a combined multinuclear solid state nuclear magnetic resonance (SSNMR), X-ray diffraction (XRD) and density functional theory (DFT) approach to the study of the H bonding in benzoic acid (BZA) and the full series of its corresponding Group I alkali metal (Li, Na, K, Rb and Cs) hydrogen dibenzoate/dihydrogen tribenzoate salts is pre-sented. The Li, Rb and Cs hydrogen dibenzoate (HD) and the Na dihydrogen tribenzoate (DT) variants are a novel and unreported family of structures which represent how the increasing ionic radius of a monovalent cation can perturb the hydrogen bonding arrangement. From this structural series, the corresponding influences of both the H bonding arrangementandthe Group I metal cation size upon the 1H, 13C and 17O NMR tensorial interactions can be measured,
with the long-range periodicity and short-range hydrogen bonding arrangement around the metal site being rationalised by density functional theory (DFT) calculations.
Tightly H bonded systems can be classified into two pre-dominant groups differentiated by the specific types of intermolecular bonding between carboxylic groups; these have been confirmed by work on the relevant crystal struc-tures.36Type A occurs when two carboxyl groups are related by a symmetry element in the crystallographic frame, hence there is effectively one O environment present due to the proton oscillation between these adjacent O positions with the averaged H position sitting symmetrically disposed between them. Type B is relevant when the two carboxyl groups are chemically inequivalent and thus not symmetry related; in this case the proton is disposed closer to one of the carboxylate groups effectively creating two different oxy-gen positions (as in the case of BZA). The hydrooxy-gen dibenzoate (HD) system has the potential to form H bonds between the carboxylate and carboxylic acid groups, and have been notionally described as ‘negative charge assisted hydrogen bonds’.37 The aim of this study is to invoke an NMR crystallography approach to analyse the true type of H bonding arrangement in the Group I alkali metal (Li, K, Rb and Cs) hydrogen dibenzoate salts, although correspond-ing studies on the NaTD are not reported since only a few via-ble crystals suitavia-ble for an X-ray structural analysis were isolated. Through the use of accurate energy minimization and geometry optimisation algorithms in fully periodic CASTEP 6.01 DFT code, the refinement of the proton position in each H bonding scheme and the subsequent NMR parame-ter calculation should provide an accurate description when constrained against experimental 1H MAS NMR measure-ments and XRD data. This primary level of description will facilitate a more involved analysis of the13C CSA tensor, and the 17O CSA and EFG tensors, as the increasing ionic radius
Fig. 1 A schematic representation of the (a)13C chemical shift (CS) tensor, and
(b)17O chemical shift and electric field gradient (EFG) tensors involved in carboxylic hydrogen bonded systems.
Open Access Article. Published on 06 September 2013. Downloaded on 20/10/2014 16:25:35.
This article is licensed under a
[image:3.595.43.291.535.686.2]of the monovalent Group 1A cation directly perturbs both the H bonding arrangement and the carboxylate group.
Results and discussion
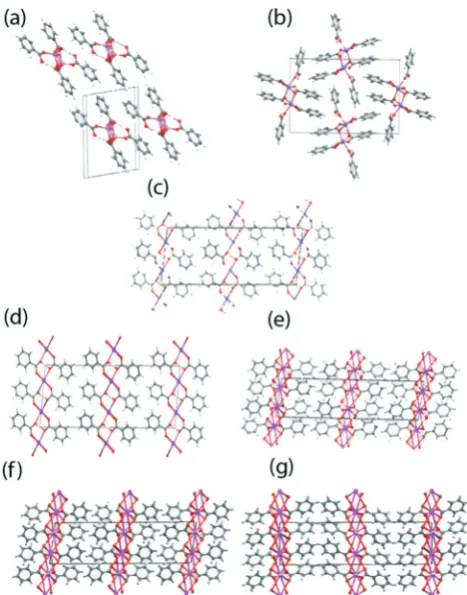
CrystallographyThe crystallographic structure determination of BZA has been previously completed by numerous workers, with the relatively recent neutron diffraction study performed at 20 K by Wilson et al.38 being chosen for the DFT calculations. The hydrogen dibenzoates of Li, K, Rb and Cs were prepared by the reaction of BZA with half an equivalent of the corre-sponding metal hydroxide under conditions where the prod-uct slowly crystallised from the reaction mixture. The corresponding reaction with sodium hydroxide gave crystals of a 1 : 2 benzoate : benzoic acid complex better referred to as a dihydrogen tribenzoate (DT) complex.39The Li, Rb and Cs hydrogen dibenzoates (HD) and the NaDT complex, have not been previously reported. The crystal structures of these materials were determined at a low temperature (typically 120 K) and their coordination motifs and crystal packing schemes are given in Fig. 2 and 3, respectively, with their structural parameters summarised in Table 1. A reproducible method of crystallising the NaDT complex was not identified, with only a few viable crystals being isolated for an X-ray structural analysis; hence, no SSNMR studies have not been reported for this system. All the structures contain M2O2 rings where M is the alkali metal ion and the O atoms come from two benzoate anions. These are roughly square in shape, and formed into one dimensional polymers in the case of the Li and Na salts, and into two dimensional poly-mers for K, Rb and Cs so that the coordination number is 6 or 8, the former being the one commonly isolated for RbHD.
For LiHD two Li atoms and an O atom from each of two benzoate anions form a centrosymmetric Li2O2grouping, and the second oxygen atoms from the two benzoates act as
coordinating ligands to the next Li2O2 ‘squares’ in the +a and−adirections to form the coordination polymer, in which the‘squares’are linked by an eight-membered ring involving four O, two C and two Li atoms (see Fig. 2(a) and 3(a)). A benzoic acid molecule completes the structure, with the car-bonyl oxygen atom providing the fourth coordination site at the Li position, and the −OH group forming a H bond with the benzoate O atom. The CO and C–O bonds of the benzoic acid are clearly distinguished (1.231(2) and 1.316(2) Å). There are thus four distinct O atom environments: an OH, a CO group which coordinates one Li, and two benzoate O atoms, one of which coordinates one Li ion and forms a H bond, while the second one coordinates two Li ions as part of the Li2O2 square. The NaDT crystal structure is related to the LiHD structure but an additional benzoic acid molecule coordinates Na ions of adjacent “squares” by its carbonyl O and by its hydroxyl O, so expanding the metal coordination number to 6. The OH group of this benzoic acid also forms a hydrogen bond with the linking benzoate O atom which is thus involved in two roughly perpendicular H bonds as well as coordinating one Na ion, while the second benzo-ate O atom is just involved in a Na2O2 square (see Fig. 2(b) and 3(b)).
The crystal structures of the K, Rb and Cs hydrogen dibenzoates comprise two-dimensional coordination poly-mers with tight hydrogen bonds in which the O⋯O
Fig. 2 The local coordination motifs for the (a) LiHD, (b) NaDT, (c) KHD and
(d) monoclinic CsHD systems.
Fig. 3 The crystal packing schemes for the (a) LiHD, (b) NaDT, (c) KHD, (d) RbHD
(6 coordinate monoclinic), (e) RbHD (8 coordinate monoclinic), (f) CsHD (monoclinic) and (g) CsHD (orthorhombic) systems.
Open Access Article. Published on 06 September 2013. Downloaded on 20/10/2014 16:25:35.
This article is licensed under a
[image:4.595.311.545.41.339.2] [image:4.595.46.288.495.693.2]Table 1 T h e u n it cel l p ar am e te rs a n d ke y g eo m e tr ic m e a su rem e n ts fo cu ss in g o n th e H b o n d in g a rr a n g e m e n ts fo r th e Li H D , N a D T ,K H D , R b H D (6 a n d 8 co o rd in a te p o ly m o rp h s) a n d C sH D (m o n o cl in ic a n d o rt h o rh o m b ic p o ly m o rp h s) sys te m s a s de te rm in ed b y X R D st ru ct u re d e te rm in at io n .N o g e o m et ry o p ti m isa ti o n o f th e a to m ic p o si tio n s by D FT m et h o d s is p re se n te d h e re . T h is w as o n ly u n d er ta ke n o n th e D FT ca lcu la ti o n o f th e N M R p a ra m e te rs an d ch a n g e s in th e a to m ic p o si ti o n s ar e n o te d in CC D C .† Sample Li H(PhCO 2 )2 Li HD Na(P hCO 2 ) · 2(Ph CO 2 H) NaDT KH( PhCO 2 )2 KHD RbH(PhC O2 )2 6-coordin ate RbH D (6) RbH(PhC O2 )2 8-coordin ate RbH D (8) CsH(Ph CO 2 )2 monoc linic CsHD ( m ) CsH(Ph CO 2 )2 ortho-rhomb ic CsH D ( o ) Crysta l system tri clinic mon oclin ic mon oc linic monoc linic monoc linic monoc linic orthorh ombi c a /Å 5.3 600(3) 5.8077(1) 29. 586(2) 29.347(4) 29.0315(9) 28.9095(8) 28.3393(19) b /Å 8.5 693(7) 14.4331(4) 3.7 964(3) 3.8697(5) 6.9630(2) 7.0509(2) 7.0215(3) c /Å 13. 4999(11) 22.0139(6) 11. 1214(8 ) 11.3973(16) 6.6156(2) 6.7779(2) 6.9066(4) α / ° 98. 830(4) 90 90 90 90 90 90 β / ° 93. 800(5) 97.047(2) 97. 096(9) 95.478(7) 99.297(2) 99.970(2) 90 γ / ° 95. 524(5) 90 90 90 90 90 90 V /Å 3 607.80(8) 1831.33(8) 123 9.59(16) 1288.4(3) 1319.75(7) 1360.73(7) 1374.31(14) Spac e grou p P 1¯ P 21 / cC 2/ cC 2/ cC 2/ cC 2/ c Pbcn Z 2 4 4 444 4 T /K 120 120 120 100 120 120 150 R ( F , F 2 > 2 Θ ) 0.0 54 0.041 0.0 43 0.025 0.028 0.046 0.031 Coord inati on numbe r a t M 4 6 6 688 8 O – H – O/Å, 1.0 3(3) 0.87(2) 0.8 4(3) 1.2374(13) 1.249(13) 1.236(8) 1.233(5) 1.5 9(3) 1.80(2) 1.6 2(3) 1.2374(13) 1.249(13) 1.236(8) 1.233(5) O – O/Å; 2.6 128(17) 2.6641(14) 2.4 56(3 ) 2.475(3) 2.456(3) 2.457(3) 2.457(3) O – H – O/ ° 171(3) 173(3) 174 (4) 180 * 159(6) 167(6) 170(7) O – H – O/Å, 0.92(2) 1.64(2) O – O/Å; 2.5625(14) O – H – O/ ° 177(2) o O – C – O/Å 1.2 57(2) 1.2482(15) 1.2 44(2) 1.243(2) 1.233(3) 1.229(2) 1.225(3) 1.2 73(2) 1.2847(15) 1.2 93(2) 1.298(2) 1.298(3) 1.302(3) 1.299(4) 1.2 31(2) 1.2273(16) 1.3 16(2)
1.3194(16) 1.2192(17) 1.3262(17)
M2 O2 ri ngs: 1.9 19(3) 2.3326(10) 2.6 895( 14) 2.8206(13) 2.9641(18) 3.0631(13) 3.063(2) M – O x 2/Å; 1.9 81(3) 2.3859(10) 2.8 110(14) 2.9688(13) 2.9956(19) 3.0660(14) 3.090(2) angle at M and O/ ° 92. 22(13) 84.00(4) 90. 09(6) 92.89(5) 81.11(5) 80.91(4) 80.86(6) 87. 78(13) 96.00(4) 95. 39(6) 99.42(5) 98.89(5) 99.09(4) 99.14(6) 87. 26(4) 83.85(4) 3.1561(19) 3.2230(14) 3.231(2) 3.210(2) 3.2459(15) 3.286(2) 73.77(5) 75.15(4) 74.80(6) 106.23(5) 104.85(4) 105.20(6) M – O 1.9 18(3) 2.3322(11) 2.7 641(14) 2.9448(15) outsi de M2 O2 ri ng/Å 1.9 75(3)
2.3436(11) 2.6461(11) 2.6693(10)
Open Access Article. Published on 06 September 2013. Downloaded on 20/10/2014 16:25:35.
This article is licensed under a
separations lie in the narrow range of 2.456–2.475 Å; these distances are significantly shorter than in the Li and Na salts (2.562–2.664 Å). In the monoclinic KHD salt the six-coordinate K ions are organised in layers perpendicular to the a axis (see Fig. 2(c) and 3(c)). There are chains of coplanar K2O2 motifs which share K ions running along the
bdirection, with the line of K ions lying on a two-fold axis. In contrast the M2O2motifs in the Li and Na salts are centro-symmetric and do not share metal ions. The benzoate O atoms belonging to the K2O2 motifs are not involved in H bonding, while the second benzoate O atoms coordinate K ions in adjacent lines and so eight-membered rings are formed. The acidic H atom is located between two O atoms of this ring. These two O atoms are 2.456(3) Å apart, and related by a centre of symmetry. Difference electron density maps showed two positions for this H atom, which were refined as each 50% occupied (O–H: 0.84(3)); H⋯O: 1.62(3) Å, angle at H: 174(4)°). RbHD is isostructural to KHD and con-tains six-coordinate Rb ions (Fig. 3(d)). The difference elec-tron density map did not show clear evidence for two positions for the (O)H atom and so the H atom is positioned on a centre of symmetry between the two O atoms which are 2.475(3) Å apart. The H atom refined with a large isotropic displacement parameter (0.083(17) Å2), indicative of some disorder in its position. On one occasion a crystal of a poly-morph with eight-coordinate Rb ions was obtained (Fig. 3(e)) and this is isostructural with the monoclinic Cs analogue described below. Powder diffraction data shows that the six-coordinate polymorph is predominant in our samples of RbHD. The CsHD analogue has two polymorphs, one crystallising in the monoclinicC2/cspace group and the other crystallising in the orthorhombic space group Pbcn, although their overall crystal packing arrangements are very similar (see Fig. 3(f) and 3(g)). The eight-coordinate Cs ions are organised in layers and coordinated by benzoate anions such that each metal ion is involved in four centrosymmetric Cs2O2 rhombus-like motifs, two formed by bonds to non-H bonded benzoate O atoms and two by longer bonds to the H bonded benzoate O atoms. In the monoclinic phase the H bonds between these latter rings involve two O atoms 2.457(3) Å apart, and these two O atoms subtend an angle of 44.49(4)°at the Cs position. A similar observation was made for the isostructural Rb poly-morph. For the orthorhombic phase of CsHD the unit cell lengths are very similar to those of the monoclinic phase, but theβangle has decreased by ~10°(90v99.97°). There is a significant amount of crystallographic evidence for such symmetrical O–H–O hydrogen bonds (vide supra), and it is notable that we have both symmetrical and unsymmetrical tight O–H–O hydrogen bonds among the K, Rb and Cs hydrogen dibenzoates, though we emphasize that for the Rb and Cs salts, there is less certainty in the interpretation of the electron density in the O–H–O region, and the high isotro-pic displacement parameter for the H atom in these cases may indicate variation in the position of the H atom. The nearest comparison is to the neutron diffraction studies on K and Cs hydrogen trifluoroacetates which both show short
symmetrical O–H–O hydrogen bonds with an O⋯O separation of 2.436 Å and isotropic displacement parameters of 0.016 Å2 for both salts at 20 K.39Future neutron diffraction studies on the hydrogen dibenzoate salts will provide useful further insights. More complete descriptions of these crystal struc-tures are available in the ESI.†
Solid State NMR
The1H MAS NMR data from BZA and the Group I (Li, K, Rb, Cs) HD systems is shown in Fig. 4, and the measured and GIPAW DFT calculated 1H chemical shift tensor information is summarised in Table 2. Each 1H MAS NMR spectrum exhibits multiple resonances which represent the individual proton environments in each sample, with the majority of the resonances in each spectrum belonging to the aromatic region. However, there is a distinct downfield resonance at δiso > 10 ppm which is indicative of a deshielded proton participating in a H bond arrangement. The BZA and LiHD systems reveal resonances at δiso 13.2 and δiso 13.0 ppm, respectively, which represent comparatively weak H bonding
Fig. 4 Fast1H MAS NMR data (νr= 27.5 kHz,ν0 =500.1 MHz) acquired from
(a) BZA, (b) LiHD, (c) KHD, (d) RbHD and (e) CsHD. The hydrogen bonded proton is marked in the shaded grey region.
Open Access Article. Published on 06 September 2013. Downloaded on 20/10/2014 16:25:35.
This article is licensed under a
[image:6.595.306.543.306.685.2]scenarios. The shift ofδiso13.2 ppm for BZA obtained from a fast1H MAS experiment at 11.7 T differs from a previously reported value ofδiso12.7 ppm which was obtained using the 1H CRAMPS method, and probably suffers from poorer
reso-lution due to much slower MAS frequencies and a lower mag-netic field strength.31An increase in the monovalent cation ionic radius causes a dramatic downfield shift in the reso-nance position toδiso 20.8, 20.2 and 20.9 ppm for the KHD, RbHD and CsHD salts, respectively. These large deshielded shifts are indicative of tight H bonds which has been facili-tated by the changing coordination around the alkali metal centre (from the initial BZA dimeric structure) as the increas-ing size of the alkali cation influences the type of H bondincreas-ing observed. From Table 1 the coordination number around the Li metal centre is 4, around the K and Rb centres it is 6, and
around the Cs position it is 8. The increasing ionic radius of each metal centre impacts upon the resultant strength of the each H bond.
Theab initioGIPAW DFT calculations of the1H chemical shift tensor parameters using the CASTEP code confirms these observations (see Table 2). They accurately predict the experimentally observed downfield shift in δiso of ~8 ppm upon moving from BZA and LiHD to the K, Rb and Cs HD structures bearing the larger cations. Furthermore, they also corroborate the observation that the BZA dimer has a margin-ally more deshielded proton when directly compared to the LiHD. For the purposes of this study, the H bonding in the BZA and LiHD systems can be described as weak while the bonds in the heavier Group I alkali metal HD analogues (KHD, RbHD and CsHD) can be described as strong.
Fig. 5 13C MAS NMR data using variable MAS frequencies ofνr= 12, 1.5 and 0.8 kHz (ν0= 100.3 MHz) obtained from (a) BZA, (b) LiHD, (c) KHD, (d) RbHD and (e) CsHD.
The respective Simpson41simulations of the CASTEP parameters atν
[image:7.595.54.552.71.182.2]r= 0.8 kHz (ν0= 100.3 MHz) for (f) BZA, (g) LiHD, (h) KHD, (i) RbHD and (j) CsHD are shown below. Table 2 The1H and13C chemical shift tensor data measured by1H MAS and13C CPMAS NMR, and calculated using GIPAW DFT (NMR-CASTEP) methods for the
13
C carboxyl labelled benzoic acid (BZA) and hydrogen dibenzoate (HD) systems
Sample
δiso(MAS)
1Ha δ
iso
1H δ13iso(MAS)Cb δ iso(CSA)
13Cc δ
1113C
δ22
13C δ1333C Ωd Kd Δδe η
δe
δiso(CSA)
13Cf δ
11
13C δ1322C δ1333C Ω κ Δδ η
CASTEP CASTEP CASTEP CASTEP
Site O⋯1HO −13COOH −13COOH −13COOH −13COOH −13COOH −13COOH
Error (ppm/±)
±0.25 ±0.5 ±2g ±2 ±2 ±2 ±2 ±0.05 ±2 ±0.05
BZA 13.2 14.5 172 172 223 187 107 116 0.38 −98 0.54 172 246 174 97 149 0.03 −113 0.96
LiHD 13.0 13.2 174 174 227 189 105 122 0.38 −103 0.54 172 241 180 95 146 0.16 −115 0.79
KHD 20.8 21.2 176 175 237 179 108 130 0.12 −101 0.86 176 247 178 103 176 0.04 −109 0.95
RbHD 20.2 20.7 176 176 243 178 107 135 0.05 −104 0.93 175 243 184 98 145 0.18 −115 0.77
CsHD 20.9 21.1 173 173 242 169 109 133 −0.10 103 0.86 173 233 192 93 140 0.42 −120 0.51
aDirectly measured from the experimental1H MAS NMR data.bDirectly measured from the experimental13C CPMAS NMR data.cCalculated
as the average of the experimentally derivedδ11,δ22,δ33values;δiso(CSA)= (δ11+δ22+δ33)/3.dHerzfeld–Berger shift convention:δ11≥δ22≥δ33,
δiso= (δ11+δ22+δ33)/3,Ω= (δ11−δ33),κ= 3(δ22−δiso)/ (δ11−δ33) (1≥κ≥ −1).eHaeberlen shift convention:|δ33−δiso|≥|δ11−δiso|≥|δ22−δiso|,
δiso= (δ11+δ22+δ33)/3,Δδ=δ33−1/2(δ11+δ22) = 3/2(δ33−δiso),ηδ= (δ22−δ11)/ (δ33−δiso) (1≥ηδ≥0).fCalculated as the average of the NMR-CASTEP calculatedδ11,δ22,δ33values;δiso(CSA)= (δ11+δ22+δ33)/3.gDetermined by root-mean-square (RMS) statistical analysis.
Open Access Article. Published on 06 September 2013. Downloaded on 20/10/2014 16:25:35.
This article is licensed under a
[image:7.595.49.548.452.696.2]The corresponding13C MAS NMR data from these systems were acquired using the cross-polarisation (CP) technique and isotopic13C labelling of the carboxylic acid functionality to maximise the accuracy of the13C CSA measurements. Each 13C CPMAS NMR measurement captured the CSA manifold
under slow MAS conditions, with the data being acquired at spinning frequencies of νr = 0.8, 1.5 and 12 kHz to allow a detailed sideband analysis to be undertaken. These13C CPMAS NMR spectra are shown in Fig. 5 and the measured chemical shift tensor data are collated in Table 2. The 13C CSA data yields tensorial information for the CO2H site which has pre-viously been shown to be proportional to the H bond strength.3,4,18This is clearly demonstrated by the δ22tensor element in this series of data which is aligned along the CO bond and prone to variation with the H bond length. From Table 2 it can be observed thatδ22= 187.1 and 189.2 ppm for the more weakly H bonded BZA and LiHD systems, respec-tively, and this element systematically shifts upfield toδ22= 179.3, 178.4 and 168.6 ppm for the more strongly H bonded KHD, RbHD and CsHD systems, respectively. The13C isotro-pic chemical shift values measured directly by simulation of each fast MAS spectrum (δiso(MAS)) and by averaging the individual tensorial components (δiso(CSA)= (δ11+δ22+δ33)/3) are in excellent agreement, thus verifying the accuracy of the
sideband analysis. However, neither of these isotropic values, or the other CSA tensor elementsδ11andδ33, exhibit a system-atic correlation with the H bonding strength or increasing cation size.
The GIPAW DFT calculations of the13C chemical shift tensor parameters using the CASTEP code are also summarised in Table 2. Although the calculated values of δiso(CSA) agree well with δiso(MAS) and δiso(CSA) values derived from measurement, there is some disparity between the trends displayed by the indi-vidual tensor elements. In particular, the calculated δ22values display a trend that is opposite to that of itsδ22 experimental counterpart. This suggests that the calculated δ11,δ22 and δ33 values possess systematic errors that cancel when considering the total average value (i.e.δiso(CSA)), and these values may be influenced by the large amplitude motion and delocalised nature of the H position in the H bond. Furthermore, the mea-sured and calculated composite parameters such asΩ,κ,Δδand ηδalso show no discernible correlation, as evidenced in Table 2 and the direct comparisons shown in Fig. 5. As motion is deemed to be the primary source of this error, SEDC (disper-sion correction) calculations were invoked and they show no improvement on the original data trends (see ESI†).
The O sites present in the hydrogen dibenzoate systems which participate directly in the H bond are an excellent
Fig. 6 17O MAS NMR data acquired atB0= 14.1 and 9.4 T (νr= 27.5 kHz,ν0= 81.33 and 54.22 MHz) for (a) BZA, (b) LiHD, (c) KHD, (d) RbHD and (e) CsHD are compared
with 17O central transition lineshapes simulated from CASTEP derived δiso,CQ and ηQ values using Simpson for (f) BZA, (g) LiHD, (h) KHD, (i) RbHD and (j) CsHD.
The deconvolution of these experimental and calculated17O MAS NMR data are shown in colour with each spectrum presented in green and purple, with the sum of the fits in red. The17O 2D 3QMAS data (B0= 14.1 T) is shown for all systems to demonstrate the lack of resolution exhibited in the F1 dimension and the limited analytical value it
offers in the simulation and understanding of the 1D MAS NMR data.
Open Access Article. Published on 06 September 2013. Downloaded on 20/10/2014 16:25:35.
This article is licensed under a
[image:8.595.47.552.350.664.2]SSNMR indicator of local site symmetry, with the anisotropic terms elucidated from17O MAS NMR data providing a useful insight into the strength of the hydrogen bond.20 17O enriched BZA was prepared fromα,α,α-trichlorotoluene and H217O in a microwave reactor, and this was a precursor for the prepara-tion of the 17O labelled HD and DT systems. The 17O MAS NMR data acquired from these labelled complexes, obtained using a spinning frequencyνr= 27.5 kHz, are shown in Fig. 6 together with their total simulation and deconvolution. In general, simple carboxylic acids contain two chemically inequivalent O environments, namely the carbonyl (CO) and hydroxyl (O–H) positions. It would be expected that both these positions would yield very different17O isotropic chemi-cal shifts (δiso), quadrupole coupling constants (CQ) and asym-metry parameters (ηQ). Previous work by Wong et al. has suggested that the CO groups have 17O isotropic shifts in the rangeδiso310–340 ppm, while those of the O–H group are more shielded and shifted upfield to a δiso 170–190 ppm range. Due to the low point symmetry of the O position in the CO environment it was suggested that the17OCQvalues for this moiety will be>7 MHz, whileCQvalues for the O–H moi-ety will be situated in a 6.5–7 MHz range.20
The 17O MAS NMR data from enriched BZA reported by Wu suffered from signal-to-noise limitations and was evalu-ated as a single site spectrum. The subsequent lineshape analysis reported that the O positions were characterised by one set of parameters (δiso230 ppm,CQ= 5.7 MHz,ηQ= 1.0), thus implying that BZA participates in a type A H bonding arrange-ment.25 More recently published results by Hagaman et al.
have shown that there are indeed two sites present charac-terised with the parametersδiso236 ppm,CQ= 5.4 MHz,ηQ= 0.99 andδiso= 233 ppm,CQ= 5.6 MHz,ηQ= 0.98.40This suggests that these O sites are inequivalent and the proton in not equally distributed along the H bond thus invoking a type B H bond classification, as observed in the crystal structure. The 17O MAS NMR results for enriched BZA presented in Fig. 6(a) and Table 3 corroborate Hagaman's analysis with a deconvolution into two sites (δiso 236 ppm,CQ = 6.0 MHz,
ηQ = 0.92 andδiso 225 ppm,CQ = 5.6 MHz, ηQ = 0.81), with 17O enrichment necessary for the high quality simulations of
the 9.4 and 14.1 T data. Small discrepancies may be caused by a CSA contribution to the lineshape given that the BZA sample in his study possesses a higher17O content (Hagaman ~35%, this work ~86%) and differing MAS frequencies (Hagaman 15–20 kHz, this work 27.5 kHz). The 3QMAS spectra of 17O enriched BZA in Fig. 6(a) sample shows two observable sites, however due to the significant overlap and broadening in the
F1 dimension it is not possible to deconvolute these reso-nances and elucidate EFG tensor information. This broaden-ing is probably induced by large amplitude motion in the H bond arrangement; as observed in Fig. 3 this is appears to be a phenomenon that effects the quality of all 3QMAS data in this series. This observed broadening infers that the time-scale of the H motion must be similar to the timetime-scale of the NMR experiment (i.e.microseconds), thus interfering with the 1H decoupling from both the 13C and 17O nuclei. The GIPAW DFT results also confirm the presence of two O posi-tions (see Table 3), although the NMR CASTEP calculaposi-tions predict slightly larger CQ values of 7.63 and 7.45 MHz and smaller associated ηQ values of 0.43 and 0.10 for the CO and O–H groups, respectively. In addition, the effect of H motion is readily observed in the correlation between the measured and NMR CASTEP calculated 17O δiso values; while a good agreement is exhibited for the OH group there appears to be very large discrepancy of ~100 ppm observed for the CO moiety.
[image:9.595.42.553.554.693.2]The single crystal XRD structure determination of the LiHD complex discussed above has been shown to support four crystallographic independent O sites. From the17O MAS NMR data acquired at 9.4 and 14.1 T (see Fig. 6(b)) four dis-tinct sites can be observed and simulated with confidence. The O sites represented by the two smaller CQ values (i.e. 6.21 and 4.70 MHz) are tentatively assigned to the carbonyl and hydroxyl environments of the benzoic acid, respectively, while the two sites with the larger CQ values (i.e. 12.36 and 7.94 MHz) are assigned to the central Li2O2moiety.
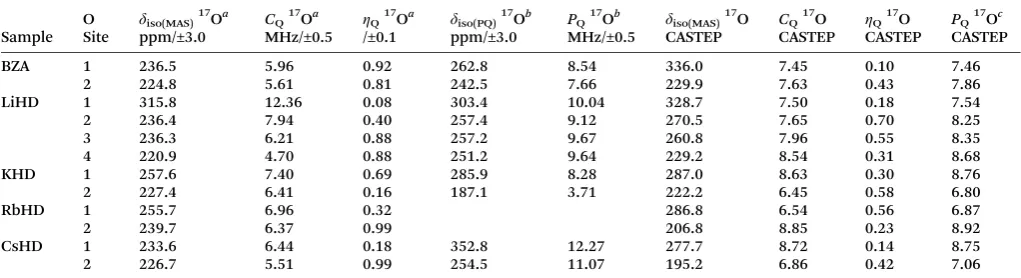
Table 3 The17O isotropic chemical shift and quadrupole tensor data measured by17O MAS and DOR NMR, and calculated using GIPAW DFT (NMR-CASTEP) methods for the17O labelled carbonyl and hydroxyl positions in benzoic acid (BZA) and the hydrogen dibenzoate (HD) systems
Sample O Site δ
iso(MAS)17Oa ppm/±3.0
CQ17Oa MHz/±0.5 η
Q17Oa
/±0.1 δ
iso(PQ)17Ob ppm/±3.0
PQ17Ob MHz/±0.5 δ
iso(MAS)17O CASTEP
CQ17O
CASTEP η
Q17O CASTEP
PQ17Oc CASTEP
BZA 1 236.5 5.96 0.92 262.8 8.54 336.0 7.45 0.10 7.46
2 224.8 5.61 0.81 242.5 7.66 229.9 7.63 0.43 7.86
LiHD 1 315.8 12.36 0.08 303.4 10.04 328.7 7.50 0.18 7.54
2 236.4 7.94 0.40 257.4 9.12 270.5 7.65 0.70 8.25
3 236.3 6.21 0.88 257.2 9.67 260.8 7.96 0.55 8.35
4 220.9 4.70 0.88 251.2 9.64 229.2 8.54 0.31 8.68
KHD 1 257.6 7.40 0.69 285.9 8.28 287.0 8.63 0.30 8.76
2 227.4 6.41 0.16 187.1 3.71 222.2 6.45 0.58 6.80
RbHD 1 255.7 6.96 0.32 286.8 6.54 0.56 6.87
2 239.7 6.37 0.99 206.8 8.85 0.23 8.92
CsHD 1 233.6 6.44 0.18 352.8 12.27 277.7 8.72 0.14 8.75
2 226.7 5.51 0.99 254.5 11.07 195.2 6.86 0.42 7.06
aMeasured from simulation of the experimental17O MAS NMR data.bMeasured from the treatment of the variableB
0field DOR data. cCalculated using NMR-CASTEP derivedC
QandηQvalues.
Open Access Article. Published on 06 September 2013. Downloaded on 20/10/2014 16:25:35.
This article is licensed under a
The Group I alkali metal HD systems supporting the larger cations (i.e. K, Rb, Cs) revert back to a two O environment model comprised of K–O–K and K–O–H species. A previous study of the KHD complex by Wuet al.reveals two O sites, with the K–O–K position characterised by the 17O NMR parametersδiso 287 ppm,CQ = 8.30 MHz,ηQ = 0.23 and the K–O–H position characterised byδiso213 ppm,CQ= 5.90 MHz,
ηQ= 0.55.24The simulations of the experimental17O MAS NMR data acquired for the KHD sample in this study (see Fig. 6(c)) reveals the K–O–K species to be described by δiso 257 ppm,
CQ = 7.40 MHz, ηQ = 0.69 and for the K–O–H species δiso 227 ppm,CQ= 6.41 MHz,ηQ= 0.16. Hence, for KHD it can be surmised that some discrepancies exist in the 17O isotropic chemical shift and EFG parameters between these studies, particularly for the downfield K–O–K bonded O position. GIPAW DFT calculations for the KHD 17O NMR parameters (see Table 3) are in reasonable agreement with the experimen-tally determined parameters from this study for the downfield K–O–K bonded O site, and exhibit an excellent agreement with the upfield K–O–H bonded O arrangement. This suggests that the XRD and SSNMR descriptions of the KHD system performed in this work are accurate and are well-constrained by the other methodologies in this combined SSNMR, XRD and DFT approach. From Fig. 6(d) and 6(e) it can be observed that the larger RbHD and CsHD systems reveal very similar 17O MAS NMR spectra. This is expected as the local O
environ-ments described by the XRD structure determination are all comparable. The 17O isotropic chemical shifts are confined to a range ofδiso 227–256 ppm, and similarly the CQ values fall within a narrow range of 5.51–6.97 MHz. As shown in Table 3, the GIPAW DFT calculated 17O NMR parameters appear to suffer from reduced accuracy when compared to the experimental values. These inaccuracies could be attributed to limitations with the17O, 87Rb and 133Cs pseudopotentials, and relativistic effects may be contributing to the electronic description of the large Rb+ and Cs+ cations. Nevertheless, the actual H bonding arrangements in RbHD and CsHD are accurately described by the precise relationship between the 1H MAS NMR data and the corresponding GIPAW DFT
predic-tions of the1Hδisovalues.
The double rotation (DOR) experiment involves spinning the sample about two angles to enable averaging of both the
P2andP4terms of the 4thorder Legendre polynomial describ-ing the angular dependences of the 2nd order quadrupolar interaction.42,43 This reduces the first order quadrupole broadening by rotation around the more familiar magic angle of 54.7°with respect toB0, and also reduces the second order broadening by spinning at a second angle of 30.6° with respect to the magic angle.35,44–46An advantage of the DOR technique is that the externalB0dependence of the observed (featureless) centre-of-gravity shift (δcg) can be used to deduce information about the 17O isotropic chemical shift and EFG parameters. For a spinI=5/2nucleus it can be derived:
cg iso
Q
ppm ppm
3 500 10
2
0 2
6 P
ð1Þ
whereν0is the17O Larmor frequency andPQ=CQ(1+ηQ2/3)1/2 is the quadrupole coupling paramater.47Data at twoB
0field strengths is required to determine δisoand quadrupole cou-pling parameter,PQ,via:
iso
cg cg2
ppm
01
2 1 02
2
01 2
02
2 ð2Þ
and
PQ
cg cg 2
01 2
02
2 1 2
01 2
02 2
6
500
3 10
ð3Þ
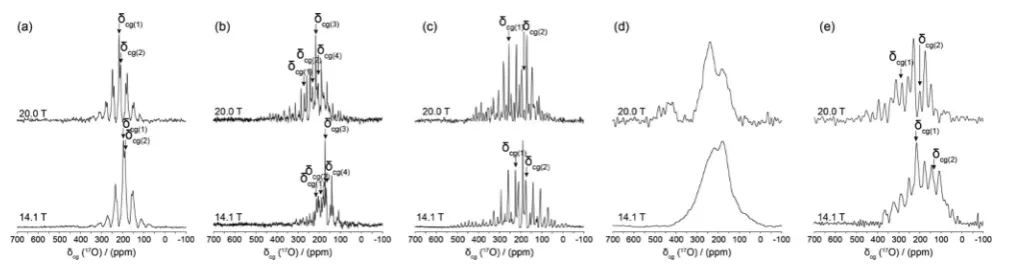
where δcg1 and δcg2 are the centre-of-gravity shifts at eachB0 field (14.1 and 20.0 T in this case). The 17O DOR NMR results are presented in Fig. 7, with the centre-of-gravity shifts (δcg) indicated in each case. These resonance positions were isolated from the spinning sidebands by variable spinning frequency experiments of the outer rotor over a range of 1.2–1.8 kHz. The δisoandPQgraphical solutions are shown in the Fig. 8 and the parameters given in Table 3.
The resolution achieved by the 17O DOR NMR experiment is excellent (FWHM ~230 Hz, ~2 ppm) as highlighted by the BZA, LiHD and KHD data in Fig. 7(a)–7(c); these data serves to confirm the number of chemically inequivalent O posi-tions in each system. 1H decoupling during acquisition was
Fig. 7 17O DOR NMR data (νr(inner) = 1.2–1.8 kHz,νr(outer) = 5.8–8.8 kHz,ν0= 81.33 and 115.25 MHz) measured from the (a) BZA, (b) LiHD, (c) KHD, (d) RbHD and
(e) CsHD systems. The centre-of-gravity shift (δcg) for each resonance is indicated in all spectra.
Open Access Article. Published on 06 September 2013. Downloaded on 20/10/2014 16:25:35.
This article is licensed under a
[image:10.595.47.552.565.697.2]not employed as the motion of the H bonded proton is on a similar timescale to the NMR experiment which effectively recoupled a component of the 1H–17O dipolar interaction, thus broadening each resonance. The same phenomenon was observed during the acquisition of the 17O MAS NMR data presented in Fig. 6. As depicted in Fig. 8, theδisovalue is effectively the centre of gravity at an infinite magnetic field strength. For BZA values ofδiso262.8 ppm andδiso242.5 ppm are determined for the carbonyl and hydroxyl species, respec-tively, which are marginally higher than δiso values deter-mined by conventional MAS methods (see Table 3). The quadrupole parametersCQ andηQ are degenerate within the expression for PQ and they cannot be independently deter-mined; sinceηQcan vary as 0≤ηQ≤1 the maximum error in
CQ generated by this uncertainty is ~15%. The PQvalues for BZA determined from the17O DOR NMR method are 8.54 and 7.66 MHz for the carbonyl and hydroxyl moieties, respectively. Since there is a tendency for higherηQvalues approaching 1 (see corresponding 17O MAS NMR determined values in Table 3) then the scaling of thesePQ values by ~15% yields
CQ values of 7.18 and 6.51 MHz. Given the complexities of both the17O MAS and DOR data which possess both quadru-pole and CSA contributions which are further affected by inherent H motion, then the overall agreement is acceptable.
The 17O DOR NMR results for LiHD and KHD (see Fig. 7(b) and 7(c)) illustrate the true utility and power of the DOR technique when disorder and chemical shift dispersion are not present within the structure. The chemically inequivalent O positions defining both systems (four in LiHD and two in KHD) are clearly resolved. TheδisoandPQresults show some inconsistencies with the MAS derived and NMR-CASTEP calculated results, however, given the limited rotational frequencies achievable with DOR and the large 17O CSA contributions experienced in organic systems,48and
the inability to effectively 1H decouple in the presence of H motion, the overall agreement is acceptable. In contrast, the17O DOR NMR result for the RbHD systems represents no
resolution enhancement and a complete inability to average the quadrupole dominated lineshape. In fact, the resultant DOR lineshape is a factor of ~2.5 times broader than the MAS averaged lineshape at 14.1 T implying that the DOR experiment is recoupling elements of the quadrupolar and dipolar interactions caused by fluctuations in the proton position and its specific frequency of motion. This situation is somewhat retrieved for the CsHD case as both inequivalent O positions are now resolved, however the residual linewidths are not as narrow as those observed in the BZA, LiHD and KHD cases and the apparent resolution is reduced.
An SSNMR analysis of each central Group I alkali metal was performed to characterise the positions within each structure and rationalise the GIPAW DFT calculations of the isotropic chemical shifts (δiso) and EFG parameters (CQ and
ηQ) against the changing geometry and H bond strength characterising these arrangements. The 7Li, 39K, 87Rb and 133Cs SSNMR data are shown in Fig. 9(a)–9(d), respectively,
and the experimentally measured data and the GIPAW DFT calculated data are summarised in Table 4. As observed in Fig. 9(a) and 9(d), the small 7Li and 133Cs quadrupole moments (Q) afford measurement to be undertaken with the MAS NMR technique. The7Li MAS NMR spectrum of Fig. 9(a) shows one resonance atδiso3.38 ppm in agreement with the proposed LiHD structure from the X-ray studies (see above),
Fig. 8 The B0 variation of the centre-of-gravity shifts (δcg) measured from the
17
O DOR data for BZA and the Group I alkali HD complexes.
Fig. 9 The solid state NMR data of the Group I alkali metals, (a)7Li MAS (νr= 27.5 kHz),
(b) multiple field static39K, (c) multiple field static87Rb and (d) multiple field133Cs MAS (νr= 10 kHz). The resultant simulations are shown below each spectrum in
green and purple. The asterisk indicates the presence of Cs benzoate in this compound.
Open Access Article. Published on 06 September 2013. Downloaded on 20/10/2014 16:25:35.
This article is licensed under a
[image:11.595.48.285.42.223.2] [image:11.595.312.547.360.666.2]and the δisocalculated with NMR-CASTEP exhibits a reason-able agreement with this value. Similarly, the133Cs MAS NMR data of Fig. 9(d) is also characterised by narrow resonances, however in this case both the monoclinic (δiso−188.2 ppm) and orthorhombic (δiso −195.3 ppm) forms are observed simulta-neously; this is corroborated by excellent agreement with the NMR-CASTEP values given in Table 4. In both the7Li and133Cs cases, the very small CQ values characterising these nuclei induce featureless resonances and the experimentalCQvalues are likely to be smaller than what is predicted by DFT methods. In particular, for the133Cs case the spin ofI= 7/2 scales the width of the quadrupole interaction accordingly, making evi-dence of a quadrupole interaction more difficult to observe. Thus, the lack of sensitivity to B0 variation and the obvious absence of satellite transitions sidebands precludes the mea-surement of the EFG parameters.
In contrast, the 39K and 87Rb measurements were per-formed with multiple field static (solid echo) NMR experi-ments which afforded a more complete analysis of the δiso and EFG parameters characterising each position. The39K values (CQ= 1.38 MHz,ηQ= 0.09) and87Rb values (CQ= 10.12 MHz,
ηQ = 0.34, six-coordinate polymorph only) display a good agreement with the calculated quadrupole parameter values. The87Rb static lineshape also possesses a small CSA contribu-tion which is very difficult to quantify accurately; if this could be incorporated further improvement in the agreement with the 87Rb calculations could be achieved. Furthermore, the 39K δiso value also exhibits a good agreement with its calculated counterpart, considering that previously established 39K chemical shifts for diagmagnetic materials and complexes
span a range ofδiso~ +100–−100 ppm.49–54In addition to the 1H MAS NMR data discussed above, this general corroboration
between the measured and chemical shift and quadrupolar tensor parameters for these alkali metals also suggests that the reported H crystallographic positions defining each H bonding arrangement are reliable despite the intrinsic uncertainty in these positions from the X-ray data. These results are consis-tently reliable despite the significantly changing dimensions in the M2O2rings defining each system. The X-ray measured M–O distances (within each M2O2 ring) summarised in Tables 1 and 5, and the corresponding M–O distances obtained from the geometry optimised isostructural series KHD, RbHD(6)and CsHD(m)(see Table 5 and supplementary data S6†) both indi-cate that KHD clearly exhibits the shortest M–O distance (2.690 Ǻ), which progressively lengthens to 2.821 and 3.063 Ǻ for RbHD and CsHD, respectively. This dimension is consis-tent with the significantly increasing ionic radius in the Group I alkali metals.
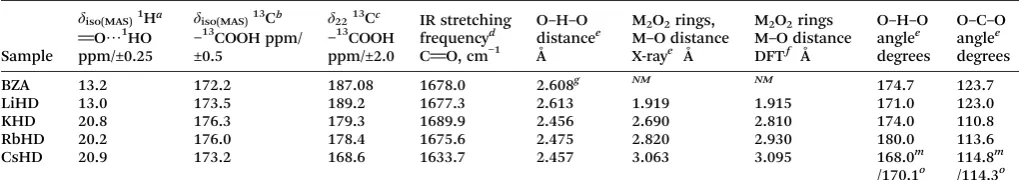
Table 5 summarizes the SSNMR parameters and other indicators from diffraction studies and vibrational spectros-copy that have traditionally helped to define H bond strengths across series of organic and organometallic complexes. The 1H MAS NMR method is the most obvious technique to have
[image:12.595.44.553.71.146.2]recourse to when a characterisation of the H bond strength is required. The1Hδisovalues from Tables 2 and 5 clearly show that a stepwise change is exhibited, with the BZA and LiHD systems representing ‘weaker’H bonding arrangements and the KHD, RbHD and CsHD complexes containing the larger alkali cations signifying‘stronger’H bonding situations. This step in the bonding strength is echoed by the13Cδisovalues,
Table 4 A collation of the7Li and133Cs MAS NMR, and39K and87Rb static NMR chemical shift and quadrupole tensor data acquired for the Group I alkali metal cations with the corresponding GIPAW DFT (NMR-CASTEP) calculated data
Sample Nucleus δiso(MAS)/δiso (static)a ppm CQMHz ηQ δiso(MAS)CASTEP CQCASTEP ηQCASTEP
LiHD 7Li 3.4 2.0 0.39 0.04
KHD 39Ka 9.8 1.38 0.09 −6.2 1.30 0.15
RbHD 87Rb6 b −82.08 10.12 0.34 −173.8 9.41 0.69
87Rb8 −175.4 9.27 0.76
CsHD 133Csm −188.2 −184.5 0.34 0.79
133Cso −195.3 −196.7 0.34 0.79
[image:12.595.42.552.584.674.2]aMeasured from a39K static lineshape.bMeasured from a87Rb static lineshape.66-Coordinate.88-Coordinate variants.mMonoclinic. oOrthorhombic variants.
Table 5 A comparison of the solid state NMR, IR and structural parameters traditionally used to characterise H bond trends
Sample
δiso(MAS)1Ha
O⋯1HO ppm/±0.25
δiso(MAS)13Cb
−13
COOH ppm/ ±0.5
δ2213Cc
−13 COOH ppm/±2.0
IR stretching frequencyd CO, cm−1
O–H–O distancee Å
M2O2rings, M–O distance X-raye Å
M2O2rings M–O distance DFTf Å
O–H–O anglee degrees
O–C–O anglee degrees
BZA 13.2 172.2 187.08 1678.0 2.608g NM NM 174.7 123.7
LiHD 13.0 173.5 189.2 1677.3 2.613 1.919 1.915 171.0 123.0
KHD 20.8 176.3 179.3 1689.9 2.456 2.690 2.810 174.0 110.8
RbHD 20.2 176.0 178.4 1675.6 2.475 2.820 2.930 180.0 113.6
CsHD 20.9 173.2 168.6 1633.7 2.457 3.063 3.095 168.0m
/170.1o
114.8m /114.3o
aDirectly measured from the experimental1
H MAS NMR data.bDirectly measured from the experimental13C CPMAS NMR data.cTheδ22 term of the13C chemical shift tensor derived from slow MAS.dAs measured from powder IR.eAs measured from single crystal X-ray data. fDetermined from DFT energy minimisation and geometry optimisation.g20 K, major component, from Wilsonet al., seeRef. 38. mMonoclinic variant.oOrthorhombic variant.NMNo alkali metal present.
Open Access Article. Published on 06 September 2013. Downloaded on 20/10/2014 16:25:35.
This article is licensed under a
although the CsHD gives an anomalous result. However, the δ22element of the13C CSA (which is aligned along the CO bond) is directly affected by the strength of the H bond inter-action, yet it displays a gradual monotonic decrease upon progression through the series from BZA to CsHD. This con-flicting behaviour suggests that these indicators describe indi-vidual characteristics of what is a more complex process, especially when H motion is involved.
The IR stretching frequency of the carbonyl group is typi-cally used to describe the H bonding interaction.15It usually gives a broad resonance caused by the variation in the H bonding. The frequencies shown in Table 5 have very limited correlation with the SSNMR data. Other literature methods resort to measuring the O⋯O distance across the hydrogen bond.55This parameter exhibits a stepwise decrease in length from 2.608 and 2.613 Ǻ for BZA and LiHD, respectively (i.e.
the weaker H bonds in this series), to 2.456, 2.455 and 2.457 Ǻfor the isostructural KHD, RbHD and CsHD, respec-tively (i.e.the stronger H bonds). This behaviour mirrors the clear1Hδisotrend, and also correlates with a less-defined step-wise trend that can also be associated with theδ22element of the13C CSA tensor. In contrast, the O–H–O and O–C–O angles show no discernible trend. This suggests that the true complex-ity of H bonding is not easily rationalised solely by geometric parameters and that SSNMR tensorial parameters play a critical role in these description of this phenomenon.
Conclusions
This work has demonstrated that a NMR crystallography approach involving SSNMR, single crystal X-ray structure deter-minations and GIPAW DFT calculation of the NMR parameters places realistic constraints on the description of H bonding in organic crystals. XRD methods often struggle to locate H posi-tions accurately, however with the aid of SSNMR andab initio
GIPAW DFT calculations the level of constraint is greatly increased and the overall accuracy of the structure determina-tion can rely on the reladetermina-tionship displayed by these accompa-nying techniques. The multinuclear SSNMR/GIPAW DFT approach described here has sought to accurately analyse all aspects of the H bonding in alkali metal containing HD systems by investigating nuclei such as 1H, 13C, 17O and 7Li/39K/87Rb/133Cs that are relevant to each of the BZA, LiHD,
KHD, RbHD and CsHD H bonded complexes.
The important aspects of this work highlight the ability of 1H and 13C MAS NMR to focus on H bonding character in
organic systems bearing Group I alkali metal centres. Tradi-tionally, the1Hδisohas been used to describe the H bonding nature of the carboxyl proton, and in this study a stepwise change in H bonding character was observed to separate BZA and LiHD (which are identified as weakly H bonded systems) from KHD, RbHD and CsHD (which are identified as strongly H bonded systems). This trend was precisely predicted by the GIPAW DFT calculation of the 1H δiso values which agree unequivocally with the measured values. Both the 13C δiso value and the δ22 CSA tensor value exhibit a smoother and
monotonic progression with increasing alkali cation size, although the 13C δiso value for CsHD is anomalous. GIPAW DFT calculations of these13C parameters are also of high pre-cision and thus corroborate the different reported trends. The close relationship between the measurement and calculations for both the1H and13C parameters suggest that these atoms play quite separate roles in the mechanism of a H bond.
Subsequent17O MAS and DOR NMR, and associated DFT calculations emphasise the greater difficulties connected with acquiring and treating experimental17O data, and correlating that data with DFT calculated parameters. The 17O DOR experiment proved a very powerful tool to establish the exact number of inequivalent O sites in each HD system with very high resolution data being acquired for all systems except RbHD. Both17O MAS and DOR NMR techniques were used to elucidate theδisoand quadrupole parameters such asCQand
ηQ, however the correlation with the DFT calculations was not as precise. The complex data generated by the presence of quadruple and CSA contributions, convoluted with the effects generated by H motion, has compromised the quality of the17O data simulation and hence the relationship between the experimental and calculatedδiso,CQandηQvalues. Never-theless, useful correlations were able to be established and it was shown that hydroxyl O tends to have a smallerδisoandCQ value when compared to the carboxyl O species.
Finally, the alkali metal SSNMR studies involving 7Li,39K, 87Rb and133Cs nuclei and the associated GIPAW DFT
calcula-tion of their chemical shift and quadrupole tensor parameters highlighted an excellent agreement between these approaches. In particular, the ability to accurately predict the7Li,39K and 133Csδ
isovalues and the39K and87Rb quadrupole parameters served as a useful addition to the understanding of these H bonded systems. This study promotes the further possibili-ties for the incorporation of guest nuclei such as monovalent Group I alkali metal ions as a probe of H bond geometry and strength in other organic/organometallic systems, and stresses the value of an NMR crystallographic approach as an effective method of characterisation.
Experimental Section
GeneralIR spectra were recorded on a Perkin Elmer Spectrum 100 FT-IR Spectrometer using Attenuated Total Reflection sampling unless otherwise stated, and are reported in cm−1. Mass spectra were recorded at the EPSRC Mass Spectrometry Centre at the University of Swansea. GCMS was carried out at NTU using Agilent Technologies 6890N GC equipped with a 5975 mass detector. Chemical analysis data were obtained from Mr Stephen Boyer, London Metropolitan University. Microwave synthesis was performed using a CEM Discovery apparatus and all17O labelled water was purchased from Cortecnet.
17O-Enriched benzoic acid (BZA)
α,α,α-Trichlorotoluene (660 mg, 3.38 mmol) and 70% 17 O-enriched water (Cortecnet, 193 mg, 10.1 mmol) were reacted
Open Access Article. Published on 06 September 2013. Downloaded on 20/10/2014 16:25:35.
This article is licensed under a
together at 160°C for 15 min in a 10 ml vial at a pressure of 16 bar in a microwave reactor. The vessel was allowed to cool to room temperature, and then the excess pressure (HCl vapour) released. The mixture was again reacted at 160°C for 45 min at 16 kbar, and then cooled to room temperature and the pressure released. Depending on the degree of conversion to benzoic acid (as determined by GC-MS analysis), a further amount of 17O-labelled water added (typically 50–100 μL), and the mixture was treated under the same microwave condi-tions (45 mins). This was repeated, if necessary, until GC-MS showed almost complete conversion to benzoic acid. The crude product was recrystallized from heptane, typical isolated yield 80%. An ampoule of 70%17O-enriched water gave benzoic acid containing 40.5% PhC(17O)2H, 45.7% PhC(17O)(16O)H and 13.8% PhCO2H by mass spectral analysis (64% enrichment); elemental analysis calcd (%) for C7H6O2: C 68.16, H 4.90; found: C 68.25, H 4.82; 90%17O-enriched water gave benzoic acid containing 74.2% PhC(17O)2H, 23.6% PhC(17O)(16O)H and 2.2% PhCO2H by mass spectral analysis (86% enrich-ment), m.p. 121–122°C, IR (ATR):ν˜= 3073, 2982, 2815, 2658, 2540, 1664 (CO), 1603, 1582, 1454, 1419, 1323, 1285 and 1276 (C–O), 1187, 1180, 1121, 1073, 1027, 931, 810, 798, 703, 684, 661 cm−1 (cf. non-enriched benzoic acid, from heptane: IR (ATR):ν˜= 3072, 2831, 2668, 2554, 1678, 1602, 1583, 1454, 1421, 1324, 1289 (C–O), 1280 sh, 1187, 1180, 1128, 1073, 1027, 932, 805, 704, 684, 666 cm−1).
Preparation of hydrogen dibenzoates and tribenzoate
The hydrogen dibenzoate (HD) salts were prepared by the reac-tion of benzoic acid with half an equivalent of the appropriate metal hydroxide in hot ethanol/water mixtures (KHD, RbHD, CsHD) or methanol/water mixtures (LiHD) and subsequent cooling. For CsHD, the use of THF and methanol mixtures for the reaction led to a different polymorph (orthorhombic) of the product. The unlabelled NaDT sample was prepared by slow evaporation of 2 : 1 mixture of BZA and NaOH prepared in ethanol/water. Further details are given in the ESI.† 17O labelled HD samples were prepared in a similar way, but using17O enriched BZA.
X-ray crystallography
X-ray diffraction datasets for most crystals were measured with MoKα radiation (λ = 0.71073 Å) on a Bruker-Nonius FR591 diffractometer equipped with a rotating anode and a Bruker-Nonius Roper CCD camera, and the X-ray data for the 6-coordinate RbHD polymorph were collected on a Rigaku AFC12 goniometer equipped with an enhanced sensitivity (HG) Saturn 724+ detector mounted at the window of an FR–E+ Superbright MoKαrotating anode generator with HF Varimax optics56(National Crystallography Service, Southampton Uni-versity, UK). The diffraction data for the orthorhombic poly-morph of CsHD were measured on an Oxford Diffraction Xcalibur diffractometer equipped with a Sapphire CCD detec-tor at NTU. Crystal cooling was provided by an Oxford Cryosystems Cryostream low temperature system. Diffraction
data was collected byφandωscans, and Lorentz polarisation correction and an absorption correction were applied. Crystal structure solution and refinement (on F2) were carried out with SHELXS and SHELXL programs57using the XSEED inter-face.58 Non-hydrogen atoms were assigned anisotropic dis-placement parameters. All hydrogen atom positions were determined geometrically and refined with a riding model, except as follows: LiHD and NaDT: coordinates of the (O)H atoms refined; KHD: two (O)H positions, related by a centre of symmetry in the middle of the O–O atomic vector, refined with half occupancies based on observations of the difference electron density; the six-coordinate RbHD polymorph was refined with the (O)H atom located at a centre of symmetry in the middle of the O–O atomic vector based on observation of the difference electron density map; the eight-coordinate RbHD polymorph and both polymorphs of CsHD: electron density corresponding to the (O)H atom located on a two-fold axis and equidistant from two O atoms (O–O: (Rb) 2.455 Å, (Cs monoclinic) 2.457 Å, (Cs orthorhombic) 2.457 Å) and only theycoordinate refined in each case. Difference electron den-sity maps59from the structural models without the (O)H atom found two centrosymmetrically related peaks of electron den-sity between the two O atoms for the K salt, but only one such peak positions equidistant from the two O atoms for the Rb and Cs cases. Molecular illustrations were made with Mercury60 and POVRAY.61
Crystal data
Lithium hydrogen dibenzoate: C14H11O4Li, Mr = 250.17, triclinic, a = 5.3600(3), b = 8.5693(7), c = 13.4999(11) Å, α= 98.830(4)°,β= 93.800(5)°,γ= 95.524(5)°,V= 607.80(8) Å3,
Z= 2,P−1, crystal: 0.16×0.08×0.05 mm,Dcalc.= 1.37 g cm−3,
μ = 0.099 mm−1, T = 120 K, 11 772 measured reflections, max. 2Θ= 27.57°, 2763 unique reflections, 1833 withF2>2σ,
R(F,F2 >2σ) = 0.054, Rw(F2, all data) = 0.13. max. and min. residual e density: 0.23 and−0.27 eÅ−3.
Sodium dihydrogentribenzoate: C21H17O6Na,Mr= 388.34, monoclinic, a = 5.8077(1), b = 14.4331(4), c = 22.0139(6) Å, β= 97.047(2)°,V= 1831.33(8) Å3,Z= 4, P21/c, crystal: 0.50× 0.26 × 0.05 mm,Dcalc. = 1.41 g cm−3, μ = 0.123 mm−1, T = 120 K, 21 737 measured reflections, max. 2Θ = 27.51°, 4185 unique reflections, 3434 reflections with F2 > 2σ,
R(F,F2 >2σ) = 0.041, Rw(F2, all data) = 0.10, max. and min. residual e density: 0.27 and−0.29 eÅ−3.
Potassium hydrogen dibenzoate: C14H11O4K, Mr= 282.33, monoclinic, a = 29.586(2), b = 3.7964(3), c = 11.1214(8) Å, β= 97.096(9)°,V= 1239.59(16) Å3,Z= 4,C2/c, crystal: 0.50× 0.40×0.03 mm,Dcalc= 1.51 g cm−3,μ= 0.435 mm−1,T= 120 K, 12 549 measured reflections, max. 2Θ = 27.65°, 1428 unique reflections, 1203 withF2>2σ,R(F,F2>2σ) = 0.043,Rw(F2, all data) = 0.11, max. and min. residual e density: 0.37 and
−0.37 eÅ−3; original measurement.62
Rubidium hydrogen dibenzoate, six coordinate polymorph: C14H11O4Rb, Mr = 328.70, monoclinic, a = 29.347(4), b = 3.8697(5), c= 11.3973(16) Å, β= 95.478(7)°,V= 1288.4(3) Å3,
Open Access Article. Published on 06 September 2013. Downloaded on 20/10/2014 16:25:35.
This article is licensed under a
Z= 4,C2/c, crystal: 0.34×0.31×0.05 mm,Dcalc.= 1.69 g cm−3,
μ = 3.85 mm−1,T = 100 K, 4341 measured reflections, max. 2Θ = 27.42°, 1423 unique reflections, 1404 with F2 > 2σ,
R(F,F2>2σ) = 0.025,Rw(F2, all data) = 0.069, max. and min. residual e density: 0.59 and−0.90 eÅ−3.
Rubidium hydrogen dibenzoate, eight coordinate poly-morph: C14H11O4Rb,Mr= 328.70, monoclinic,a= 29.0315(9),
b= 6.9630(2),c= 6.6156(2) Å,β= 99.297(2)°,V= 1319.75(7) Å3,
Z= 4,C2/c, crystal: 0.28×0.20×0.08 mm,Dcalc.= 1.65 g cm−3,
μ = 3.76 mm−1,T = 120 K, 8615 measured reflections, max. 2Θ= 27.49°, 1510 unique reflections, 1439 withF2>2σ,R(F,
F2>2σ) = 0.028,Rw(F2, all data) = 0.070, max. and min. resi-dual e density: 0.34 and−0.61 eÅ−3.
Cesium hydrogen dibenzoate, monoclinic polymorph: C14H11O4Cs, Mr = 376.14, monoclinic, a = 28.9095(8), b = 7.0509(2), c= 6.7779(2) Å,β = 99.970(2)°,V = 1360.73(7) Å3,
Z= 4,C2/c, crystal: 0.55×0.45×0.04 mm,Dcalc.= 1.84 g cm−3,
μ= 2.73 mm−1,T= 120 K, 11 461 measured reflections, max. 2Θ= 27.57°, 1565 unique reflections, 1529 withF2>2σ,R(F,
F2>2σ) = 0.019,Rw(F2, all data) = 0.046, max. and min. resi-dual e density: 0.61 and−0.80 eÅ−3.
Cesium hydrogen dibenzoate, orthorhombic polymorph: C14H11O4Cs, Mr= 376.14, orthorhombic,a= 28.3393(19),b= 7.0215(3), c = 6.9066(4) Å, V = 1374.31(14) Å3, Z = 4, Pbcn, crystal: 0.35 × 0.33 × 0.12 mm, Dcalc. = 1.82 g cm−3, μ = 2.70 mm−1,T= 150 K, 7535 measured reflections, max. 2Θ= 29.13°, 1664 unique reflections, 1389 with F2 >2σ,R(F,F2>
2σ) = 0.031, Rw(F2, all data) = 0.050, max. and min. residual e density: 0.66 and−0.45 eÅ−3.
Solid state NMR
All solid state1H MAS NMR measurements were undertaken at 11.7 T using a Bruker Avance III-500 spectrometer operat-ing at a 1H frequency of 500.1 MHz. These data were acquired using a Bruker 2.5 mm double resonance probe spinning each sample at 27.5 kHz, and with single pulse experiments of 1.5 μs pulse duration (flip angle of π/4) and recycle delays of 15 s. Each 1H MAS NMR spectrum was referenced to the primary standard of tetramethylsilane (TMS,δiso= 0 ppm).63The corresponding13C MAS NMR data were acquired at 9.4 T on a Bruker DSX-400 spectrometer operating at a13C frequency of 100.3 MHz. The1H–13C cross-polarisation MAS (CPMAS) technique was implemented using a Bruker 3.2 mm double resonance probe; a variable ampli-tude CPMAS experiment was employed which used an initial 1Hπ/2 pulse of 3μs, a contact period of 1 ms, a recycle delay
of 2 s and a1H decoupling field of ~95 kHz during acquisi-tion. For each system 13C CPMAS data were acquired at a range of MAS frequencies (νr= 0.8, 1.5 and 12 kHz) to allow a detailed sideband analysis to be undertaken thus enabling an accurate determination of the 13C chemical shift anisotropy (CSA). Spinning sideband manifold simulations were com-pleted on all 13C CPMAS data using the spectral analysis function available in TOPSPIN 2.1. Each 13C CPMAS NMR spectrum was referenced to the primary standard of
tetramethylsilane (TMS,δiso= 0 ppm)viaa secondary solid ref-erence of alanine (δiso(CH3) = 20.5 ppm,δiso(CH) = 50.5 ppm).63 17O (I= 5/2) MAS NMR studies were performed at 9.4 and
14.1 T using Bruker DSX-400 and Bruker Avance II-600 spectrometers operating at 17O frequencies of 52.23 and 81.34 MHz, respectively. A Bruker 2.5 mm double resonance probe was used at each field which facilitated a MAS frequency of 27.5 kHz for each measurement. All17O MAS NMR data were acquired using a rotor-synchronised Hahn echo experiment (θ–τ–2θ–τ–acquire); a‘non-selective’(solution)π/2 pulse time of 6μs was calibrated using 10% H217O, from which a‘selective’ (solid)θpulse of 1μs was used which represented a ~π/4 flip angle. A recycle delay of 2–3 s was used throughout; this was checked against acquisitions using recycle delays of up to 60 s. All 17O apparent shifts (centre-of-gravity, δcg) and isotropic chemical shifts (δiso) are reported against a primary reference of H217O (δiso= 0 ppm). Two dimensional17O triple quantum MAS (2D 3QMAS) measurements were undertaken at 14.1 T using a Bruker Avance II-600 spectrometer and a double resonance Bruker 2.5 mm probe which delivered an MAS frequency of 27.5 kHz. 3QMAS data were acquired using a three pulse Z-filter pulse experiment which consisted of a ‘non-selective’ 5.0 μs 3 π/2 excitation pulse, a 1.5 μs π/2 conversion pulse, and followed by two‘selective’40.00μsπ/2 pulses which comprised the Z-filter. The recycle delay was 2 s.17O double rotation (DOR) experiments using odd order sideband suppression64 were undertaken at 14.1 and 20.0 T using Bruker Avance II-600 and Avance III-850, respectively, operating at the17O frequencies of 81.34 and 115.25 MHz. The measurements at each field were performed using Samoson designed DOR probes which func-tioned with an external rotor spinning frequency of 1.2–1.8 kHz and an internal rotor spinning frequency of 5.8–8.8 kHz.
The7Li (I= 3/2) MAS NMR measurements were performed at 11.7 T using a Bruker Avance III-500 spectrometer operat-ing at a 7Li frequency of 194.37 MHz, and a Bruker double resonance 3.2 mm probe enabling a MAS frequency of 20 kHz. The single pulse experiment consisted of a ‘selective’(solid) π/2 pulse of 1.50μs duration (i.e.‘non-selective’(solution)π/2 pulse of 3μs)and a recycle delay of 60 s. This pulse time was calibrated on a 9.6 M LiCl (aq) solution (δiso= 0 ppm) which also acted as the primary chemical shift reference. Static (broadline) 39K (I = 3/2) NMR measurements were performed at 9.4 and
14.1 T using Bruker DSX-400 and Avance II-600 specrometers operating at39K frequencies of 18.66 and 27.97 MHz, respec-tively. These experiments were implemented using a single channel Bruker 10 mm static probe, and the data was acquired using a solid echo (θ–τ–θ–τ–acquire) experiment. A‘selective’(solid) pulse time of 5μs (i.e.‘non-selective’ (solu-tion)π/2 pulse of 10μs) duration was calibrated on a 0.1 M KCl (aq) solution (δiso = 0 ppm) which also acted as the primary chemical shift reference, and recycle delay was 10 s. Similar static87Rb (I= 3/2) NMR measurements were under-taken at 4.7, 9.4 and 14.1 T using Chemagnetics CMX-200, Bruker DSX-400 and Bruker Avance II-600 spectrometers oper-ating at 87Rb frequencies of 65.25, 130.50 and 196.13 MHz, respectively. The data at all three fields was acquired using
Open Access Article. Published on 06 September 2013. Downloaded on 20/10/2014 16:25:35.
This article is licensed under a