2
ANALYSING AND OPTIMIZING THE ASSEMBLY PROCESS OF LFE
PACKAGES AT BRONKHORST HIGH-TECH B.V.
Bachelor thesis
Publication date: 25-06-2019
Student
D.K. Ankersmit (Desiree)
Industrial Engineering and Management University of Twente
First supervisor
Dr. ir. W.J.A. van Heeswijk (Wouter) University of Twente
Supervisor Bronkhorst High-Tech T. Smith Bsc. (Thomas)
Process engineer Bronkhorst High-Tech
Second supervisor
3
Management summary
This thesis is done for Bronkhorst Tech in the process engineering department. Bronkhorst High-Tech produces flowmeters which consist out of multiple parts including an LFE package. The LFE package consists out of a number of stacked disks with grooves on one side. It determines the flow capacity of the flowmeter.
Problem statement
Bronkhorst has been having some issues with their delivery reliability which caused them to have a look at several production processes. One of the processes that stood out as seemingly very inefficient was the assembly of LFE packages. With a reject rate of approximately 4.5% and production being done manually it indeed seemed like there was potential for improvement. So the following goal was set: The thesis will aim to provide the company with an alternative process design for the assembly of the LFE packages. This alternative design should halve the current reject rate, preferably getting the reject rate as close to the target of 2% as possible, and reduce assembly times by 15%.
Research
To get a better grasp on the current situation the process was analysed, showing several things. The assembly times consist for a significant part out of necessary but non value adding time, ranging from 15% for the easier packages to 55% for the larger packages.
The other issue, the rejects, were not what they at first seemed. It was expected that the rejects were caused by miscounted and misoriented LFEs, it turned out that those are almost not an issue at all. 77% of the rejects were seemingly caused by variation in the LFEs. This variation, caused by the manner in which the LFEs are produced, interacts with the variation found in the bodies where the package is mounted in.
In addition to the findings on the assembly times and the rejects, it was also apparent that the task of assembling the LFE packages had some other issues. The task consists out of many repetitive movements and is done for hours on end, increasing the risk of RSI. The employees do not seem to enjoy the task.
From ideas in the company and literature alternatives were formulated to address (some of) the problems associated with the LFE assembly process. Of these ideas an alternative way of supplying the LFEs got the best score in the assessment. This new supplying method would entail that the LFEs are supplied on a rod, pre-oriented and in a specific number.
Results
Based on the findings of the analysis and depending on the exact form that the new supplying method is going to have the savings could be as high as 46% in regular labour time and 77% in rework labour time. Although the savings in rework (rejects) would remain to be seen, as the problem turned out more complex than first thought.
Conclusion
4
Preface
Before you lies my thesis called: “Analysing and optimizing the assembly process of LFE packages at Bronkhorst High-Tech b.v.”. This thesis forms the finalization of the bachelor industrial engineering and management at the University of Twente. The project was executed for the process engineering department at Bronkhorst High-Tech located in Ruurlo. In this research the assembly process of LFE packages is analysed, alternatives and improvements are identified and finally an advice is given on how to improve the process.
I would like to take this opportunity to thank my supervisors from the University of Twente, Wouter van Heeswijk and Leo van der Wegen for their guidance. Both of them helped, with their advice and knowledge, to get this project off to a good start. The feedback sessions were always short and to the point, but never rushed, which was an ideal fit for me.
I would also like to thank my company supervisors, Thomas Smith and Tom Melsen, from Bronkhorst High-Tech for their support. They have made me feel welcome, provided precious insights during our feedback meetings and gave me the freedom to execute the project in an individualistic manner.
Of course the colleagues from production department TGP1 cannot be left out. They provided me with the opportunity to collect data which was critical to the analysis of the current assembly process. Every member of the department was prepared to be subjected to questions, time measurements and a curious trainee looking over their shoulder. They have formed the fundament where this research is built upon. Lastly I would like to thank my family for their unconditional support.
I hope you will find this thesis an interesting read.
5
Contents
Management summary ... 3
Preface ... 4
Glossary of terms ... 7
1 Introduction ... 8
1.1 Bronkhorst High-Tech ... 8
1.1.1 The company ... 8
1.1.2 The engineering department ... 8
1.2 Motivation ... 9
1.3 Problem context ... 9
1.4 Core problem ... 10
1.5 Approach ... 11
1.5.1 Analysis of current situation ... 11
1.5.2 Creation of alternative process designs ... 12
1.5.3 Assessment of alternative process designs ... 12
1.5.4 Choice of alternative process design... 13
1.5.5 Conclusions and recommendations ... 13
2 Analysis of current situation ... 14
2.1 General ... 14
2.2 The process ... 14
2.2.1 The production processes ... 14
2.2.2 The reject process ... 16
2.3 The assembly times ... 17
2.3.1 Assembly times per package type ... 17
2.3.2 Batch (regular) assembly times ... 19
2.4 The rejects ... 20
2.4.1 General reject rate ... 20
2.4.2 Issues causing rejects ... 21
2.5 The costs ... 23
2.5.1 The regular costs ... 23
2.5.2 The quality (rejection) costs ... 25
2.5.3 The complete picture ... 26
2.6 The impact on employees ... 29
2.7 Conclusion ... 29
3 Creation of alternative process designs ... 32
3.1 “Bronkhorst” thoughts on alternatives ... 32
3.1.1 Short term improvements ... 32
3.1.2 Medium-term improvements ... 32
3.1.3 Long-term improvements ... 33
3.2 Literature study on alternatives ... 34
3.2.1 Short-term improvements ... 35
6
3.2.3 Long-term improvements ... 38
4 Assessment of alternatives ... 40
4.1 Assessment method ... 40
4.2 The criteria ... 41
4.2.1 Criteria for the assessment of alternatives ... 41
4.2.2 Demands and wishes for specific alternatives ... 43
4.3 Assessment of alternatives ... 43
4.3.1 Weight of the criteria ... 43
4.3.2 Assessment short-term improvements ... 45
4.3.3 Assessment medium-term improvements ... 47
4.3.4 Assessment long-term alternatives ... 49
4.3.5 Conclusion ... 51
5 Choice of alternative... 52
5.1 The proposed solutions ... 52
5.2 The medium-term solution; supplying the LFEs on a rod (in the required number) ... 52
5.3 The aspects of the implementation plan ... 53
5.4 The implementation plan ... 55
6 Conclusions and recommendations ... 57
6.1 Conclusions ... 57
6.2 Recommendations ... 58
6.2.1 Actions ... 58
6.2.2 Research ... 58
7
Glossary of terms
5S Sort, Straighten, Sweep, Standardise & Sustain
BHT Bronkhorst High-Tech
Cobot Collaborative robot; robot used in unison with human workers
Delivery reliability Percentage of orders shipped on time. Calculated by dividing the number of orders shipped on or before the confirmed shipment date by total number of order that should have been shipped on that date
DPMO Defects Per Million Opportunities
Flowmeter Instrument used to measure flows of either gasses or liquids
GWO Groep Werk Overleg; Group work discussion. Meetings with the goal to communicate important information with the organisation
Kan Ban Material controlling method used in pull systems Lean Methodology advocating the elimination of waste
Lean green belt Qualification earned for completing a project (worth a certain amount in savings) using lean knowledge and tools
Lean yellow belt Qualification earned for knowledge about lean concepts and tools
LFE Laminar Flow Element
LFE package Part of a flowmeter that determines the flow capacity
Mock-up A physical model used for visualizing and trying out the design
NNVA Necessary but Non Value Adding
Pareto analysis Analysis that assumes that 20% of the causes are responsible for 80% of the issues
Poka-yoke Lean fail-saving method
Reject rate Percentage of products that do not adhere to specifications Scrap Materials that are deemed unusable and are disposed of
TGP Thermal Gas Products
VA Value Adding
8
1 Introduction
In this chapter introductions will take place. First the company and responsible department will be introduced. This is followed by their motivation to tackle the issues regarding the LFE assembly process, this includes their description of the problem. The issues are put in context with one another and a core problem is identified. Lastly the approach for tackling the core problem is explained.
1.1 Bronkhorst High-Tech
This section will provide some background information on Bronkhorst High-Tech as a whole and
specifically about the engineering department. This department carries the responsibility for this project.
1.1.1 The company
Bronkhorst High-Tech based in Ruurlo, The Netherlands, produces customer-specific low flow fluidics handling solutions. They make these flow meters and controllers for both gasses and liquids. They are an international company with sales and support offices in several foreign countries like Germany, Japan and the United States of America. Their products are used in a wide variety of industries, including but not limited to the semiconductor industry, the food-pharma industry and healthcare industry.
Bronkhorst High-Tech was formed in 1981, in the past 38 years the company has grown significantly with currently approximately 450 employees at the headquarter in Ruurlo. The growth can also be seen in the expansion of the production site (for a complete overview see appendix A), currently the production site has a total area of around 35.000 m2, this does not include their most recent purchase of another 5.300 m2.
Apart from producing the flow meters Bronkhorst High-Tech also provides several services, among others maintenance and support. But perhaps the most remarkable service the company provides is the product training, Bronkhorst High-Tech has training facilities for their customers to help them understand and work with the equipment. They offer these services for their current products, but also for their older products that might still be in use by some clients. For example ASML prefers to keep using their older versions of the flow meters since their production processes are very sensitive to any kind of change. These services not only ensure that customers might choose Bronkhorst over one of her competitors, it also reflects the company’s desire to deliver a quality product and the pride it takes in doing so.
The company has adopted the Lean methodology as a way to continuously improve. Employees are required to follow a Lean yellow belt course provided by the company and they are also encouraged to take on a Lean green belt project. In production the Lean concepts of Poka-yoke (eliminating the possibilities for mistakes) and Kan Ban (having materials and tools readily available) can be found, for example tools are labelled and materials get replenished throughout the day. Since Lean is highly thought of and endorsed in the company and is a methodology fitting with Industrial Engineering and
Management it will also form the theoretical backbone in this project.
1.1.2 The engineering department
The engineering department takes care of the processes within Bronkhorst High-Tech. There are, basically speaking, three different types of engineers in the department; the process engineers, the line engineers and the quality engineers. The process engineers investigate possible improvements for current processes, (re)design processes and design tooling. The line engineers are responsible for the production line and provide technical support to (after) sales. The quality-engineers provide support to production if there are technical difficulties with either the product or the process. They also implement improvements, do research and investigate technical abnormalities to prevent production from shutting down. The engineering department is also responsible for the production of tooling (both hardware and software) and for the methodical development of new processes and improvement upon existing processes.
9
1.2 Motivation
Currently Bronkhorst faces some issues concerning their delivery reliability (their capacity to deliver orders on time). Approximately 25% of the orders are not delivered as agreed upon, see also appendix B. This is caused by the throughput time of their products being too long. The production of Flowmeters follows generally speaking the following steps as depicted in Figure 1-1.
Figure 1-1. Flow chart production of flowmeters
For a complete overview of the process starting from “Order” up until “Order completion” see appendix C. The assembly of LFE packages, the assembly of the sensor and calibration are, relatively speaking, the most time consuming steps. The sensor assembly is being tackled in the project concerning the new production cell. The calibration of the flowmeters is going to be altered in the near future. That leaves the LFE package assembly process to be taken on, as also requested by the company.
The company identified the following problem: The current LFE package assembly process does not seem efficient and is prone to human mistakes. The stacking of LFEs is currently done by hand, all the sub processes take a substantial amount of time. There should be alternatives to stacking them by hand that save time and make the process less prone to mistakes. Possible solutions might be using a robotic arm to stack the LFEs or to discuss with the supplier of the LFEs if there are possibilities to get the LFEs delivered in readymade packets. All the sub processes are currently sensitive for human mistakes, especially if the employee working on the LFE packets loses some focus. People might miscount when picking the right number of LFEs out of the container. Also, the LFEs might stick together a bit, possibly causing problems with both the number of LFEs and the orientation of them. As stated in §1.1.2 the engineering department is working on a new type of production cell for the production of flow meters, this has to be taken into account in this project.
1.3 Problem context
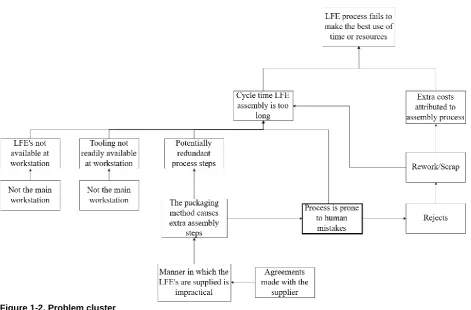
The starting problem that was given states that the assembly process of the LFE packages is inefficient. To effectively connect the underlying problems to the inefficiency of the process there needs to be a clear definition of what inefficient actually means, for it is not just a feeling. “Inefficiency; failure to make the best use of time or resources” (Oxford University Press, 2019). This definition fits the problem like a glove, there are indeed issues with time and quality in the assembly process. The cycle time is too long and extra costs are attributed to the assembly process due to defects in the LFE packages. Time is lost in the process in several ways; the right materials and tools are not always readily available at the
workstation putting the entire process on hold before it has even started. The assembly process contains steps that would have been redundant if the LFEs where supplied in a more practical manner. Due to these extra process steps, the fact that mistakes are easily made (not Poka Yoké) and that the assembly process has not changed in the last decade to conform to the new demands (more variety, more orders), the process is sensitive for human mistakes. Which brings us to the second part of inefficiency:
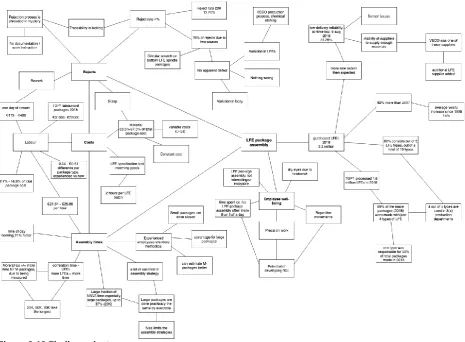
10 Figure 1-2. Problem cluster
1.4 Core problem
In the problem cluster several potential core problems can be identified. Due to the time limit associated with a bachelor assignment not all problems can be tackled, one of the problems will be chosen to be the main focus of the thesis. To narrow down the wide array of potential core problems some options will be eliminated.
The issues concerning the availability of materials and tools only have a small effect on the initial problem. There is definitely time to be won here, but that won time will only be in the set-up time, not the production time itself. Set-up occurs only once for maybe 20-30 LFE packages of the same type.
Therefore it will only save time once, while an alteration in the production processes themselves will save time each time a product is made. Since the core problem needs to be the problem with the most
potential gains these two problems (the missing tools and the missing materials) are eliminated from consideration.
The branch on the problem cluster concerning the way materials are packed and supplied by the supplier is eliminated from consideration. One rule to choosing a proper core problem is the fact that the problem needs to be a problem that can be sufficiently influenced. Considering that in these problems an external party is involved, that the supplier is located in England and that negotiations usually take a long time the influence is limited. This potential core problem is eliminated, due to lack of influence.
11 The current process design is a cause of the reject rate being approximately 4.5% instead of the targeted 2%, additionally the current process design leaves room to improve on the assembly time.
To gain insight into the magnitude of the core problem the following indicators are identified: Reject rate LFE packages
The percentage of LFE packages that gets rejected. This indicator gives insight into the quality of output from the LFE package assembly process. Subsequently it also provides some insight in the sensitivity for mistakes in the process. Additionally the reject rate will be used in the evaluation of the solution.
Assembly time LFE packages
The time it takes to assemble a LFE package, from picking up the first part till putting the finished LFE package down on the workbench, set-up time and cleaning are not included in case of the single timed assembly times (§2.3.1). This indicator is used to provide insight in the duration of the LFE package assembly. It will prove useful in evaluating the solution, as every bit of time saved adds to making the process more efficient.
Scrap/reject costs
The costs incurred by rejected LFE packages, this includes the materials that get scrapped, the labour used for the possible rework and any new materials that may be used to rework an existing rejected LFE package. This gives insight in the monetary value of rejecting LFE packages, giving a look at the
magnitude of the reject rate.
The eventual goal of this project is as follows:
The thesis will aim to provide the company with an alternative process design for the assembly of the LFE packages. This alternative design should halve the current reject rate, preferably getting the reject rate as close to the target of 2% as possible, and reduce assembly times by 15%.
1.5 Approach
To tackle this problem certain steps will be taken, these steps will be described in this section and correspond with the other chapters of this thesis. The first step towards solving the problem is analysing the current situation. Once the current situation is sufficiently clear alternative process designs will be formulated. These alternatives will be assessed and the most fitting will eventually be chosen and recommended. This recommendation will include an implementation plan.
Limitations
Of course as with any project there are certain limitations, both in time and resources. This project must be executed within 10 weeks, this does not only partially limit the scope but also the amount of data that can be gathered from measurements and experiments. This is especially the case with the collection of rejects. On the other hand there is also the aspect of resources, the production department that is
available for field research is TGP1. However any experiment or measurement is of course dependant on the production schedule of this department. Another resource is of course information, there will be literature studies done in this project, these studies might be limited by the availability of certain papers.
1.5.1 Analysis of current situation
To gain a better understanding of the current situation data needs to be gathered and processed. With this data the extent and detail of the problem should get clearer and will make formulating alternatives in the following phase easier. The data that is needed are the assembly times of LFE packages and their reject rate, this raises the following research questions:
What are the current assembly times for LFE packages?
12 to the fact that set-up occurs only once for each batch, when looking at individual LFE packages it would give a skewed image if set-up time was taken into account for the one package.
What is the current reject rate of LFE packages?
Rejected LFE packages are not currently registered. The rejects are collected in the production department and once it’s a substantial amount one of the employees takes a look at the rejects. To get some insight in the rate at which LFE packages are rejected they will need to be monitored.
The collection of rejects will also be done with help of the TGP1 production department. They agreed to collect the rejects, periodically handing them over so they can be documented and investigated. In the first period (during the writing of the project plan), to gain a general idea of the reject rate, the rejects were collected once every three weeks. In the second period (the actual conduction of research) the rejects are collected every week.
1.5.2 Creation of alternative process designs
The current process seems to be non-satisfactory, so more appropriate alternatives should be formulated. Lean is a widely promoted and accepted methodology in the organization, it could provide methods to improve upon the existing process. Alternatively the entire process can be redesigned, the basis for these alternatives should be looked for in literature and of course within the company itself. By using these different approaches several alternative process designs should be formulated. The accompanying research questions in this phase are as follows:
What Lean methods could be used to improve the current process?
Since Lean is a widely adopted and promoted methodology within the company and by definition suitable to optimize processes, it would fit to use it to improve this particular process as well. However the specific methodologies within Lean that could be applicable to this process are currently unknown.
A systematic literature review should provide insight in the available and applicable Lean methods. The focus of the search for literature (besides Lean) will be on the manual aspect of the current assembly process. This should narrow the wide range of applications Lean has to more fitting methods for this particular instance.
What methods are available for the redesign of manual production/assembly processes?
The current process is not adequate and thus alternatives should be found. While Lean is an already accepted methodology in Bronkhorst High-Tech, it is not the only methodology that is out there.
Additionally Lean often works in unison with other methodologies. Therefore it would be helpful to know which other methods are already present in literature to tackle the redesign of a manual
production/assembly process.
Yet again a systematic literature review should provide insight in the available and applicable methods. Similar to the research done on Lean methods the focus will be on the manual aspect of the assembly process.
Which ideas are already present in Bronkhorst High-Tech on how to improve/alter the LFE assembly process?
There is a common consensus amongst the employees that the LFE package assembly process is far from optimal. Where there are whispers of discontent with a process, there are bound to be ideas on how to improve it. Interviews might prove a too heavy tool for the intended research in this case, instead some semi-casual conversation will be held with employees most closely involved in the process. This includes the production personnel and the engineers of the engineering department. The found ideas will be put in an overview. Then after doubles have been eliminated and similar ideas have been paired, the ideas will be filtered on feasibility. In the end some of the best ideas might be taken into account.
1.5.3 Assessment of alternative process designs
13 What criteria would a new process design need to meet?
The new process design will need to be within the boundaries set by the company. There will be certain demands and wishes for the process which will need to be taken into account. To properly choose a final process design these demands and wishes need to be known.
Through interviews the demands and wishes for the new process design should become clear. The interview will consist out of questions directly focused on what the new design would need to accomplish with some room for elaborations. The interviews will be conducted in both the process engineering department and the production departments where both production leaders and regular employees will be questioned.
What assessment method is suitable/preferred by experts in the field for the assessment of a process design?
Once several alternatives are formulated their usefulness/effectiveness needs to be determined. There are several methods of assessing multiple concepts. It would be helpful to know what methods are commonly used and preferred in a production environment, so one of these methods can be deployed in this project as well.
Again literature will be consulted. Once several assessment methods are found they will be paired with the criteria that surfaced from the interviews. The pairing, that seems most suitable (based on literature and criteria) will eventually be used to assess the alternative designs.
1.5.4 Choice of alternative process design
After the results of the assessments are known, they can be further discussed. One of the (by the assessment) proposed will be chosen to be the alternative that is going to be pursued. This alternative will be elaborated upon by the means of an implementation plan. The implementation plan should provide the company with a clear path they can take, sufficiently clear that it can be executed without necessarily reading the accompanying thesis. This raises one final research question;
What are methods for writing an implementation plan are commonly used?
There are many different ways to propose the implementation of a new process, to give is some structure a certain method or lay-out for an implementation plan could be very useful. Preferably a company standard or else an industry standard could be used in formulating the final implementation plan. First of all there will be checked if there is a standard template for a production plan present in the company. If that is not the case or the template does not seem sufficient, literature will be consulted to find another method for formulating the implementation plan.
1.5.5 Conclusions and recommendations
14
2 Analysis of current situation
In this chapter the current situation will be looked at. First the LFE assembly will be looked at by the means of a bird-eye view, this will include a throw-back to earlier years and some insight into the
production department TGP1 (Thermal Gas Products). Then, when the general situation around the LFE assembly process is clear, the process itself will be explained more thoroughly by the means of a detailed explanation accompanied by flowcharts. Once the process is discussed in sections 2.1 and 2.2, section 2.3 and 2.4 will give a more quantitative insight in the assembly process and its issues. When both the qualitative and quantitative aspects have been discussed the findings will be summarized in section 2.5.
2.1 General
As mentioned in section 1.2 Bronkhorst has some issues regarding the delivery reliability (appendix B). A substantial number of orders are not shipped on time. This issue started in 2016, after approximately 2 years of being above the targeted delivery reliability. In this year the initial significant drop in delivery reliability can be seen, heralding more troubled times to come. Throughout 2016 and 2017 the delivery reliability kept dropping with an occasional uplift. By the end of 2017, early 2018 the delivery reliability dropped dramatically. On the 6th of august 2018 the delivery reliability reached an all-time low of 31.28%. This drop had several causes, as can be identified by examining the GWOs (Group Work Discussion; meetings with the goal to communicate important information with the organisation) from this and the following periods. There was an unexpected increase in new orders, production was plagued by faulty sensors and due to the inability of suppliers to supply more materials in this period overtime was not always an option to tackle the number of orders. The sensor issues were tackled in cooperation with the suppliers of the (faulty) sensor parts. The sole supplier of LFEs was one of the suppliers struggling with supplying enough materials, this revelation prompted the search for an additional supplier capable of making these precision parts. The plans for this new supplier of LFEs are still being drawn, however it is already known that at first only 1 or 2 types of LFEs will be produced there.
The need for materials in the period where the delivery reliability dropped, in particular LFEs, can be well observed when looking at the purchasing data of the LFEs. In 2018 more than 3 million LFEs have been purchased, this is a 92% increase relative to 2017. The purchasing data also provides a view of the increase in workload for the LFE package assembly process. When looking at the purchasing data since 1995 (which can be found in Appendix D) an average yearly increase of 14% can be seen in the amount of purchased LFEs. Again just like the revenue, personnel numbers and the acreage another indicator of the growth Bronkhorst is experiencing.
Interestingly 80% of the LFEs bought in 2018 consist of only 5 different types out of a total of 19 types. 4 of these LFE types are used in the larger packages containing a greater number of LFEs. Additionally these 4 types are used in multiple production departments. For example production department TGP1 uses these 4 types. In 2018 69% of the LFE packages made by TGP1 were made with these 4 types, most notable is 1 type that makes up 33% of the total number of packages made in that year. This type is used for 4 different LFE packages, both small (7 LFEs) and larger (up to 65 LFEs) packages.
Equally interesting is the fact that the TGP1 production department processed approximately 1.6 million LFEs in 2018, which is about half of the total number of LFEs purchased in that year. TGP1 consists out of a team of approximately 30 people, most people of this department are instrument makers and they don’t have a set function in the production of flowmeters. As they enter the production facility they can choose which task they pick up (of course given the priority set by the schedule), it could be assembling a LFE package, a sensor or even the final assembly of the flowmeter. They are relatively free in which task they pick up and can switch during the day.
2.2 The process
In this section the production processes and the reject process will be discussed. Each process will be shown in a visual manner through a flow chart and further elaborated upon in their own paragraphs.
2.2.1 The production processes
15 process in itself has remained much the same since the company’s founding in 1981. The LFE packages are manually assembled on a flow bench with variations mostly in the number of LFE, type of LFE and in some cases the way of making sure the right number of LFEs is included in the package. The LFE packages are generally made in batches of varying sizes.
For this research the production department TGP1 (Thermal Gas Products) was available for
observations, questions and basically everything that might be needed to conduct the research, of course within the limits of the production schedule. In this department 14 different types of LFE packages are made, previously 16, however they moved the production of two types to TGP2. These 14 types can be divided in roughly 3 categories; the spindle packages, the 50/70K packages and the M-packages. They all have very similar process, but there are slight differences in their assembly.
Spindle Packages
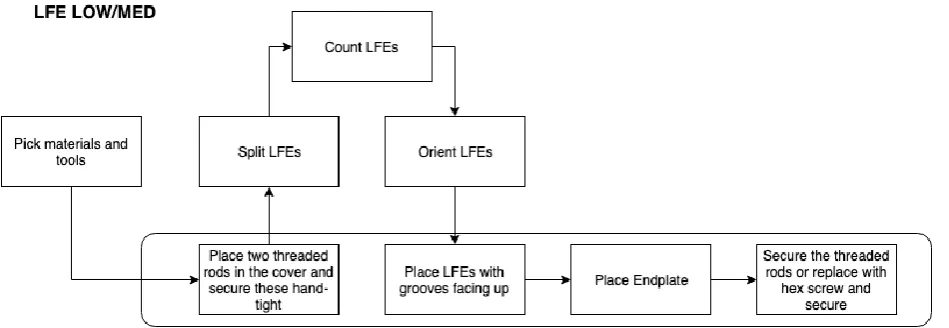
[image:15.595.71.546.317.456.2]With ten different types this category of packages forms the majority of package types within TGP1, the packages included in this category are: 020, 050, 100, 200, 500, 1K0, 2K0, 5K0, 10K, 20K. The number of LFEs per package ranging from 2 till 65 with three different types of LFEs to go around. The assembly process is the same for all of these package types. The process is shown by the means of a flowchart in Figure 2-1. The process steps within the rounded rectangle are the steps that are described in the work instructions, the steps outside of it are not described but they are performed and currently necessary.
Figure 2-1 Process flow chart spindle packages
The LFEs are counted by hand and due to their tendency to stick together they often need to be
separated during or before counting them. The LFEs used in these packages get supplied in small plastic bags containing a fairly random number of LFEs. In case of the Spindle packages the LFEs are stacked on a spindle.
50/70K packages
[image:15.595.71.546.582.746.2]The smallest category of package types, containing only two different packages; the 50K and 70K. They either contain 55 or 74 LFEs, both use the same type of LFE. The assembly process is the same for these two packages and can be seen in Figure 2-2.
16 The process steps within the rounded rectangle are the steps that are described in the work instructions, the steps outside of it are not described but they are performed and currently necessary. The LFEs used in these packages are also supplied in plastic bags with a fairly random number of LFEs in them. The LFEs get mounted on a cover in case of the 50/70K packages.
The M-packages
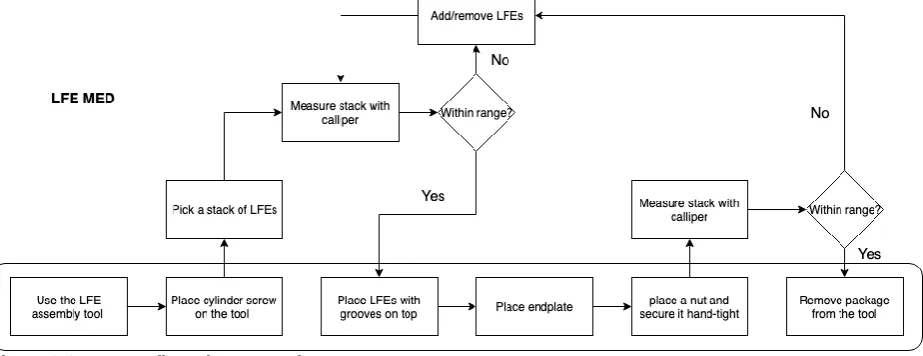
[image:16.595.76.538.244.422.2]The category of packages that have the highest flow capacity in the TGP1 department. This category contains 4 different types of LFE packages; the M10, M20, M50 and 1M0. The number of LFEs used in these packages ranges from 80 till 361 LFEs and have two different types. The process is quite a bit different from the previous two categories, instead of counting the LFEs they now measure a stack of them to see if they have enough LFEs. As can also be seen in the flowchart of this process in Figure 2-3, the process steps within the rounded rectangle are the steps that are described in the work instructions, the steps outside of it are not described but they are performed and currently necessary.
Figure 2-3 process flow chart M-packages
The LFEs used in these packages are supplied on rods, they are pre-oriented and the number of LFEs on a rod is either 450 or 500 depending on the type. The LFEs in these packages are larger and differently shaped than the ones in the spindle or 50/70K categories, this enables this specific manner of supplying them.
2.2.2 The reject process
Whereas the production process has been clear since the beginning the reject process has been as vague. A different process is defined each time a different person is asked about it and all of them seem convinced that their version is the right one. The company’s documents do not help the situation, the work instructions simply state to alert the team coordinator. This does not seem to happen in practice,
production employees usually solve the situation themselves unless something is exceptionally wrong.
[image:16.595.68.531.568.755.2]17 The flowchart depicted in Figure 2-4 shows the rejection process according to the team coordinator. The step in which it is checked if the LFE package is indeed the reason for the abnormality is relatively new. They used to take out the LFE package without checking if it truly was the issue and put it directly in the reject container. The disassembly of rejected packages occurs roughly every two weeks. Once the reclaimed materials have been cleaned there is no way to tell them apart from the other materials. Traceability is not ensured for these materials. Traceability is a bit of an overall issue in the LFE package process. Where the other production steps are signed for by the employee that performed them the LFE package does not come with any documentation, signature or even a date of when it was made or by whom.
It also stands out that the rejection documentation system (PAR system) is not included in the process. The rejected LFE packages do not get registered or documented in any way, shape or form. One of the older employees in TGP1 did mention that according to (an old) procedure they actually should register the rejects in the system. It seems this never made it into the routine of production, even though it might have been the intention.
The process, as described by the team coordinator, is quite clear. However, as said, when the employees were asked about the process the answers differ from this process and from one another. This could be due to recent changes to the rejection process, which might not have been as clearly communicated as was necessary. The fact that this process cannot be found in writing is not helping either, people have no other choice than to ask the team coordinator or one of the other employees what they are supposed to do. Having to ask the team coordinator something that might be deemed trivial could deter the employees from asking the team coordinator and instead ask the question among the other employees, who might not know the exact process either. Having a simple instruction available could solve any confusion about the process in a very accessible manner. The process would then no longer be shrouded in mystery.
2.3 The assembly times
To gain more insight in the process and its shortcomings several measurements were taken concerning the assembly times. First, to gain a general idea of the assembly times and the differences between package types, measurement were taken of the assembly of individual packages. Then, to gain a more representative picture, normal production was measured. In this section the findings of these
measurements will be discussed.
2.3.1 Assembly times per package type
To gain insight in the assembly procedure, (possible) influencing factors and assembly times the first measurements were done separate from regular production. In this case 4 people from TGP1 were asked to make 2 of each type of package, for each separate package a time measurement would be done. The time measurements do not include set-up time. The experiment/observation involved two experienced employees and two less experienced employees. Measurements were both conducted in the morning and afternoon, both with an experienced and a less experienced employee. The data gathered from this experiment/observation can be found in appendix E and will be further discussed in this paragraph. Average assembly times
First, without differentiating between the data, the average assembly times are calculated and presented in a graph (see Figure 2-5). This graph provides several interesting (and perhaps somewhat predictable) insights. The transition between different LFE types is clearly visible. The graph builds due to an
18 Figure 2-5 average assembly times (in minutes) per package type
The package with the longest average assembly time is also the package with the highest number of LFEs that are still manually counted instead of measured. The graph shows the correlation with the number of LFEs and the assembly times clearly for the manually counted packages. As for the
M-packages, which are measured with a calliper, it seems curious that the M50 and the 1M0 take quite a bit longer than the M10 and M20. The M50 and 1M0 are considerably larger, but since these packages are measured rather than counted, this shouldn’t make much difference. However as stated earlier in section 2.2 the M50 and 1M0 were moved to a different production department. The TGP1 employees were so kind to include these for this project but they were a bit out of practice, increasing the assembly times for the M50 and 1M0.
Experience
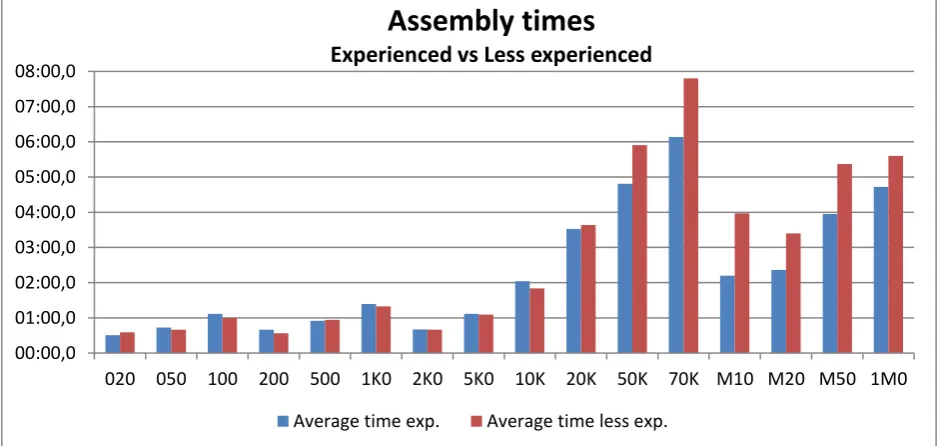
This time the data is split between the experienced and the less experienced employees. The task of assembling the LFE packages is generally viewed as a simple one. But there isn’t a saying “Easy to learn, difficult to master” for nothing. To gain insight in the importance of experience the two data sets are compared in Figure 2-6.
Figure 2-6 Assembly times (in minutes) experienced vs less experienced employees
Surprisingly the experienced employees are generally a bit slower up until the 10K packages and then overtake the less experienced employees with the larger packages. This can, however, be explained; the more experienced employees are often more methodical, creating little pairings of LFEs before stacking them, making it easier to keep count. Some of the less experienced employees count the LFEs while stacking them, making them somewhat faster. With the larger packages however the immediate stacking of the LFEs isn’t deemed convenient anymore by the less experienced employees and they too refer back
00:00,0 01:00,0 02:00,0 03:00,0 04:00,0 05:00,0 06:00,0 07:00,0
020 050 100 200 500 1K0 2K0 5K0 10K 20K 50K 70K M10 M20 M50 1M0
Average assembly times
00:00,0 01:00,0 02:00,0 03:00,0 04:00,0 05:00,0 06:00,0 07:00,0 08:00,0
020 050 100 200 500 1K0 2K0 5K0 10K 20K 50K 70K M10 M20 M50 1M0
Assembly times
Experienced vs Less experienced
19 to methodical counting. This is where the experience from the experienced employee comes in handy. Where this experience is perhaps even more essential are the M-packages, as the employees have to make an initial estimate on the size of the stack of LFEs that they pick. An experienced employee
generally makes a more accurate estimate and needs less measurement cycles to have the right number of LFEs.
Time of day
Apart from experience, the time of day might also affect the employees and consequently the assembly times. Assembling LFE packages is a precision task and it isn’t all too hard to imagine that after a morning of hard work the focus of employees might be wavering a bit, increasing assembly times.
Figure 2-7 assembly times (in minutes) morning vs afternoon
This premonition turns out to be likely when looking at the data in Figure 2-7. For nearly all LFE package types the assembly times are longer in the afternoon. To be more precise; on average the assembly times in the morning are 21.8% faster than the assembly times in the afternoon. Due to the limited nature of this data, no hard conclusions can be drawn, however it is most certainly worth keeping this
discrepancy in mind.
2.3.2 Batch (regular) assembly times
To gain a more wholesome view of the assembly times regular assembly was timed, this included set-up time, picking materials during assembly, counting and orienting the LFEs, cleaning/tidying the workspace and of course the assembly itself. Due to the fact that regular production was timed there is only data on certain types of LFE packages. A total of eleven measurements where done. The main findings are depicted in Table 2-1, for a more elaborate table please refer to appendix G.
Type Number of packages
Number of activities
Total time Average time per package
Fraction of time NNVA
Fraction of time
VA
included in assembly times (assembly strategy)
20K 11 26 0:48:54 04:26.7 68.66% 35.06% pure assembly
50K 9 23 0:41:37 04:37.5 51.67% 48.33% pure assembly
500 26 11 0:28:49 01:06.5 41.53% 58.45% pure assembly
100 14 8 0:17:47 01:16.2 34.61% 65.25% counting
020 20 3 0:09:38 00:28.9 23.81% 76.19% counting
020 28 6 0:15:30 00:33.2 23.03% 76.97% pure assembly
5K0 20 9 0:24:37 01:13.9 17.75% 82.23% counting & orienting
2K0 20 3 0:12:47 00:38.4 17.13% 82.87% counting & orienting
00:00,0 01:00,0 02:00,0 03:00,0 04:00,0 05:00,0 06:00,0 07:00,0 08:00,0 09:00,0
020 050 100 200 500 1K0 2K0 5K0 10K 20K 50K 70K M10 M20 M50 1M0
Assembly times
Morning vs Afternoon
20
M20 15 9 1:00:29 04:01.9 17.11% 82.90% N/A
M10 6 4 0:22:34 03:45.7 11.06% 88.94% N/A
10K 20 4 0:31:57 01:35.9 2.63% 97.37% counting & orienting
Table 2-1 main findings measurements batch (regular) assembly times
In the table several bits of information are given and whereas some might speak for themselves, others do not. The number of activities refers to the different sections of the total time, this can be assembly, set-up, etc. that follow one another. For example the string of activities is: set-up, assembly, picking materials, assembly, clean up. Then the number of activities would be 5. Then the different fractions of time; NNVA (Necessary but Not Value Adding) and VA (Value Adding). These categories differentiate between the customer value of different activities. Making this distinction is a widespread practice in Lean manufacturing (Bicheno & Holweg, 2016). In this case all activities that do not involve direct assembly are regarded as Necessary but Not Value Adding, this includes counting and orienting when those activities are done separately. The last column that needs some explaining is the assembly strategy. Every production employee has a separate approach to counting, orienting and stacking the LFEs. Some will first count and orient the LFEs before stacking them, while others might count and orient while stacking. In this column any additional activities that are included in the assembly activity are mentioned. Pure assembly means that neither counting nor orienting was done during the assembly activity. This column is not relevant for the M-packages, the LFEs do not get counted or oriented in this case.
The table provides several insights. The larger packages that are still counted by hand have the highest average time and the largest fraction of NNVA. While the 50K (out of the package types that were measured) takes on average the longest, the 20K takes the cake when it comes to time spent on NNVA activities. About 63.6% of the time spent on the 20K packages consists out of counting and orienting (the other 5% is spent on set-up, cleaning and picking materials). As might be expected the smaller packages have a lower fraction of time spent on NNVA activities. Due to the small number of LFEs that are
necessary, there is not much counting to be done. Additionally since these packages use so little
materials there is not much need to replenish those during assembly, usually the LFEs picked during set-up are more than enough to make the desired number of packages.
Most employees have the same assembly strategy for the larger packages since they contain such a large number of LFEs that need to be counted by hand. The LFEs for these packages are first counted and oriented (pure assembly) by almost all production personnel. The 10K on the other hand is done differently depending on who is assembling the packages, in this case counting, orienting and stacking was done simultaneously. This entails that both the counting and orienting is included in the VA time instead of the NNVA, which explains why the fraction of NNVA time is so low.
According to the analysis based on added value, the most time to be won is in the counting and orienting steps (and perhaps some of the set-up and cleaning time) of the larger, hand counted, packages. If the time spent on these steps could be reduced or if these steps could be eliminated, more time would be available to spend on other tasks in production.
2.4 The rejects
In this section the reject rate will be discussed. First a general overview of the reject rate will be given, then it will be investigated what is causing the rejects and finally what costs are tied to these rejects. All data on the rejects is gathered in TGP1.
2.4.1 General reject rate
21 When looking at the total production and the total collected number of rejects in the 9 week period, an overall reject rate of 4.01% can be observed. However when looking at the different three week periods it becomes apparent that there are some variations between the periods. As can be seen in Table 2-2. Periods 1 and 2 are practically equal when it comes to reject rate, even though the production and number of rejects are quite different. Period 3 had the largest production output but the lowest reject rate of all periods.
Period Reject Rate
Period 1; week 7 till 9 4.75%
Period 2; week 10 till 12 4.76%
Period 3; week 13 till 15 2.51%
Total; week 7 till 15 4.01%
Table 2-2 Reject rate of several periods
There are several explanations for the reduced reject rate of period three. First off, it is quite possible that not all rejects were collected. The collection of rejects only happened once every three weeks and it had been going on for a while at that point, (a part of) the production personnel might have forgotten to carefully collect all rejects as requested. Secondly, it seemed that as time moved on and rejects were collected, that more package types were tried a second time (in a new body) after being noticed in calibration. Lastly, it would not be very surprising that out of habit some rejects have been reworked, scrapped or otherwise displaced.
The variation in the reject rate might also be a “natural” occurrence. It could correspond with the
production personnel that made the packages that were used in that particular week. However due to the lack of traceability with LFE packages this cannot be determined.
Another particularly interesting bit of information that can be extrapolated from the collected reject data is the reject rate of the 20K packages (the reject rate of the other packages can be found in appendix H). These were the package with one of the highest assembly times and greatest percentage of necessary but not value adding time. Again looking at the whole nine week period an overall reject rate of 13.70% can be determined for the 20K. Significant variations in reject rate can be observed when looking at the three separate periods, as seen in Table 2-3. In this case period two had the lowest production output with 20K packages, yet had the highest number of rejects and thus the highest reject rate. As said without the ability to trace the packages it is difficult to determine why there is such a spike in 20K rejects.
Period Reject Rate (20K)
Period 1; week 7 till 9 12.42%
Period 2; week 10 till 12 24.44%
Period 3; week 13 till 15 6.10%
Total; week 7 till 15 13.70% Table 2-3 Reject rate of 20K packages of several periods
2.4.2 Issues causing rejects
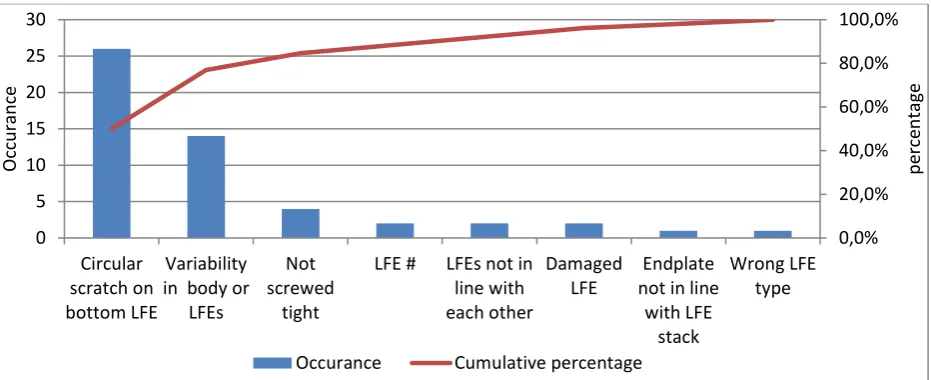
Rejects are often identified during the calibration of the flowmeter, it will become apparent that there is a deviation most likely caused by the LFE package. However they can’t tell during or after the calibration what is exactly wrong with the LFE package. Therefore more research was necessary, a total of X LFE packages have been disassembled to figure out what causes them to be rejects. The found short-comings, if there were any, will be analysed by the means of a Pareto analysis.
22 Figure 2-8 Pareto analysis reject causes
After disassembling 52 different rejected LFE packages several defects where found. Surprisingly the predictable defects (wrong orientation and wrong number of LFEs) hardly occurred. The (possible) defect that occurred by far the most was a peculiar damaged LFE (a circular scratch) which had not been encountered or thought of before. This, and the other defects, are included in the Pareto analysis found in Figure 2-8.
In the chart is can be seen that the circular scratch occurred in 50% of the disassembled LFE packages. This scratch occurred only in the spindle packages on the LFE that was adjacent to the cover of the spindle package. Often a slight difference could also be observed on the surface of the spindle corresponding with the location of the scratch on the LFE. It is not certain whether this scratch is the cause for rejecting the package, it is however likely and the scratch is most certainly not supposed to be there. These findings have also been reported to the Quality engineers of TGP1.
The Quality engineers did some investigating and concluded that the circular scratch does not influence whether a package will be a reject or not. They collected a few of the damaged LFEs and observed them under a microscope to see if the scratch would interfere with the grooves of the LFE. This was not the case as can be seen in Figure 2-9. Therefore the rejects with a circular scratch where likely caused by variability in the LFEs themselves, the bodies they were mounted in or a combination of the two, as will be further discussed below Figure 2-9.
Figure 2-9 Close up of the circular scratch on a LFE
It also occurred that the rejected package seemingly had nothing wrong with it; the materials seemed undamaged, the number and orientation of LFEs was correct and everything was screwed tightly. That nothing can be observed does not necessarily mean that there is nothing wrong with it. It is known that due to the production process of the LFEs a part of the produced LFEs is above specifications (a larger
0,0% 20,0% 40,0% 60,0% 80,0% 100,0%
0 5 10 15 20 25 30
Circular scratch on bottom LFE
Variability in body or
LFEs
Not screwed
tight
LFE # LFEs not in line with each other
Damaged LFE
Endplate not in line
with LFE stack
Wrong LFE type
p
erce
n
ta
ge
Occu
ra
n
ce
[image:22.595.197.411.525.696.2]23 flow capacity) and below (less flow capacity). The flow canals of LFEs are produced by the means of chemical etching. Because the etching liquid is sprayed from the sides onto the sheet containing the LFEs the etching liquid is fresher on the outer rim of the sheet. This causes the LFEs on the outer rim of the sheet to have deeper canals then the LFEs in the middle of the sheet where the etching liquid is not as easily refreshed. Therefore the LFEs on the outer rim of the sheet have a higher flow capacity than the ones in the middle as depicted in Figure 2-10.
Figure 2-10 flow distribution of a batch (sheet) of LFEs
When the LFEs with a higher flow capacity are mixed with the lower ones, the overall package might be up to specifications. However should all the LFEs with a higher flow capacity be put in one package, the package will also have a higher flow capacity than specified. The same story goes for LFEs with a lower flow capacity. It is possible that the LFE packages that have been rejected without an obvious cause are plagued by this variation caused by the production process of the LFEs. In Bronkhorst there is a project running in the supplier engineering department concerning this variation.
Another explanation for the rejection of seemingly good LFE packages is that the packages are indeed within specifications. There can also be some variation within the body where these LFE packages are installed. The combination of variation in the body and variation in the LFE package can cause one package to be a reject due to one body, while being a perfect fit for another body.
The circular scratch and the seemingly not defective packages are responsible for 77% of the rejects. Showing that indeed a small amount of the causes can create the majority of the rejects. While all issues should be addressed eventually, these two issues should be given priority for as far as possible.
2.5 The costs
Of course time and quality would not be an issue if there would not be any money involved. Therefore to gain even more insight in the magnitude of the issues that plague this assembly process the costs should be analysed. In the first paragraph the regular costs of assembling LFE packages is looked at, in this situation it is assumed that the process runs flawless. Then in the following paragraph the costs of rejects will be looked at. Lastly the labour costs and the rejects will be combined to give a more complete view of the total costs and the potential savings.
2.5.1 The regular costs
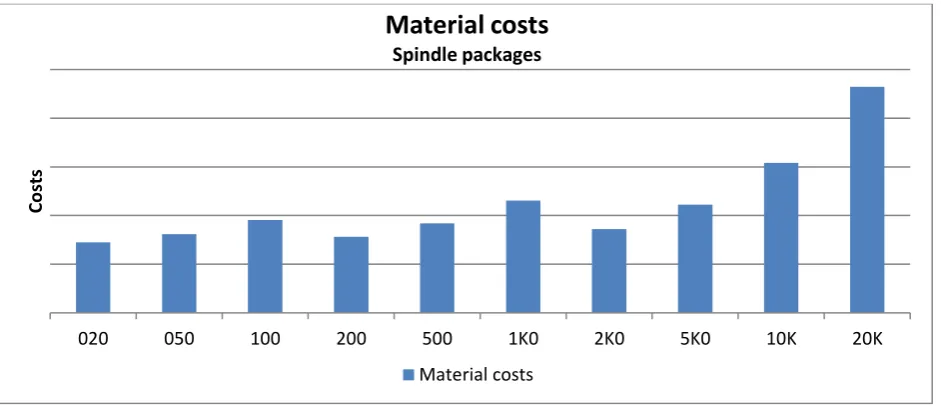
The costs of assembling the LFE packages can be roughly divided in material and labour costs. The costs for tools and (running) the flow bench are neglected, they are assumed to be fixed costs. Material costs
24 Figure 2-11 Material costs per LFE package type
Labour costs
Since this process is done completely manually there are also quite some man-hours for the company to pay. The labour cost can vary quite a bit depending on several factors. It is assumed that only production personnel with the function of (ass.) instrument maker 1 assemble the LFE packages. This function sits in salary scale F, within Bronkhorst this scale has 10 regular steps and two additional steps which can be used for outstanding performance. The two additional steps are disregarded in calculations. The average time in function of these (ass.) instrument makers is about ten years, however there is a clear division between the instrument makers in the years in function. About half of the instrument makers have been with Bronkhorst for approximately twenty years, the other half for less than two years. It’s usually the latter halve that assembles the LFE packages. To calculate labour costs calculation method E from the RVO (Rijksdienst voor Ondernemend Nederland) is used (Rijksdienst voor Ondernemend Nederland, 2019).It is assumed that the direct labour costs for the company adds 32% to the gross salary of the employee. For the indirect costs an additional 15% of the total is added. All this information results in the following labour costs as described in Table 2-4.
Function years in F-scale
Gross monthly
salary Direct labour cost
Total labour cost
Total labour cost per hour
0 € 2,280 € 2,964.39 € 3,409.05 € 20.70 1 € 2,333 € 3,033.48 € 3,488.50 € 21.19 2 € 2,383 € 3,097.90 € 3,562.59 € 21.64 3 € 2,435 € 3,165.50 € 3,640.33 € 22.11 4 € 2,485 € 3,230.50 € 3,715.08 € 22.56 5 € 2,536 € 3,297.22 € 3,791.81 € 23.03 6 € 2,587 € 3,363.61 € 3,868.15 € 23.49 7 € 2,666 € 3,466.11 € 3,986.03 € 24.21 8 € 2,737 € 3,558.45 € 4,092.22 € 24.85 9 € 2,786 € 3,621.35 € 4,164.55 € 25.29 10 € 2,848 € 3,702.16 € 4,257.48 € 25.86 Table 2-4 Labour costs of instrument makers
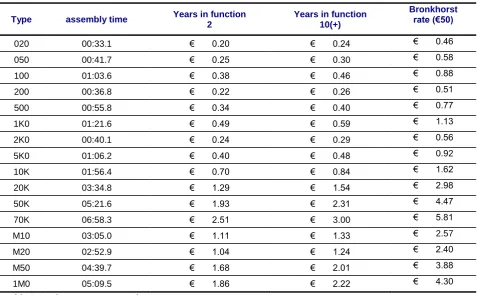
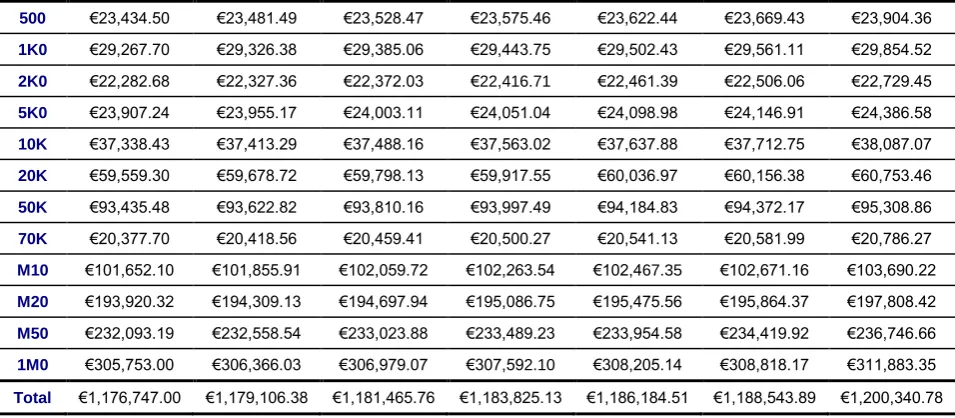
For the labour cost per package type the single timed assembly times will be used, with four different employees per type and the presence of all types is seems the most suitable. In Table 2-5 the labour cost per package type is given for step 2 and 10 of the F-scale. For a complete overview of all steps and their
020 050 100 200 500 1K0 2K0 5K0 10K 20K
Co
sts
Material costs
Spindle packages
[image:24.595.66.539.507.714.2]25 corresponding labour cost per package see appendix J. Additionally, because Bronkhorst often calculates the costs of labour with an hourly rate of €50 this is also included in the table as a worst case scenario.
Type assembly time Years in function
2
Years in function 10(+)
Bronkhorst rate (€50)
020 00:33.1 € 0.20 € 0.24 € 0.46
050 00:41.7 € 0.25 € 0.30 € 0.58
100 01:03.6 € 0.38 € 0.46 € 0.88
200 00:36.8 € 0.22 € 0.26 € 0.51
500 00:55.8 € 0.34 € 0.40 € 0.77
1K0 01:21.6 € 0.49 € 0.59 € 1.13
2K0 00:40.1 € 0.24 € 0.29 € 0.56
5K0 01:06.2 € 0.40 € 0.48 € 0.92
10K 01:56.4 € 0.70 € 0.84 € 1.62
20K 03:34.8 € 1.29 € 1.54 € 2.98
50K 05:21.6 € 1.93 € 2.31 € 4.47
70K 06:58.3 € 2.51 € 3.00 € 5.81
M10 03:05.0 € 1.11 € 1.33 € 2.57
M20 02:52.9 € 1.04 € 1.24 € 2.40
M50 04:39.7 € 1.68 € 2.01 € 3.88
[image:25.595.67.545.119.414.2]1M0 05:09.5 € 1.86 € 2.22 € 4.30
Table 2-5 Labour costs per package type
Considering the output of flow meters of TGP1 in 2018, which can be found in Appendix K. The labour cost incurred by LFE package assembly alone, using the F-scale labour costs, without considering the possibility of rejects, is between €27,037 - €32,311. If the total assembly times could be reduced with 15% these cost would have been €22,982 – €27,464.
When using the Bronkhorst standard labour rate, again without considering the possibility of rejects, the total cost is approximately €62,486.13. If the total assembly times could be reduced by 15% (the target stated in the goal of this project) the total labour costs would be €53,113.21.
2.5.2 The quality (rejection) costs
In the previous paragraph it was assumed that the assembly of LFE packages runs flawless, this is of course an ideal situation and not the case. As was seen in section 2.4 where the rejects have gotten a closer look. In this paragraph the costs that are involved with the rejects are discussed. To give this section more structure the four cost categories as described by the TQM (Total Quality Management) method are used (Slack, Brandon-Jones, & Johnston, 2013). The categories that will be discussed are: Prevention costs, appraisal costs, internal failure costs and external failure costs. The internal failure costs will be quantified for as far as possible.
Prevention costs
“Prevention costs are those costs incurred in trying to prevent problems, failures and errors from
26 engineering department concerning issues with LFEs (as mentioned in paragraph 2.4.2), in this project it will also be investigated if the measurements at Bronkhorst can be eliminated.
Appraisal costs
“Appraisal costs are those costs associated with controlling quality to check to see if problems or errors have occurred during and after the creation of the service or product.” (Slack et al., 2013, p. 551). All flow meters undergo an end test to see that everything is in order. If there are issues with the product it will most likely be found in the end test, once found they can be resolved. If there are issues that cannot be easily resolved or if during/after production faulty materials or sub-assemblies (for example a LFE package) are encountered they are registered in the PAR system. The PAR system contains reported defects of materials, sub-assemblies and products. If there are an unusual amount of PARs on the same subject then it will be further investigated.
Internal failure costs
“Internal failure costs are failure costs associated with errors which are dealt with inside the operation. “ (Slack et al., 2013, p. 552). These costs include, in the case of the LFE packages, the scrap, rework and lost time. According to the rejection process as described in paragraph 2.2.2 LFE packages will first get reworked before they get (partially) scrapped. There is no set schedule to do rework in production, they usually collect the rejects and when the amount seems sufficient (usually every two weeks) one of the instrument makers will spend a day worth of work on reworking the LFE packages. That would mean that each rework session costs, conservatively calculated, between €173.12 - €206.88 in labour costs. When using the Bronkhorst labour rate this would even be €400. Considering that a rework session takes place every two weeks, 26 times a year this would add up to conservatively €4,500.11 - €5,377.87 and using the Bronkhorst rate €10,400.00 During rework parts that are beyond saving are scrapped and replaced, adding cost for the new materials as well as scrap costs for the materials that are not useable anymore. If the reworked package still does not adhere to the set specifications it is usually scrapped in its entirety. The material costs for the whole package, the time spent on initially assembling and reworking it are then practically thrown in a bin. Additionally the time spent by the instrument maker on these rejects could have been spent on another part of the flowmeter. Processes that have perhaps more value added time than the LFE package assembly process (see also paragraph 2.3.2).
External failure costs
“External failure costs are those which are associated with an error going out of the operation to a customer”. (Slack et al., 2013, p. 552). Most of the times if there is a defect due to the LFE package it gets noticed in either the calibration or end test phase of production. It does not happen often that a failure occurs at a customer due to the LFE package. However that it does not happen often does not mean it never happens. There has been an incident at one of the customers back in 2015, the issues with the faulty flowmeter were due to a LFE package having a too high flow capacity. This fault in the LFE package was retraced to the LFEs used in it. The supplier of the LFEs was made aware of this defect (and that it occurred at one of Bronkhorsts customers). They undertook several steps to improve quality control in the production of LFEs.
2.5.3 The complete picture
By combining most of the findings of the previous chapters it can be calculated how much is spend in total on LFE packages and how much there could be potentially saved. These calculations will be done in a conservative way, using the labour cost based on the salary scale, and also according to the Bronkhorst hourly labour cost rate of €50. All calculations will follow the same assumptions.
Assumptions labour costs
For the labour cost per package the single timed assembly times are used, since there is data present for each package type. The fraction of necessary but non value adding will be determined by grouping LFE packages with similar characteristics in a category with one NNVA percentage. The percentages will be based on the batch (regular) assembly times data and can be found in Table 2-6. To determine the amount of rejects the overall reject rate of 4.01% will be used uniformly over all packages types.
Category LFE package types NNVA fraction of time
Small (<10 LFEs), manually counted
020, 050, 200, 2K0 20%
27 manually counted
Large (>35 LFEs), manually counted
20K, 50K, 70K 55%
M-packages M10, M20, M50, 1M0 15%
Table 2-6 NNVA fraction of time per category
Overall labour cost (2018)
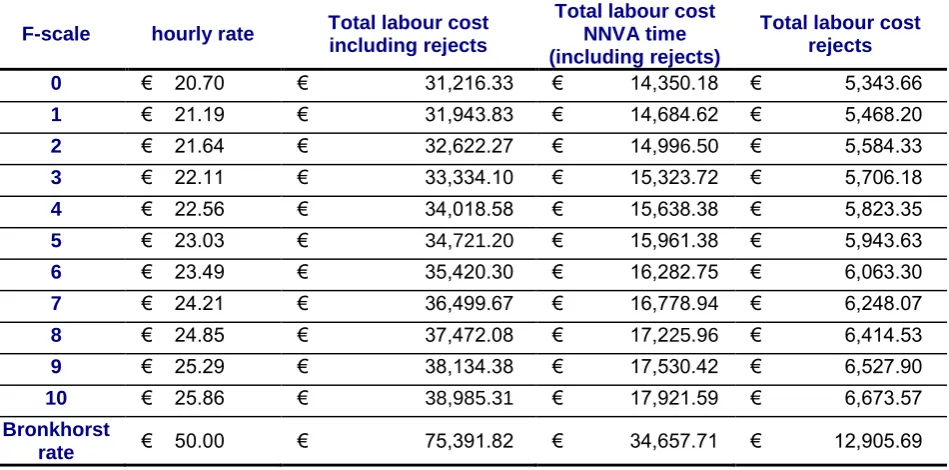
In Table 2-7 the total labour costs incurred by the LFE package assembly process can be found. This includes the regular production of 2018, the estimated number of rejects in 2018 (4.01% of regular production) and the rework costs of a year.
F-scale hourly rate Total labour cost including rejects
Total labour cost NNVA time (including rejects)
Total labour cost rejects
0 € 20.70 € 31,216.33 € 14,350.18 € 5,343.66 1 € 21.19 € 31,943.83 € 14,684.62 € 5,468.20 2 € 21.64 € 32,622.27 € 14,996.50 € 5,584.33 3 € 22.11 € 33,334.10 € 15,323.72 € 5,706.18 4 € 22.56 € 34,018.58 € 15,638.38 € 5,823.35 5 € 23.03 € 34,721.20 € 15,961.38 € 5,943.63 6 € 23.49 € 35,420.30 € 16,282.75 € 6,063.30 7 € 24.21 € 36,499.67 € 16,778.94 € 6,248.07 8 € 24.85 € 37,472.08 € 17,225.96 € 6,414.53 9 € 25.29 € 38,134.38 € 17,530.42 € 6,527.90 10 € 25.86 € 38,985.31 € 17,921.59 € 6,673.57 Bronkhorst
[image:27.595.72.547.206.441.2]rate € 50.00 € 75,391.82 € 34,657.71 € 12,905.69 Table 2-7 Overall labour cost including rework costs (2018)
The total labour costs associated with the necessary but non value adding time ranges from a
conservative €17,921.59 on the top of the F-scale to a whopping €34,657.71 when using the standard rate Bronkhorst uses. In essence these costs could be eliminated and form the total savings potential of the labour costs associated with the LFE package assembly.
Assumptions material costs
The rejects are disassembled and materials that still seem useable will get cleaned and eventually find their way back into production again. However it is policy to always scrap the top and bottom couple of LFEs, so there is always some scrap. Since it is not known how much of the materials get scrapped, the scrap cost will be calculated for a variety of percentages. The number of rejects are determined by using the found reject rate of 4% and the production output of TGP1.
Material costs (2018)
In Table 2-8 the total material costs incurred by the production of LFE packages in the TGP1 production department are shown. The total material costs are based on the production output of TGP1 and the material cost per package type as found in the company’s ERP system. The estimated scrap costs are included and shown separate from the total material costs in Table 2-9.
Type Material cost excluding scrap Material cost including 5% scrap Material cost including 10% scrap Material cost including 15% scrap Material cost including 20% scrap Material cost including 25% scrap Material cost including 50% scrap
020 €5,314.32 €5,324.98 €5,335.63 €5,346.29 €5,356.94 €5,367.60 €5,420.87
050 €6,528.63 €6,541.72 €6,554.81 €6,567.90 €6,580.99 €6,594.08 €6,659.53
100 €10,285.35 €10,305.97 €10,326.59 €10,347.22 €10,367.84 €10,388.46 €10,491.57