Original citation:
ATLAS Collaboration (Including: Farrington, Sinead and Jones, G. (Graham)). (2013) Search for high-mass resonances decaying to dilepton final states in pp collisions at s√=7 TeV with the ATLAS detector. Journal of High Energy Physics, Volume 2012 (Number 11). Article Number 138.
Permanent WRAP url:
http://wrap.warwick.ac.uk/59730
Copyright and reuse:
The Warwick Research Archive Portal (WRAP) makes this work of researchers of the University of Warwick available open access under the following conditions.
This article is made available under the Creative Commons Attribution- 3.0 Unported (CC BY 3.0) license and may be reused according to the conditions of the license. For more details seehttp://creativecommons.org/licenses/by/3.0/
A note on versions:
The version presented in WRAP is the published version, or, version of record, and may be cited as it appears here.
JHEP11(2012)138
Published for SISSA by SpringerReceived: September 12, 2012 Revised: October 23, 2012 Accepted: October 29, 2012 Published: November 23, 2012
Search for high-mass resonances decaying to dilepton
final states in
pp
collisions at
√
s
= 7
TeV with the
ATLAS detector
The ATLAS collaboration
E-mail: atlas.publications@cern.ch
Abstract:The ATLAS detector at the Large Hadron Collider is used to search for high-mass resonances decaying to an electron-positron pair or a muon-antimuon pair. The search is sensitive to heavy neutral Z′ gauge bosons, Randall-Sundrum gravitons, Z∗ bosons, techni-mesons, Kaluza-KleinZ/γbosons, and bosons predicted by Torsion models. Results are presented based on an analysis of pp collisions at a center-of-mass energy of 7 TeV corresponding to an integrated luminosity of 4.9 fb−1 in the e+e− channel and 5.0 fb−1 in the µ+µ−channel. A Z′ boson with Standard Model-like couplings is excluded at 95% confidence level for masses below 2.22 TeV. A Randall-Sundrum graviton with coupling
k/MPl= 0.1 is excluded at 95% confidence level for masses below 2.16 TeV. Limits on the other models are also presented, including Technicolor and Minimal Z′ Models.
JHEP11(2012)138
Contents
1 Introduction 1
2 ATLAS detector 3
3 Lepton reconstruction 4
4 Event selection 4
5 Simulated samples 6
6 Expected signals and backgrounds 6
7 Systematic uncertainties 8
8 Data-SM expectation comparison 10
9 Limit-setting procedure 12
10 Limits on spin-1 SSM and E6 Z′ bosons 13
11 Limits on spin-1 Z∗ bosons 15
12 Limits on spin-2 Randall-Sundrum gravitons 15
13 Limits on Torsion models 16
14 Limits on Technicolor 17
15 Limits on spin-1 Kaluza-Klein S1
/Z2 bosons 21
16 Limits on Minimal Z′ bosons 22
17 Conclusions 23
The ATLAS collaboration 30
1 Introduction
Searches for new resonances decaying to a dilepton final state have had a long and successful history. These channels contributed to the discovery of the quarkonium resonances J/ψ
JHEP11(2012)138
reconstructable final state with small, well-understood backgrounds. In this article, data collected by the ATLAS experiment at the LHC are used to search for new resonances decaying into dielectron and dimuon final states.
The Sequential Standard Model (SSM) [1] defines the Z′
SSMcouplings to SM fermions to be the same as the SM Z boson couplings and is often used in the literature as a benchmark model. A number of models predict additional neutral vector gauge bosons. One class postulates larger symmetry groups in which the SM gauge group is embedded. This is usually motivated by gauge unification or restoration of left-right symmetry, which is violated by the weak interaction. In one scheme, the SM gauge group derives from theE6 group which, upon symmetry-breaking via the SU(5) subgroup, results in two additional U(1) gauge groups named U(1)χ and U(1)ψ with associated gauge bosonsZχ′ and Zψ′ that
can mix [1,2]. In the Minimal Z′ Models [3,4], the phenomenology is controlled by only two effective coupling constants in addition to the Z′ boson mass. This parameterization encompasses many models, including a left-right symmetric model [5,6] and the pure (B–L) model [7], where B (L) is the baryon (lepton) number, and B–L is the conserved quantum number.
A second set of models is motivated by various solutions to the hierarchy problem of the SM relating the very different scales of electroweak symmetry breaking and the gravitational Planck scale (MPl). One class of such models introduces a new doublet of vector bosons (Z∗, W∗) [8] with masses not far from the weak scale [9], which couple to SM fermions only via magnetic-type interactions. Compared to Z′ bosons, interactions mediated by Z∗ bosons are additionally suppressed in low-energy processes by powers of the small momentum transfer. Thus, the search for the Z∗ boson is well-motivated at the LHC.
An alternative solution to the hierarchy problem has been proposed in models that allow the gravitational force to propagate into extra spatial dimensions. Among them, the Randall-Sundrum (RS) model [10] predicts a warped space-time metric in one extra dimen-sion. Due to warping, the apparent strength of gravity in the four-dimensional subspace populated by the SM particles is exponentially suppressed. The RS model predicts excited states of the graviton,G∗, whose couplings to the SM particles are not exponentially sup-pressed. The graviton is a spin-2 boson that can decay into dilepton final states with a coupling strength of k/MPl, where k is a scale that defines the warp factor of the extra dimension, and MPl =MPl/
√
8π.
In Kaluza-Klein TeV−1 models [11–13], the extra-dimensional momentum is quantized by the inverse of the size of the extra dimension, creating a tower of massive Kaluza-Klein (KK) states corresponding to each SM particle. The Kaluza-Klein towers corresponding to the photon and theZboson,γKKandZKK, would manifest themselves as nearly degenerate resonances decaying to dilepton final states. This work is the first direct search for these Kaluza-Klein states. Previous bounds on the Kaluza-Klein boson mass were obtained from indirect measurements [14,15].
res-JHEP11(2012)138
onances with masses of a few hundred GeV that can decay into fermion-antifermion pairs. Two main Technicolor models have a well-developed phenomenology at LHC energies. In Low-scale Technicolor (LSTC) [19,20], the coupling constant varies slowly (walks) due to the existence of many scales of strong interactions while the phenomenology is dictated by the lowest mass particles. Minimal Walking Technicolor (MWT) [21–23] is a minimal model that is conformal and satisfies electroweak precision measurements.
One of the main limitations of the Standard Model is its inability to incorporate gravity. To address this problem, a consistent quantum theory of all four fundamental forces should be developed to seamlessly unify the SM and General Relativity (GR). However, so far no generally accepted formulation of quantum gravity exists, and therefore it is common to apply a phenomenological approach to the problem by considering extensions of GR and assuming that they might arise from a more fundamental theory, such as String Theory. Among such extensions is gravity with Torsion [24]. In Torsion models, the spin of the elementary particles is the source of an extra field called Torsion, which interacts with SM fermions [25, 26]. This article reports on the first interpretation of a high mass dilepton search in terms of a Torsion resonance.
Previous searches have set direct and indirect constraints on the mass of new heavy resonances [27, 28]. The Tevatron data [29,30] have excluded a Z′
SSM boson with a mass lower than 1.071 TeV [30]. Recent measurements from the LHC experiments [31, 32], based on up to 5 fb−1 of data, have excluded a Z′
SSM boson with a mass lower than 2.33 TeV [32]. Indirect constraints from LEP [33–36] have excluded Z′
SSM bosons with mass less than 1.787 TeV [28]. Constraints on the mass of the RS graviton have been set by the ATLAS [37], CMS [32], CDF [38] and D0 [39] collaborations, excluding RS gravitons with a mass less than 2.14 TeV fork/MPl = 0.1 [32]. A Z∗ with mass less than 1.152 TeV has been excluded by ATLAS [40]. A search for the techni-mesonsρT andωT in the dilepton final state has been conducted by CDF, resulting in a lower bound on the ρT and ωT masses of 280 GeV [41]. The constraints from electroweak precision measurements give a lower limit on theZKK/γKK boson masses around 4 TeV [14,42].
The results reported in this article use the full data sample recorded by ATLAS in 2011, corresponding to a total integrated luminosity of 4.9 (5.0) fb−1 in thee+e− (µ+µ−) channel.
2 ATLAS detector
The ATLAS detector [43] consists of an inner tracking detector surrounded by a 2 T super-conducting solenoid, electromagnetic and hadronic calorimeters, and a muon spectrometer. Charged particle tracks in the pseudorapidity1 range |η|<2.5 are reconstructed with the
inner detector, which consists of silicon pixel, silicon strip, and transition radiation detec-tors. The superconducting solenoid is surrounded by a hermetic calorimeter that covers
1ATLAS uses a right-handed coordinate system with thez-axis along the beam pipe. Thex-axis points
JHEP11(2012)138
|η|<4.9. For |η|<2.5, the electromagnetic calorimeter is finely segmented and plays an important role in electron identification. Outside the calorimeter, air-core toroids provide the magnetic field for the muon spectrometer. Three stations of precision drift tubes (with cathode strip chambers for the innermost station for |η|>2.0) provide an accurate mea-surement of the muon track curvature in the range|η|<2.7. Resistive-plate and thin-gap chambers provide muon triggering capability in the range |η|<2.4.
3 Lepton reconstruction
Electron candidates are formed from clusters of cells reconstructed in the electromagnetic calorimeter that are associated with a charged particle track in the inner detector. Mea-surements of the transverse calorimeter shower shape and the longitudinal leakage into the hadronic compartment [44] are also used to improve electron-hadron identification.
The energy of an electron is obtained from the calorimeter, and its direction from the associated track. At large transverse energy (ET), the calorimeter energy resolution is dominated by a constant term which is measured in data to be 1.2% in the barrel (|η|<1.37) and 1.8% in the endcaps (1.52<|η| ≤2.47) [44]. For dielectron masses above 200 GeV, the mass resolution is below 2% over the entire η range.
Muon tracks are first reconstructed separately in the inner detector (ID) and in the muon spectrometer (MS). The two tracks are then matched and a combined fit is performed to the inner detector and muon spectrometer hits, taking into account the effect of multiple scattering and energy loss in the calorimeters.
The muons used in this work have hits in either three or two (out of three) stations of the muon spectrometer. Muons with hits in three stations, referred to as tight muons, comprise about 95% of the sample, and have transverse momentum (pT) resolution at 1 TeV ranging from 10% to 25%. Muons with hits in two stations, referred to as loose muons, have slightly worse pT resolution than the tight muons. Loose muons are accepted only in the barrel region of the muon spectrometer (|η| < 1.05), excluding small geometrical regions where the detector alignment is known to be less precise.
4 Event selection
The data used for this study are required to have been recorded during periods of stable LHC beams, and when all relevant systems of the detector were operating normally. Col-lision candidates are selected by requiring a primary vertex with at least three associated charged particle tracks, each with pT more than 0.4 GeV.
JHEP11(2012)138
the event to pass the event selection described below. Since the trigger signals are satu-rated for electromagnetic clusters with very high energies, the trigger-level bunch-crossing identification, which uses the pulse shape, is challenging and performed by a dedicated algorithm, implemented in the first-level calorimeter trigger hardware.
Dielectron events are selected by requiring two electron candidates with the medium
level of identification defined in ref. [44], with transverse energyET larger than 25 GeV and
|η| ≤2.47; the transition region between the barrel and endcap calorimeters is excluded. A hit in the first layer of the pixel detector is required if an active pixel module is traversed, to suppress background from photon conversions. To suppress background from QCD multijet production, the electron with the higher ET must be isolated, requiring ΣET(∆R < 0.2) less than 7 GeV, where ∆R = p
(∆η)2+ (∆φ)2 and ΣE
T(∆R < 0.2) is the sum of the transverse energies in calorimeter cells around the electron direction in a cone of ∆R
smaller than 0.2. The sum excludes the core of the electron energy deposition and is corrected for transverse shower leakage and pile-up from additional pp collisions. The two highest ET electrons passing the above selection criteria are used to reconstruct the dielectron candidate. The curvature measured by the inner detector for the high-energy electrons relevant to this analysis is not large enough to allow a precise determination of the transverse momentum and charge of the electrons. To avoid losses in efficiency, the two electron candidates are not required to have opposite charge. For the selection criteria described above and dielectron invariant masses (mee) greater than 130 GeV, the overall
event acceptance times efficiency (Aǫ) for a Z′ boson of mass 2 TeV is about 66%.
In theµ+µ−channel, events were triggered by at least one of two single-muon triggers, one with a pT threshold of 22 GeV as reconstructed from the combination of ID and MS information, and the second with apT threshold of 40 GeV as reconstructed by the MS in the barrel region only. The typical single-muon trigger efficiency was measured in data to be 85% in the barrel (considering the union of both trigger paths) and 86% in the endcaps. The trigger efficiency is lower for muons than it is for electrons because of the smaller geometrical acceptance of the muon trigger detectors.
JHEP11(2012)138
Dimuon event candidates with two tight muons are considered first (tight dimuon selection). If more than one such pair is found in an event, the one with the highest scalar sum of the leptons’ pT is selected. If no tight muon pair is found, pairs with one tight muon and one loose muon (loose dimuon selection) are considered. Similarly, if more than one loose muon pair is found in an event, the one with the highest P
|pT| is selected. For the selection criteria described above, the overall event Aǫ for a Z′ boson of mass 2 TeV decaying into a dimuon final state is 43%, including 4% from the loose dimuon selection. The lower acceptance compared to the dielectron channel is due to the stringent hit requirements in the muon spectrometer.
For both channels, the dominant and irreducible background is due to theZ/γ∗ (Drell-Yan) process, characterized by the same final state as the signal. Small contributions from t¯t and diboson (W W, W Z and ZZ) production are also present in both channels. Semi-leptonic decays of b and c quarks in the e+e− and µ+µ− samples, plus a mixture of photon conversions and hadrons faking electrons in the e+e− sample, are backgrounds that are referred to below as QCD background. Events with jets accompanyingW bosons (W + jets) may similarly produce dilepton candidates.
The expected signal and backgrounds, with the exception of the ones from QCD and
W+jets, are evaluated with simulated samples and rescaled using the most precise available cross-section predictions, as explained in more detail in section6. The total SM prediction is then normalized to the data in an invariant mass interval around the Z peak (70– 110 GeV). In the dielectron channel, the rescaling is done after adding the QCD multijet and W + jets backgrounds evaluated directly from data, as described in section6.
5 Simulated samples
The Z′, G∗, and LSTC signals, as well as the Z/γ∗ process, are generated with Pythia 6.421 [46] using MRST2007 LO** [47, 48] parton distribution functions (PDFs). The Minimal Z′ and Z
KK/γKK signals are obtained by reweighting the large sample of Z/γ∗ events fromPythiawith the appropriate ratio of differential cross sections [3,49]. Z∗ and Torsion signals are generated with CompHEP [50], while MadGraph [51] is used for MWT signals; CTEQ6L1 [52] PDFs are used in both cases.
The diboson processes are generated with Herwig 6.510 [53] using MRST2007 LO** PDFs. Thet¯tbackground is generated with MC@NLO 4.01 [54] using CTEQ66 [55] PDFs. For t¯t events, Jimmy 4.31 [56] is used to describe multiple parton interactions and Her-wig to describe the remaining underlying event and parton showers. Final-state photon radiation is handled by photos [57]. The generated samples are processed through a full ATLAS detector simulation [58] based on GEANT4 [59].
6 Expected signals and backgrounds
JHEP11(2012)138
which is then applied to the results of the leading-order simulation. The same QCD K-factor is applied to the Z′, ZKK/γKK, Torsion, and LSTC signals. Its value is 0.91 at 2 TeV and slowly increases up to 1.15 at 250 GeV. A different K-factor is applied to the
G∗ signal, with values that vary between 1.6 and 1.8 depending on the graviton mass and
k/MPl [62],2 and with a value of 1.75 above 750 GeV, consistent with ref. [37]. Finally, no QCD K-factor is applied to the leading-order Z∗ cross section since theZ∗ model uses an effective Lagrangian with a different Lorentz structure.
The Z′
SSM, Z′(E6), Torsion states, and techni-mesons interfere minimally with the
Z/γ∗ process, and the Z∗ and G∗ do not interfere at all. The effect of interference on the resonance line-shape is therefore neglected for all these states. On the other hand, the interference of theZKK/γKK boson with Z/γ∗ is very strong and cannot be neglected [13, 42]. The interference effect is also taken into account in the MinimalZ′ Models framework. Higher-order electroweak corrections (beyond the photon radiation included in the sim-ulation) are calculated usingHorace[63,64], yielding an electroweak K-factor (KEW) due to virtual heavy gauge boson loops. Its value at 2 TeV is 0.92 in the dielectron channel and 0.93 in the dimuon channel, and slowly increases up to 1.05 at 250 GeV. The electroweak K-factor is applied only to theZ/γ∗ background and not to the expected signals, with the exception of Technicolor and Kaluza-Klein states. In the case of Technicolor, KEW is ap-plied because production proceeds via theZ/γ∗process. Since interference is an important feature of the Kaluza-Klein boson model, the electroweak K-factor is applied to the full am-plitude (M) of the process, including theZKK/γKKamplitude:
MZ/γ∗+MZKK/γKK 2
−→
KEW×
MZ/γ∗+MZ
KK/γKK
2
. This approximation is conservative. Although interference is taken into account for MinimalZ′bosons, for consistency with the treatment of the other Z′ models the electroweak K-factor is applied only to the pureZ/γ∗ part of the amplitude:
MZ/γ∗+MZ′ 2
−→
MZ/γ∗+MZ′ 2
+ (KEW−1)× MZ/γ∗
2
.
For the other backgrounds, the diboson cross sections are calculated to next-to-leading order (NLO) usingmcfm[65] with an uncertainty of 5%, and thet¯tcross section is predicted at approximate-NNLO, with an uncertainty of +7.0/−9.6% [66,67].
At very high masses, the statistical significance of the diboson andtt¯simulated samples becomes insufficient. Therefore their invariant mass distribution is fitted to the functional form y(x) = p1 ·xp2+p3logx which is then used to extrapolate the t¯t background above 0.8 TeV and the diboson background above 1.5 TeV.
The QCD multijet and W + jets backgrounds in thee+e− sample are estimated pri-marily from data using several techniques.
First, a “reversed electron identification” technique [40] is used, in which only the QCD multijet background is estimated from data, while the W + jets component comes from the Monte Carlo simulation. Events with both electron candidates failing one of the medium identification criteria are used to determine the shape of the QCD multijet backgroundmee distribution. The chosen criterion, the difference in η between the cluster
and the track, does not affect kinematic distributions. The small contamination from non-QCD processes, located mainly beneath the Z peak, is subtracted using MC samples of
JHEP11(2012)138
the other backgrounds (Z/γ∗,t¯t, diboson andW + jets). The shape of these backgrounds is obtained by summing their contributions according to the most precise available cross-section predictions. The mass distributions of the QCD and non-QCD backgrounds are fitted for their relative contributions in the 70 GeV < mee < 200 GeV range. The QCD
multijet background shape is fitted in the 110–800 GeV range using the functional form
y(x) = p1·xp2+p3logx and is extrapolated beyond 800 GeV. The systematic uncertainty includes the uncertainty from the relative normalization procedure, namely the QCD mul-tijet fraction from the first fit, the uncertainty from the choice of the reversed selection and the uncertainty from the range of the second fit.
A second independent data-driven method is used to obtain an estimate of the QCD multijet andW+ jets backgrounds together. It uses fake rates computed from jet-enriched samples, obtained from jet triggers or from the signal trigger. The fake factors are defined as the probability for a jet to pass the “tight” (T) selection, that is all selection criteria, if it passes the “loose” (L) selection, that is the same reverse identification selection as in the reverse electron identification method. The fake factors depend only slightly on transverse momentum and more importantly on pseudorapidity. Since isolation is applied only to the leading electron, two different fake factors are needed: flead, applied to the leading electron, and fsubl, applied to the subleading electron. The QCD multijet andℓ+jets backgrounds are estimated by selecting events with candidate pairs having each electron identified either as “tight” or “loose”. The final estimate is then
Nℓ+jets & QCD=fsublNTL+fleadNLT−fleadfsublNLL.
The same functional form as before is finally used to fit this estimate between 140 GeV and 850 GeV and extrapolate it above this energy range. The systematic uncertainty includes the uncertainty from theη or pT dependence of the fake factors and the uncertainty from the range of the fit.
All methods yield consistent results and the final estimate is given by the mean of the central values. The uncertainty, conservatively assigned to be the maximum of the largest of up and down deviations of each method, is 33% at mee= 200 GeV and grows to about
110% at 2 TeV.
In the dimuon channel, the QCD multijet background is estimated in data from a sam-ple of non-isolated dimuon events. TheW + jets background is evaluated using simulated samples. Both backgrounds are found to be negligible in the dimuon channel after the isolation selection is applied.
7 Systematic uncertainties
JHEP11(2012)138
The mass-dependent systematic uncertainties include theoretical effects due to the PDFs, QCD and electroweak corrections, as well as experimental effects, namely efficiency and resolution. These uncertainties are correlated across all bins in the search region. In addition, there is an uncertainty on the QCD and W + jets backgrounds affecting the dielectron channel. The theoretical uncertainties are applied to the background expectation only. The experimental uncertainties are assumed to be correlated between signal and all types of backgrounds. All systematic uncertainties quoted below refer to narrow resonances with dilepton masses of 2 TeV. All systematic uncertainties estimated to have an impact
≤3% on the expected number of events are neglected.
The combined uncertainty on the PDFs, strong couplingαS, and renormalization/facto-rization scale variations is 20%, the largest contribution being the uncertainty on the PDFs. TheαSand PDF uncertainties are evaluated using the MSTW2008NNLO eigenvector PDF sets and the PDF sets corresponding to variations ofαS, at the 90% confidence level (CL). The spread of the variations covers the difference between the central values obtained with the CTEQ and MSTW PDF sets. The scale uncertainties are estimated by varying the renormalization (µR) and factorization (µF) scales independently up and down by a factor of two, but with the constraint 0.5 ≤ µF/µR ≤ 2 to avoid large logarithmic corrections. The resulting maximum variations are taken as the uncertainties. In addition, a systematic uncertainty of 4.5% is attributed to electroweak corrections [40] for both channels. This contribution includes the difference in the electroweak scheme definition between Pythia and Horace, and higher order electroweak andO(ααS) corrections.
In the dielectron channel, the largest experimental systematic uncertainty is due to the estimate of the QCD multijet andW + jets backgrounds, which translates into a system-atic uncertainty on the total background of 26% at 2 TeV. Other experimental systemsystem-atic uncertainties in the dielectron channel include uncertainties due to the extrapolation of the
t¯tand diboson backgrounds, which are significant only above 2 TeV and uncertainties due to the electron reconstruction and identification efficiency at highET, which are estimated to be less than 3% for electron pairs. The uncertainties on the calorimeter energy cali-bration are estimated to be between 0.5% and 1.5%, depending on transverse energy and pseudorapidity and have a negligible effect on the event yield as do the uncertainties on the corrections applied to the simulation to reproduce the calorimeter resolution at high energy.
JHEP11(2012)138
Source Dielectrons Dimuons
Signal Background Signal Background
Normalization 5% NA 5% NA
PDF/αs /scale NA 20% NA 20%
Electroweak corrections NA 4.5% NA 4.5%
Efficiency - - 6% 6%
W+ jets and QCD background NA 26% NA
[image:12.595.113.481.85.193.2]-Total 5% 34% 8% 21%
Table 1. Summary of systematic uncertainties on the expected numbers of events atmℓℓ= 2 TeV.
NA indicates that the uncertainty is not applicable, and “-” denotes a negligible entry.
A summary of all systematic uncertainties common to all final states investigated in this search is shown in table 1. Additional systematic uncertainties that apply to strongly interfering states (such asZKK/γKK) are discussed later.
8 Data-SM expectation comparison
Figure 1 shows the invariant mass (mℓℓ) distribution for the dielectron (top) and dimuon
(bottom) final states after final selection. The bin width of the histograms is constant in logmℓℓ, chosen such that a possible signal peak spans multiple bins and the templates are
smooth. Figure1also displays the expectedZ′
SSMsignal for two mass hypotheses. Tables2 and 3 show the number of data events and the estimated backgrounds in bins of recon-structed dielectron and dimuon invariant mass above 110 GeV. The number of observed events in the normalization region, from 70 to 110 GeV, is 1,236,646 in the dielectron chan-nel and 985,180 in the dimuon chanchan-nel. The dilepton invariant mass distributions are well described by the Standard Model.
The data are compared to the Monte Carlo simulation in the search region 0.13 TeV< mℓℓ < 3.0 TeV. The agreement is first studied by computing the significance of the
dif-ference in each mass bin, with statistical and systematic uncertainties taken into account. The largest positive local significance is about 2σ in the dielectron channel and about 1σ
in the dimuon channel, and the largest negative local significance is−2σ in both channels. The comparison is then performed by means of templates [40, 68]. The templates provide the expected yield of events (¯n) in eachmℓℓ bin. When neglecting interference, ¯n
is given by ¯n=nX(λ, ννν) +nZ/γ∗(ννν) +nobg(ννν), where nX represent the number of events
produced by the decay of a new resonance X (X =Z′, Z∗, G∗,TS, ρT/ωT,R1/R2, where ρT/ωT and R1/R2 are techni-mesons, see below); nZ/γ∗ and nobg are the number of Z/γ∗ (Drell-Yan) and other backgrounds events, respectively. The symbol λrepresents the pa-rameter of interest of the model, andννν is the set of Gaussian-distributed nuisance parame-ters incorporating the systematic uncertainties. When including the effects of interference, ¯
n = nX+Z/γ∗(λ, ννν) +nobg(ννν), where nX+Z/γ∗ is the number of signal plus Z/γ∗ events
JHEP11(2012)138
[GeV] ee m 80100 200 300 1000 2000
Events -3 10 -2 10 -1 10 1 10 2 10 3 10 4 10 5 10 6 10 7 10 ATLAS -1 L dt = 4.9 fb
∫
= 7 TeV s Data 2011 * γ Z/ Diboson tt
QCD & W+jets Z’(1500 GeV) Z’(2000 GeV) [GeV] µ µ m
80100 200 300 1000 2000
Events -3 10 -2 10 -1 10 1 10 2 10 3 10 4 10 5 10 6 10 7 10 Data 2011 * γ Z/ Diboson tt Z’(1500 GeV) Z’(2000 GeV) ATLAS -1 L dt = 5.0 fb
∫
[image:13.595.138.454.90.575.2]= 7 TeV s
Figure 1. Dielectron (top) and dimuon (bottom) invariant mass (mℓℓ) distributions after final
selection, compared with the stacked sum of all expected backgrounds, with two example Z′ SSM
signals overlaid. The bin width is constant in logmℓℓ.
JHEP11(2012)138
mee[GeV] 110–200 200–400 400–800 800–1200 1200–3000Z/γ∗ 26700±1100 2960±120 265±13 12.1±0.9 1.47±0.18
t¯t 1300±120 410±40 26.5±2.8 0.41±0.17 0.034±0.034 Diboson 415±21 146±8 16.2±0.9 0.88±0.05 0.101±0.011 QCD andW + jets 1900±600 510±200 50±31 2.0±1.8 0.26±0.31 Total 30300±1300 4030±240 357±34 15.4±2.0 1.86±0.35
[image:14.595.92.504.83.180.2]Data 29816 4026 358 17 3
Table 2. Expected and observed number of events in the dielectron channel. The errors quoted include both statistical and systematic uncertainties.
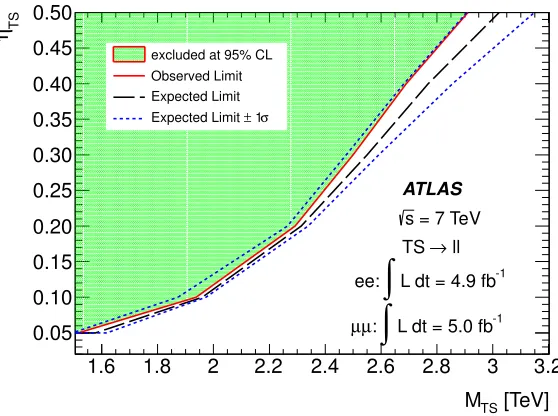
mµµ [GeV] 110–200 200–400 400–800 800–1200 1200–3000 Z/γ∗ 21200±1200 2090±230 173±15 7.7±0.8 0.98±0.16
t¯t 900±100 270±50 18±11 0.32±0.07 0.019±0.007 Diboson 289±32 97±24 11.8±2.7 0.59±0.26 0.087±0.016 Total 22400±1200 2460±240 203±19 8.7±0.9 1.09±0.16
Data 21945 2294 197 10 2
Table 3. Expected and observed number of events in the dimuon channel. The errors quoted include both statistical and systematic uncertainties.
bins in the search region, using a Z′
SSM template. Explicitly:
LLR =−2 ln L(data |nˆZ′,MˆZ′,νννˆ)
L(data |(ˆnZ′ = 0),νννˆˆ)
where ˆnZ′, ˆMZ′, ˆννν and ˆνννˆ are respectively the best-fit values for the Z′ normalization,
Z′ mass and nuisance parameters, which maximize the likelihood Lgiven the data, assum-ing in the numerator that a Z′ signal is present and in the denominator that no signal is present. The LLR is scanned as a function of Z′ cross section and M
Z′ over the full
considered mass range. The observed p-value for the dielectron and dimuon samples is 36% and 68%, respectively. For the combination of both channels, the observed p-value is 40%.
9 Limit-setting procedure
In the absence of a signal, upper limits on the number of events produced by the decay of a new resonance are determined at the 95% Confidence Level (CL).
[image:14.595.110.489.223.305.2]JHEP11(2012)138
Model Z′
ψ ZN′ Zη′ ZI′ ZS′ Zχ′
sinθE6 0 −1/4
p
3/8 p
5/8 3√6/8 1
cosθE6 1
√
[image:15.595.160.436.83.140.2]15/4 p5/8 −p3/8 −√10/8 0
Table 4. Mixing angle values for theE6 models considered.
The same Bayesian approach [69] is used in all cases, with a flat prior probability distribution for the signal cross section times branching fraction (σB), when neglecting interference. When including the effects of interference, the prior is flat for the coupling strength to the second or to the fourth power. The most likely number of signal events, and the corresponding confidence intervals, are determined from a likelihood function defined as the product of the Poisson probabilities over all mass bins in the search region, using the appropriate signal templates. The nuisance parameters are integrated out.
Most of the dilepton resonances searched for in this analysis are narrow compared to the detector resolution. The effect of width variations on the resonance line-shape is neglected for the E6 analysis. On the other hand, the dependence of the width on the coupling strength is taken into account in the MWT, Torsion and G∗ analyses by using several templates for a given pole mass in which various values of the couplings are selected. Signal templates include the acceptance times efficiency of the signal, at a given pole mass
MX, over the full search region. The productAǫis different for each model due to different
angular distributions, boosts, and line-shapes.
The expected exclusion limits are determined using simulated pseudo-experiments with only Standard Model processes by evaluating the 95% CL upper limits for each pseudo-experiment for each fixed value of the resonance pole massMX. The median of the
distri-bution of limits is chosen to represent the expected limit. The ensemble of limits is also used to find the 68% and 95% envelopes of the expected limits as a function of MX.
The combination of the dielectron and dimuon channels is performed under the as-sumption of lepton universality by defining the likelihood function in terms of the total number of signal events produced in both channels. For each source of uncertainty, the correlations across bins, as well as the correlations between signal and background, are taken into account.
10 Limits on spin-1 SSM and E6 Z′ bosons
Due to mixing between the U(1)χ and U(1)ψ groups, in the E6 models the lightest new boson is a linear combination of theZ′
χandZψ′ bosons depending on the mixing angleθE6.
For six specific values of this mixing angle, the diboson resonance is namedZ′
ψ,ZN′ ,Zη′,ZI′,
Z′
S, andZχ′. The corresponding mixing angle values are displayed in table4. Like the SSM,
these models prescribe the couplings of the Z′ boson to the SM fermions. The expected intrinsic width of the Z′ boson in the E
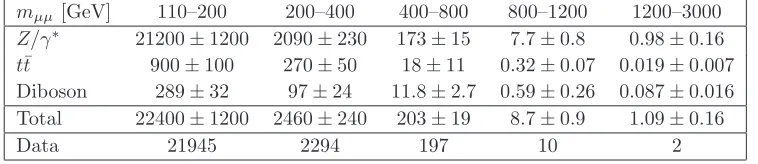
6 models is predicted to be between 0.5% and 1.3% [70,71] of its mass, while in the SSM the intrinsic width is predicted to be about 3%. Figure2shows the 95% CL observed and expected exclusion limits onσB(Z′ →e+e−) and σB(Z′ → µ+µ−) obtained with Z′
JHEP11(2012)138
[TeV]Z’
M 0.5 1 1.5 2 2.5 3
B [pb] σ -4 10 -3 10 -2 10 -1 10
1 Expected limitExpected ± 1σ σ 2 ± Expected Observed limit SSM Z’ χ Z’ ψ Z’ ATLAS ee → Z’
= 7 TeV s
-1
L dt = 4.9 fb
∫
ee:
[TeV]
Z’
M 0.5 1 1.5 2 2.5 3
B [pb] σ -4 10 -3 10 -2 10 -1 10
1 Expected limitExpected ± 1σ σ 2 ± Expected Observed limit SSM Z’ χ Z’ ψ Z’ ATLAS µ µ → Z’
= 7 TeV s
-1
L dt = 5.0 fb
∫
:
[image:16.595.89.502.89.235.2]µ µ
Figure 2. Expected and observed 95% CL limits on σB and expected σB for Z′
SSM production
and the twoE6-motivatedZ′ models with lowest and highestσB for the dielectron (left), and the
dimuon (right) selections. The dashed lines around theZ′
SSMtheory curve represent the theoretical
uncertainty, which is similar for the other theory curves.
[TeV]
Z’
M
0.5 1 1.5 2 2.5 3
B [pb] σ -4 10 -3 10 -2 10 -1 10
1 Expected limitExpected ± 1σ
σ 2 ± Expected Observed limit SSM Z’ χ Z’ ψ Z’ ATLAS ll → Z’ = 7 TeV s
-1 L dt = 5.0 fb
∫
: µ µ
-1 L dt = 4.9 fb
∫
ee:
Figure 3. Expected and observed 95% CL limits onσBand expectedσB forZ′
SSMproduction and
the twoE6-motivatedZ′ models with lowest and highestσB for the combination of the dielectron
and dimuon channels. The dashed lines around the Z′
SSM theory curve represent the theoretical
uncertainty, which is similar for the other theory curves.
section times branching fraction for the Z′
SSM and for the lowest and highest σB of E6 -motivated Z′ models. The combination of the dielectron and dimuon channels is shown in figure3. The rise of theσBlimit at high invariant mass is due mainly to the fast fall of the parton luminosity at high momentum transfer which enhances the low-mass tail, causing a distortion in the resonance peak shape.
The 95% CLσB limit is used to set mass limits for each of the models considered. The limits obtained for theZ′
[image:16.595.170.436.323.521.2]JHEP11(2012)138
Z′
SSM→e+e− ZSSM′ →µ+µ− ZSSM′ →ℓ+ℓ−
Observed limit [TeV] 2.08 1.99 2.22
[image:17.595.126.472.84.131.2]Expected limit [TeV] 2.13 2.00 2.25
Table 5. The observed and expected 95% CL lower limits on the mass of theZ′
SSM boson for the
e+e− andµ+µ− channels separately and for their combination.
Model Z′
ψ ZN′ Zη′ ZI′ ZS′ Zχ′
[image:17.595.145.454.176.223.2]Observed limit [TeV] 1.79 1.79 1.87 1.86 1.91 1.97 Expected limit [TeV] 1.87 1.87 1.92 1.91 1.95 2.00
Table 6. The observed and expected 95% CL lower limits on the masses ofE6-motivatedZ′bosons.
Both lepton channels are combined.
[image:17.595.141.458.268.315.2]Z∗ →e+e− Z∗→µ+µ− Z∗→ℓ+ℓ− Observed limit [TeV] 2.10 1.97 2.20 Expected limit [TeV] 2.13 1.99 2.22
Table 7. The observed and expected 95% CL lower limits on the mass of theZ∗ boson for the
e+e− andµ+µ− channels separately and for their combination.
mass limit for theZ′
SSM is 2.22 (2.25) TeV. The combined mass limits onE6-motivatedZ′ are given in table6.
11 Limits on spin-1 Z∗ bosons
A model with quark-lepton universality is adopted [72, 73] to fix the coupling strength of the Z∗ boson to fermions. The gauge coupling is chosen to be the same as in the SM SU(2) group, and the scale of the new physics is proportional to the mass of the new heavy bosons. The parameters of the model are fixed by requiring that the total and partial decay widths of W∗, the charged partner of Z∗, be the same as those of the W′
SSM boson with the same mass. The width of the Z∗ is then 3.4% of its mass. As a result of the tensor form of the coupling, theZ∗ does not interfere with Z/γ∗, and the angular distribution of its decay to dileptons is different from that of a Z′ boson.
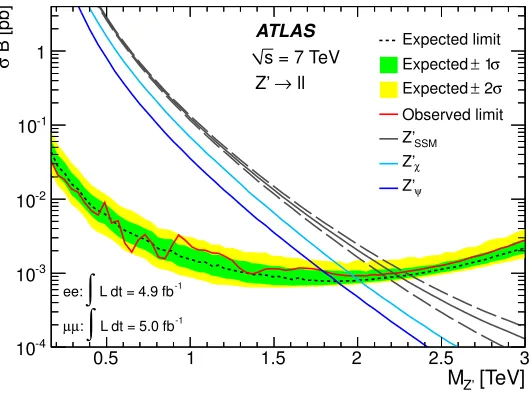
Figure 4 shows the 95% CL observed and expected exclusion limits on σB(Z∗ → ℓ+ℓ−) as well as the cross section times branching fraction expected from theory. The corresponding 95% CL limits on the mass of the Z∗ boson are shown in table 7.
12 Limits on spin-2 Randall-Sundrum gravitons
JHEP11(2012)138
[TeV]
Z*
M
0.5 1 1.5 2 2.5 3
B [pb]
σ
-4
10
-3
10
-2
10
-1
10
1 Expected limit
σ
1
±
Expected
σ
2
±
Expected
Observed limit
Z* ATLAS
ll
→
Z* = 7 TeV s
-1 L dt = 5.0 fb
∫
: µ µ
-1 L dt = 4.9 fb
∫
[image:18.595.170.436.89.287.2]ee:
Figure 4. Expected and observed 95% CL limits onσB and expectedσBforZ∗boson production for the combination of dielectron and dimuon channels. The dashed lines around the Z∗ theory curve represent the theoretical uncertainty.
G∗ →e+e− G∗ →µ+µ− G∗ →ℓ+ℓ− Observed limit [TeV] 2.03 1.92 2.16 Expected limit [TeV] 2.04 1.93 2.17
Table 8. The observed and expected 95% CL lower limits on the mass of theG∗ with a coupling ofk/MPl= 0.1 for thee+e− andµ+µ− channels separately and for their combination.
k/MPl 0.01 0.03 0.05 0.1 0.12 0.14 0.17 0.2 Observed limit [TeV] 0.92 1.49 1.72 2.16 2.23 2.32 2.42 2.51 Expected limit [TeV] 1.02 1.53 1.81 2.17 2.25 2.33 2.44 2.53
Table 9. The observed and expected 95% CL lower limits on the mass of the G∗ with varying couplingk/MPl. Both lepton channels are combined.
of k/MPl between 0.01 and 0.2. The σB limits obtained with k/MPl = 0.1 are used for
k/MPlhypotheses below or equal to 0.1, while those with k/MPl = 0.2 are used fork/MPl hypotheses larger than 0.1 and below or equal to 0.2. Limits at the 95% CL on the graviton mass are derived from this comparison for eachk/MPl hypothesis and are shown in table8 for k/MPl = 0.1, and in table 9 and figure 5 for the combined dilepton channel for all values ofk/MPl.
13 Limits on Torsion models
JHEP11(2012)138
[TeV]
G*
M
1 1.2 1.4 1.6 1.8 2 2.2 2.4 2.6
Pl
M
k/
0 0.02 0.04 0.06 0.08 0.1 0.12 0.14 0.16 0.18 0.2
ATLAS
= 7 TeV s
ll
→
G*
-1 L dt = 4.9 fb
∫
ee:
-1 L dt = 5.0 fb
∫
: µ µ excluded at 95% CL
Observed Limit Expected Limit
[image:19.595.165.435.98.291.2]σ 1 ± Expected Limit
Figure 5. Exclusion regions in the plane ofk/MPl versus graviton mass for the combination of
dielectron and dimuon channels. The region above the curve is excluded at 95% CL.
ηTS 0.05 0.1 0.2 0.3 0.4 0.5
Observed limit [TeV] 1.52 1.94 2.29 2.50 2.69 2.91 Expected limit [TeV] 1.58 1.96 2.31 2.55 2.77 3.02
Table 10. The observed and expected 95% CL lower limits on the mass of Torsion heavy states with varying couplingηTS. Both lepton channels are combined.
assumed to be universal at the Planck scale and remain so at the TeV scale for all fermions except the top quark [25]. Therefore the phenomenology of Torsion decays to dilepton states can be described in terms of two parameters: the TS mass and one coupling (ηTS). Since ηTS can a priori take any value between 0 and 1, the intrinsic width could be very large. The interference effects withZ/γ∗ are negligible.
Limits are computed on σB(TS → ℓ+ℓ−) for five values of η
TS in the range 0.1–0.5. Limits on σB are then translated into limits onMTS in the same way as above for the RS graviton, by comparing them to the theoretical σB as a function of MTS for each value of ηTS. Additionally, theσB limits obtained for ηTS = 0.1 are used to set mass limits for
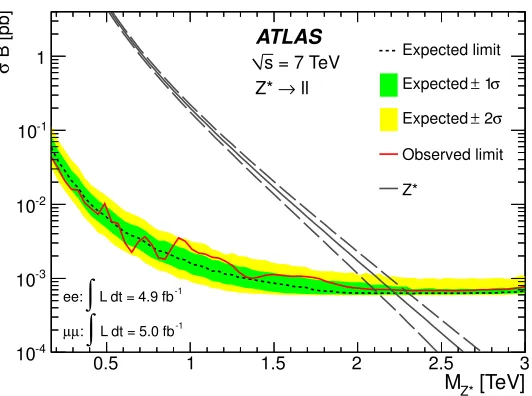
ηTS = 0.05, which is conservative because the TS width is smaller for ηTS = 0.05. The resulting exclusion region in the (MTS, ηTS) plane is displayed in figure 6 and table 10 for the combined dielectron and dimuon channels. The limits on MTS obtained in each channel for ηTS= 0.2 are shown in table 11.
14 Limits on Technicolor
JHEP11(2012)138
[TeV]
TS
M
1.6 1.8 2 2.2 2.4 2.6 2.8 3 3.2
TS
η
0.05 0.10 0.15 0.20 0.25 0.30 0.35 0.40 0.45 0.50
excluded at 95% CL Observed Limit Expected Limit
σ 1 ± Expected Limit
= 7 TeV s
ll
→
TS
ATLAS
-1
L dt = 4.9 fb
∫
ee:
-1
L dt = 5.0 fb
∫
:
[image:20.595.158.437.89.297.2]µ µ
Figure 6. Exclusion regions in the plane of ηTS versus Torsion mass for the combination of
dielectron and dimuon channels. The region above the curve is excluded at 95% CL.
TS→e+e− TS→µ+µ− TS→ℓ+ℓ− Observed limit [TeV] 2.15 2.07 2.29 Expected limit [TeV] 2.20 2.08 2.31
Table 11. The observed and expected 95% CL lower limits on the mass of Torsion heavy states with a coupling ofηTS= 0.2 for thee+e−andµ+µ−channels separately and for their combination.
(πT). Due to techni-isospin symmetry,ρTandωTare nearly degenerate in mass. Therefore this analysis searches for a combination of ρT and ωT, with ωT being the dominant com-ponent since its branching fraction to dileptons is approximately one order of magnitude larger than that of theρT. In this work, the LSTC parameters are chosen to be the same as in ref. [74] (in particular, the LSTC parameter sinχ= 1/3) and the mass of theaTstate is assumed to be 10% higher than that ofρT.
Limits are computed on σB for the decay of the techni-mesons to dilepton final states. When building the signal templates, it is assumed that the mass splitting isMρT−MπT =
MW. Negative interference contributions are neglected. The intrinsic widths of theρT,ωT andaTresonances are much smaller than the experimental resolution. The resulting limits on the ρT/ωT mass are displayed in table 12.
The σB limits are then translated into exclusion regions in the (MρT/ωT, MπT) plane,
shown in figure 7. The notation ρT/ωT indicates the combination of the two resonances. The mass splitting between ρT and πT determines whether decay modes such as ρT →
JHEP11(2012)138
ρT/ωT→e+e− ρT/ωT→µ+µ− ρT/ωT→ℓ+ℓ−
Observed limit [TeV] 0.85 0.70 0.85
[image:21.595.116.481.84.131.2]Expected limit [TeV] 0.85 0.71 0.89
Table 12. The observed and expected 95% CL lower limits on the mass of the ρT/ωT in the
MρT−MπT =MW hypothesis for thee
+e−andµ+µ−channels separately and for their combination.
[GeV] T ω / T ρ M
300 400 500 600 700 800 900
[GeV]πT
M 100 200 300 400 500 600 700 800 900 ATLAS
= 7 TeV s ll → T ω / T ρ -1
L dt = 4.9 fb
∫
ee:
-1
L dt = 5.0 fb
∫
:
µ µ
Dilepton 95% Exclusion Expected Limit σ 1 ± Expected W = M T π - M T ω / T ρ M /3 T ω / T ρ = M T π M T ω / T ρ > M T π Excluded: M
Figure 7. The 95% CL excluded region (in red) in the planeπTmass as a function of theρT/ωT
mass, assuming MaT = 1.1×MρT/ωT, for the combination of dielectron and dimuon channels.
The dotted line corresponds toMρT/ωT−MπT =MW. The black dashed line shows the expected
limit, with the green dashed lines showing the ±1σ bands. The blue hashed region in which MπT > MρT/ωT is excluded by theory. This search is insensitive in the region below the purple
dashed-dotted line (MπT < MρT/ωT/3).
foundational assumption of the LSTC model is that the walking TC gauge coupling causes an enhancement of MπT relative to MρT and the other vector meson masses. This tends
to close off the ρT → πTπT decay channel and, even more strongly, closes off theωT and
aT→3πTchannels [75]. IfMωT >3MπT, theωT →πTπTπTchannel opens up and quickly
becomes the dominant decay mode of ωT. Therefore the dilepton branching fractions become substantially smaller and there is no sensitivity in the MπT < MρT/ωT/3 region in
the dilepton channel.
MWT model. The Minimal Walking Technicolor (MWT) [21–23] model can be charac-terized by the following parameters:
• bare axial and vector masses: MA and MV; • ˜g, the strength of the spin-1 resonance interaction;
• MH, the Higgs boson mass;
• s, the coupling of the Higgs boson to composite spin-1 states;
[image:21.595.154.440.183.394.2]JHEP11(2012)138
˜
g 6 5 4 3 2
[image:22.595.163.432.84.131.2]Observed limit [GeV] 359 485 768 1175 1566 Expected limit [GeV] 352 516 742 1233 1605
Table 13. The observed and expected 95% CL lower limits on the MA parameter with varying
coupling ˜g. Both lepton channels are combined.
[GeV] A M
500 1000 1500 2000 2500
g~
2 3 4 5 6 7 8 9
Dilepton 95% Exclusion Dilepton 95% Expected limit
σ 1 ± Dilepton 95% Expected limit Running regime
EW precision test ATLAS
-1
L dt = 4.9 fb
∫
ee: µµ:
∫
L dt = 5.0 fb-1= 7 TeV s
ll
→ 2
, R
1
R
Figure 8. Bounds in the (MA, ˜g) plane of the MWT parameter space: (i) The electroweak
precision measurements exclude the dark area in the bottom left corner. (ii) The requirement to stay in the walking regime excludes the hatched area in the right corner. (iii) The red area (black dashed line) shows the observed (expected) exclusion at 95% CL in the dilepton channel. The green dashed lines show the±1σbands of the expected exclusion limit.
This model predicts only two resonances, R1 and R2. MR1 is lower than MR2 and
generally very close to MA. In contrast to LSTC, R1 and R2 are neither degenerate nor very narrow. In this work, three free parameters have been set to MH = 200 GeV, s= 0, and S= 0.3, following the recommendation from ref. [78]. The mass of the lightest resonance,MR1, is then scanned in steps of 100 GeV for various values of ˜g. For each choice
of ˜gand MR1, the values ofMR2,MA and MV are uniquely determined.
Limits on σB(R1/R2 → ℓ+ℓ−) are first set as a function of MR1 assuming ˜g =
2,3,4,5,6, where the notation R1/R2 indicates that both resonances are taken into ac-count in the spectrum. They are then translated into a 95% CL exclusion area in the (MA,˜g) plane, as shown in figure 8 and table 13. The limits from the Tevatron, as well
as the theoretical limits, including the requirement to stay in the walking regime, are de-scribed in detail in ref. [77]. Note that the edge of the excluded area varies only very weakly as a function of sandMH, so a Higgs boson mass of ≈125 GeV would not change
[image:22.595.176.417.185.391.2]JHEP11(2012)138
15 Limits on spin-1 Kaluza-Klein S1
/Z2 bosons
The model proposed in ref. [14] assumes a single extra spatial dimension with size of order 1 TeV−1, compactified onto an S1/Z
2 orbifold. In the minimal model considered here, all of the SM fermions are on the same orbifold point. The model is completely specified by a single parameter, the compactification scale, which drives the masses of the KK modes. As for the case ofZ′
SSM, this type of model can be classified as sequential to the Standard Model since the KK couplings are kept SM-like, although enhanced by a factor of √2. However, contrary to any of the Z′ models, the interference with Z/γ∗ is very strong and is a potentially distinctive feature of this type of model [13,80].
Because of the strong destructive interference effects mentioned above, it is not possible to put limits on σB as done for the preceding models. Instead, a coupling strength g is introduced that multiplies the fermion couplings,gλX
f, where Xstands for the new massive
ZKK/γKK resonance, and λf can be the helicity coupling, λf =L,R, as done in ref. [13].
The resulting differential cross section, after thegλX
f −→g×g
X
λf transformation, is
dσ ds ∝
Z/γ∗+ g
X λqg
X λℓ
s−m2
X+iΓXmX
2 −→
Z/γ∗+g2 g
X λqg
X λℓ
s−m2
X +ig2ΓXmX
2 .
Flat priors of g4 and g2 are used in the limit-setting procedure, as opposed to σB used earlier. A flat prior in g4 can be assumed when the pure Z
KK/γKK cross-section term dominates. If the interference term between ZKK/γKK and Z/γ∗ dominates, a flat prior ing2 is better motivated. Two-dimensional templates are produced in order to scan the g parameter in the region 0–2.2 and theZKK/γKKpole masses (MKK) between 130 GeV and 6 TeV.
The strong interference with the Z/γ∗ implies a greater sensitivity to shape distor-tions, especially at the high-end of the mass window, and therefore, two more systematic uncertainties which are found to be negligible in the non-interfering channels have to be taken into account here. First, an uncertainty on the muon momentum resolution, which goes up to 20%–30% above 2.5 TeV. Second, an uncertainty on the extrapolation of the
t¯t and diboson backgrounds, due to the fit function choice and the fit range variation; in the dimuon channel, this uncertainty ranges from 2% to 6% in the 2–3 TeV mass range, relative to the full background. These two uncertainties do not affect the dielectron channel due to a better resolution and to the dominance of the QCD and W + jets background uncertainties over thet¯tand diboson background uncertainties.
The observed and expected limits on g4 and g2 are translated into limits ong, which are shown as a function of MKK in figure 9 for the combination of dielectron and dimuon channels. The fast broadening of the expected one and two-sigma bands above 2 TeV is due to the destructive interference becoming the dominant feature of the signal shape.
JHEP11(2012)138
[TeV]KK
M 0.5 1 1.5 2 2.5 3 3.5 4 4.5 5
g 0 0.2 0.4 0.6 0.8 1 1.2 1.4 1.6 1.8 2 2.2 prior 4 g ll → KK /Z KK γ = 7 TeV s ATLAS
-1
L dt = 4.9 fb
∫
ee:
-1
L dt = 5.0 fb
∫ : µ µ Expected limit σ 1 ± Expected σ 2 ± Expected Observed limit [TeV] KK M
1 2 3 4 5 6
g 0 0.2 0.4 0.6 0.8 1 1.2 1.4 1.6 1.8 2 2.2 prior 2 g ll → KK /Z KK γ = 7 TeV s ATLAS
-1
L dt = 4.9 fb
∫
ee:
-1
L dt = 5.0 fb
[image:24.595.95.501.87.238.2]∫ : µ µ Expected limit σ 1 ± Expected σ 2 ± Expected Observed limit
Figure 9. Expected and observed 95% CL limits ong as a function ofMKK, for the combination
of dielectron and dimuon channels, using a flat prior on g4 (left) and ong2 (right).
ZKK/γKK→e+e− ZKK/γKK→µ+µ− ZKK/γKK→ℓ+ℓ−
g4 prior
Observed limit [TeV] 3.35 3.55 4.16
Expected limit [TeV] 3.11 3.38 4.07
g2 prior
Observed limit [TeV] 4.03 3.93 4.71
Expected limit [TeV] 3.52 3.79 4.53
Table 14. The observed and expected 95% CL lower limits on the mass of the ZKK/γKK (i.e.
g= 1) for thee+e− andµ+µ− channels separately and for their combination.
16 Limits on Minimal Z′ bosons
Limits are also set in the framework of Minimal Z′ Models [3]. In this framework, the coupling of the new boson Z′
Min to fermions is determined by its coupling to the B–L current, gBL, and its coupling to the weak hypercharge Y, gY. It is convenient to refer to the ratios ˜gBL ≡ gBL/gZ and ˜gY ≡ gY/gZ, where gZ is the coupling of the SM Z
boson defined by gZ = 2MZ/v (v = 246 GeV is the Higgs vacuum expectation value in
the SM). γ′ and θ are chosen as independent parameters with the following definitions: ˜
gBL = γ′cosθ, ˜gY = γ′sinθ. The γ′ parameter measures the strength of the ZMin′ boson coupling relative to the SMZ boson coupling, whileθ determines the mixing between the generators of the B–L and the weak hyperchargeY gauge groups. Specific values ofγ′ and θ correspond toZ′ bosons in various models such as the Z′
B−L boson and Z3R′ boson. Signal templates are built which take into account both the interference and the de-pendence of theZ′
Min boson width onγ′ andθ. The coupling to hypothetical right-handed neutrinos and to W boson pairs is neglected. As for the KK model, the two-dimensional signal templates are made by reweighting the simulated Z/γ∗ samples with the ratio of differential cross sectionsδσ(Z′
[image:24.595.89.507.294.399.2]JHEP11(2012)138
γ′ 0.1 0.2
[image:25.595.162.436.83.131.2]Range of observed limits [TeV] 0.67-1.43 1.11-2.10 Range of expected limits [TeV] 0.58-1.47 1.17-2.07
Table 15. Range of the observed and expected 95% CL lower limits on the Z′
Min boson mass for
θ∈[0, π] and representative values of the relative coupling strengthγ′. Both lepton channels are combined.
Z′
Min mass [TeV] 1 2
Range of observed limits 0.08-0.16 0.16-1.10 Range of expected limits 0.07-0.15 0.17-1.01
Table 16. Range of the observed and expected 95% CL upper limits on the relative coupling strength γ′ forθ∈[0, π] and representative values of the Z′
Min boson mass. Both lepton channels
are combined.
of γ′ between 0.01 and 2. The templates at these chosen values of γ′ are interpolated to all values of γ′ by using a smooth interpolating function in each dilepton mass bin. The likelihood fit across all dilepton mass bins finds the most probable value of γ′ for each θ and Z′
Min boson mass MZ′
Min.
Systematic uncertainties are applied as in the case of σB limits. Limits are set on the relative coupling strength γ′ as a function of the Z′
Min boson mass, as shown in figure 10. The two θ values yielding the minimum and maximum cross sections are used to define a band of limits in the (γ′, M
Z′
Min) plane. Table 15 shows the range of the lower limits on
the Z′
Min boson mass for representative values of γ′. The range of the upper limits on γ′ for representative values of the Z′
Min boson mass is shown in table 16.
17 Conclusions
Searches for heavy resonances in the dilepton invariant mass spectrum have been presented. Proton-proton collisions at a center-of-mass energy of 7 TeV with 4.9 fb−1 in the e+e− channel and 5.0 fb−1 in the µ+µ−channel have been used. The observed invariant mass spectra are consistent with the SM expectations. Limits are set on the cross section times branching fractionσB for spin-1 and spin-2 bosons. The resulting mass limits are 2.22 TeV for the Sequential Standard Model Z′ boson, 1.79−1.97 TeV for various E6-motivated Z′ bosons, and 2.16 (0.92) TeV for a Randall-Sundrum graviton G∗ with the coupling parameterk/MPl equal to 0.1 (0.01). TheG∗ boson limits are the most stringent to date. Experimental limits have also been set on Technicolor models, onZ∗, and for the first time, on Kaluza-Klein modes of electroweak bosons, general Minimal Models of Z′ bosons, and Torsion models in quantum gravity.
Acknowledgments
We thank Kenneth Lane for useful discussions on details of the LSTC model.
[image:25.595.175.418.185.232.2]JHEP11(2012)138
[TeV]
Min Z’
M
0.2 0.4 0.6 0.8 1 1.2 1.4 1.6 1.8 2 2.2
’
γ
-1
10
1 Limit range for θ∈ [0, π]
Limit range (expected) )
3R
(Z’
θ
) (expected)
3R
(Z’
θ
)
B-L
(Z’
θ
) (expected)
B-L
(Z’
θ
ATLAS
ll
→
Min
Z’
= 7 TeV s
-1 L dt = 4.9 fb
∫
, ee: -1 L dt = 5.0 fb
∫
[image:26.595.170.439.89.292.2]: µ µ
Figure 10. Expected (hatched area and dotted lines) and observed (filled area and solid lines) upper limits on γ′ within the Minimal Z′ Models parameterization. The limits are shown for different test masses and are obtained by combining the dielectron and dimuon channels. The gray band envelops all limit curves, which depend on the choice ofθ. The lower boundary corresponds to tanθ= 1.43 and the upper boundary to tanθ=−1.19. The limit curves for two representative values ofθare shown: tanθ= 0 and tanθ=−2 which correspond to theZ′
B−L model and theZ3R′
model at specific values ofγ′ respectively.
We acknowledge the support of ANPCyT, Argentina; YerPhI, Armenia; ARC, Aus-tralia; BMWF, Austria; ANAS, Azerbaijan; SSTC, Belarus; CNPq and FAPESP, Brazil; NSERC, NRC and CFI, Canada; CERN; CONICYT, Chile; CAS, MOST and NSFC, China; COLCIENCIAS, Colombia; MSMT CR, MPO CR and VSC CR, Czech Republic; DNRF, DNSRC and Lundbeck Foundation, Denmark; EPLANET and ERC, European Union; IN2P3-CNRS, CEA-DSM/IRFU, France; GNAS, Georgia; BMBF, DFG, HGF, MPG and AvH Foundation, Germany; GSRT, Greece; ISF, MINERVA, GIF, DIP and Benoziyo Center, Israel; INFN, Italy; MEXT and JSPS, Japan; CNRST, Morocco; FOM and NWO, Netherlands; RCN, Norway; MNiSW, Poland; GRICES and FCT, Portugal; MERYS (MECTS), Romania; MES of Russia and ROSATOM, Russian Federation; JINR; MSTD, Serbia; MSSR, Slovakia; ARRS and MVZT, Slovenia; DST/NRF, South Africa; MICINN, Spain; SRC and Wallenberg Foundation, Sweden; SER, SNSF and Cantons of Bern and Geneva, Switzerland; NSC, Taiwan; TAEK, Turkey; STFC, the Royal Society and Leverhulme Trust, United Kingdom; DOE and NSF, United States of America.
JHEP11(2012)138
Open Access. This article is distributed under the terms of the Creative Commons Attribution License which permits any use, distribution and reproduction in any medium, provided the original author(s) and source are credited.
References
[1] P. Langacker,The Physics of Heavy Z′ Gauge Bosons,Rev. Mod. Phys. 81(2009) 1199
[arXiv:0801.1345] [INSPIRE].
[2] D. London and J.L. Rosner,Extra Gauge Bosons inE6,Phys. Rev.D 34(1986) 1530
[INSPIRE].
[3] E. Salvioni, G. Villadoro and F. Zwirner,Minimal Z’ models: Present bounds and early LHC
reach, JHEP 11(2009) 068[arXiv:0909.1320] [INSPIRE].
[4] E. Salvioni, A. Strumia, G. Villadoro and F. Zwirner,Non-universal minimal Z’ models:
present bounds and early LHC reach, JHEP 03 (2010) 010[arXiv:0911.1450] [INSPIRE].
[5] G. Senjanovi´c and R.N. Mohapatra,Exact Left-Right Symmetry and Spontaneous Violation
of Parity,Phys. Rev.D 12(1975) 1502[INSPIRE].
[6] R.N. Mohapatra and J.C. Pati,Left-Right Gauge Symmetry and an Isoconjugate Model of
CP-violation,Phys. Rev.D 11(1975) 566[INSPIRE].
[7] L. Basso, A. Belyaev, S. Moretti and C.H. Shepherd-Themistocleous,Phenomenology of the
minimal B-L extension of the Standard model: Z’ and neutrinos,
Phys. Rev.D 80(2009) 055030 [arXiv:0812.4313] [INSPIRE].
[8] M. Chizhov, V. Bednyakov and J. Budagov,Proposal for chiral bosons search at LHC via
their unique new signature,Phys. Atom. Nucl.71(2008) 2096 [arXiv:0801.4235] [INSPIRE].
[9] M. Chizhov and G. Dvali,Origin and Phenomenology of Weak-Doublet Spin-1 Bosons,
Phys. Lett.B 703(2011) 593[arXiv:0908.0924] [INSPIRE].
[10] L. Randall and R. Sundrum,A Large mass hierarchy from a small extra dimension,
Phys. Rev. Lett.83(1999) 3370[hep-ph/9905221] [INSPIRE].
[11] I. Antoniadis,A Possible new dimension at a few TeV, Phys. Lett.B 246(1990) 377 [INSPIRE].
[12] I. Antoniadis, K. Benakli and M. Quir´os,Direct collider signatures of large extra dimensions,
Phys. Lett.B 460(1999) 176[hep-ph/9905311] [INSPIRE].
[13] G. Bella, E. Etzion, N. Hod, Y. Oz, Y. Silver, et al., A Search for heavy Kaluza-Klein
electroweak gauge bosons at the LHC,JHEP 09(2010) 025[arXiv:1004.2432] [INSPIRE].
[14] T.G. Rizzo,Testing the nature of Kaluza-Klein excitations at future lepton colliders,
Phys. Rev.D 61(2000) 055005 [hep-ph/9909232] [INSPIRE].
[15] Particle Data Groupcollaboration, K. Nakamura et al.,Review of particle physics,
J. Phys.G 37 (2010) 075021[INSPIRE].
[16] S. Weinberg, Implications of Dynamical Symmetry Breaking: An Addendum,
Phys. Rev.D 19(1979) 1277 [INSPIRE].
[17] L. Susskind,Dynamics of Spontaneous Symmetry Breaking in the Weinberg-Salam Theory,
JHEP11(2012)138
[18] K.D. Lane,Technihadron production and decay in low scale technicolor,Phys. Rev.D 60(1999) 075007 [hep-ph/9903369] [INSPIRE].
[19] K. Lane and S. Mrenna,The Collider phenomenology of technihadrons in the technicolor
straw man model,Phys. Rev.D 67(2003) 115011[hep-ph/0210299] [INSPIRE].
[20] E. Eichten and K. Lane,Low-scale technicolor at the Tevatron and LHC,
Phys. Lett.B 669(2008) 235[arXiv:0706.2339] [INSPIRE].
[21] F. Sannino and K. Tuominen,Orientifold theory dynamics and symmetry breaking,
Phys. Rev.D 71(2005) 051901 [hep-ph/0405209] [INSPIRE].
[22] D.D. Dietrich, F. Sannino and K. Tuominen, Light composite Higgs from higher
representations versus electroweak precision measurements: Predictions for CERN LHC,
Phys. Rev.D 72(2005) 055001 [hep-ph/0505059] [INSPIRE].
[23] R. Foadi, M.T. Frandsen, T.A. Ryttov and F. Sannino,Minimal Walking Technicolor: Set
Up for Collider Physics,Phys. Rev.D 76 (2007) 055005[arXiv:0706.1696] [INSPIRE].
[24] I. Shapiro,Physical aspects of the space-time torsion,Phys. Rept.357(2002) 113
[hep-th/0103093] [INSPIRE].
[25] A. Belyaev, I. Shapiro and M. do Vale,Torsion phenomenology at the LHC,
Phys. Rev.D 75(2007) 034014 [hep-ph/0701002] [INSPIRE].
[26] F.M.L. de Almeida Jr., A. Nepomuceno and M. do Vale,Torsion Discovery Potential and Its
Discrimination at CERN LHC, Phys. Rev.D 79(2009) 014029 [arXiv:0811.0291]
[INSPIRE].
[27] C.P. Hays, A.V. Kotwal and O. Stelzer-Chilton,New Techniques in the Search for Z’ Bosons
and Other Neutral Resonances,Mod. Phys. Lett.A 24(2009) 2387[arXiv:0910.1770]
[INSPIRE].
[28] P. Langacker,Z’ Physics at the LHC,arXiv:0911.4294[INSPIRE].
[29] D0collaboration, V.M. Abazov et al., Search for a heavy neutral gauge boson in the
dielectron channel with 5.4 fb−1 of pp¯collisions at√s = 1.96 TeV,
Phys. Lett.B 695(2011) 88 [arXiv:1008.2023] [INSPIRE].
[30] CDFcollaboration, T. Aaltonen et al.,Search for High Mass Resonances Decaying to Muon
Pairs in√s= 1.96TeVpp¯Collisions,Phys. Rev. Lett.106(2011) 121801
[arXiv:1101.4578] [INSPIRE].
[31] ATLAScollaboration, G. Aad et al.,Search for dilepton resonances in ppcollisions at
√
s= 7 TeV with the ATLAS detector,Phys. Rev. Lett.107(2011) 272002
[arXiv:1108.1582] [INSPIRE].
[32] CMScollaboration, S. Chatrchyan et al.,Search for narrow resonances in dilepton mass
spectra in pp collisions at√s = 7 TeV,Phys. Lett.B 714(2012) 158[arXiv:1206.1849]
[INSPIRE].
[33] OPALcollaboration, G. Abbiendi et al.,Tests of the standard model and constraints on new
physics from measurements of fermion pair production at 189-GeV to 209-GeV at LEP,
Eur. Phys. J.C 33(2004) 173[hep-ex/0309053] [INSPIRE].
[34] DELPHIcollaboration, J. Abdallah et al.,Measurement and interpretation of fermion-pair
production at LEP energies above the Z resonance,Eur. Phys. J.C 45(2006) 589