The Uncanny Valley
as a universal
experience
A replication study using multilevel modelling
Robbin Koopman, s1716018 University of Twente
Bachelor thesis
First supervisor: Dr. M. Schmettow Second supervisor: Prof. F. van der Velde
1
Abstract
In the past, it was expected that increasing the human likeness of a robot would increase their likability. Mori (1970/2012) argued this monotonous model is unfit. At some point, as a robot resembles a human too much and its non-human features become more salient, the emotional response to these becomes negative instead. Increasing human likeness further would turn the response positive again. The negative dip is referred to as the ‘Uncanny Valley’ and it is experienced as a feeling of strangeness.
While the UV has been topic of research for years, which cognitive mechanisms underlie the phenomenon are still uncertain. There is an on-going debate on whether individual differences or innate human traits are reason for the experience of the UV. To examine the role of individual differences, the first question to ask should be whether the UV is a universal experience. When results are averaged for every participant, it is still possible that some people do not experience the UV at all. Additionally, it could be examined whether the trough of the UV is at the same position for everyone.
The current study aims at answering these questions by replicating Mathur and Reichling’s (2016) experiment, adding multilevel modelling. By examining the individual results, we can calculate whether the UV is present for every participant and if there are differences in their experiences. Calculations using the MCMC method showed that the probability of a trough appearing for every participant (n=26) exceeded .995. From these results we can conclude that the UV is indeed a universal experience.
2
Table of contents
Abstract ... 1
Introduction ... 3
Methods ... 8
Procedure ... 8
Stimuli ... 8
Measures ... 10
Design ... 10
Materials ... 12
Participants ... 12
Results ... 12
Exploratory Data Analysis ... 12
Regression analysis ... 15
Additional findings ... 18
Discussion ... 19
Individual differences in Uncanny Valley sensitivity ... 21
Perfectionism ... 21
Neuroticism and anxiety ... 22
Human–Robot Uniqueness and Android–Robot Uniqueness ... 24
Personal Distress ... 25
Additional findings... 26
Limitations of the current study ... 27
Conclusion ... 28
References ... 30
Appendix A ... 33
Appendix B ... 34
3
Introduction
The use of robots is becoming more commonplace. Human-like androids are on the rise and are expected to be involved in healthcare (supporting doctors & staff), as well as in social settings, such as accompanying elderly. Especially in social settings, there is interest in making robots appear more human-like. A robot’s appearance could influence the overall acceptance from people, as potential users may infer characteristics of the robot purely based on its physical form (Beer, Prakash, Mitzner, & Rogers, 2011). It is expected that as the human-likeness of a robot increases, their likability and the amount of trust people have in them are expected to rise as well.
However, Mori (1970/2012) suggested this monotonous model between human likeness and emotional response was unfit. At some point, as human likeness increases, the emotional response might instead be negative. Only when human likeness increases further will the emotional response turn positive again. This trough in emotional response is referred to as the ‘Uncanny Valley’ (UV, see figure 1) and it is experienced as a feeling of
[image:4.595.128.470.418.683.2]‘strangeness’ when confronted with any humanoid object (such as a robot or prosthetic) that is not quite human.
Figure 1: The Uncanny Valley as proposed by Mori (1970/2012). The trough is hypothesized to be around 70% human likeness.
4 mechanical vs human likeness, strangeness vs familiarity and eeriness. These faces were morphed from pictures of robots and humans, increasing in their human likeness. When averaging the results across participants, the UV could be discerned. However, when trying to replicate this experiment with videos, no clear trough was discovered. MacDorman (2006) hypothesized that human likeness is therefore not the only possible explanation for the Uncanny Valley. Other factors could influence the UV and, therefore, it is possible to design around it.
Seyema and Nagayama (2007) found similar results; the UV phenomenon shows up, but only when the stimulus has an ‘abnormal feature’. They researched the UV with morphed pictures of robot and doll faces, alternating the sequence of morphing aspects. In some trials, they morphed the shape of the face first, while in others the shape of the eyes were changed before the head shape. Lastly, they also checked whether the UV shows up with faces on which the eyes were scaled to 150%. This feature was rated more eerie on human faces than on doll faces. These results suggest that realism and abnormalities are processed separately from each other and other features may determine what stimuli are perceived as ‘realistic’ or ‘abnormal’.
The Uncanny Valley is not just limited to robotic or morphed faces. Kätsyri, Mäkäräinen, and Takala (2017) compared three different types of movies to each other to check whether the UV also shows up for people who consume these types of media. Several movies were classified as either ‘Cartoonish’, ‘Semi-realistic’ or ‘Human’. The average scores across participants on constructs such as Human likeness of the character, Likability, Strangeness and Eeriness were compared for the three movie types. The ‘Semi-realistic’ movies scored highest on Strangeness and Eeriness, and lowest on Likability, which suggests that this level of human likeness negatively impacts familiarity and increases perceived eeriness. These results are in line with the UV theory, but are not decisive, as no UV graph was plotted.
5 To determine if the UV has an influence on perceived trustworthiness of robots,
Mathur and Reichling (2016) had subjects take part in an “investment game” in which the participant (player A) had to decide on an endowment of money to pass on to the pictured robot (player B). The endowment was then tripled and player B decided what proportion to return to player A. In the experiment, every participant only had one trial in order to prevent them from developing a strategy based on previous experiences. The same third-degree polynomial regression as the one used in the first experiment showed that implicit
trustworthiness aligned with explicit reports of likability and, therefore, also follows an UV structure. Additionally, robots that were perceived as showing a ‘positive emotion’ got a higher score on invested wages, implying these were trusted to a higher degree.
Which cognitive mechanisms underlie the UV are still uncertain. Some researchers suggest it has to do with learned behaviour or personality. Brink, Gray, and Wellman (2017) researched the UV in younger children and linked it to attribution of mind. They found that children until the age of 9 do not rate human-like robots as more eerie than mechanical looking robots. For younger children, perception of mind decreased uncanniness, whereas in older children it was the other way around. It is therefore possible that the UV is a result of violated expectations of what a machine should look or behave like; younger children attribute perceptual abilities to robots, which could explain why they do not think of these robots as ‘creepy’. When this attribution decreases, expectations of what robots should look like will change as well (Brink et al., 2017).
The role of several traits in the sensitivity to the UV was researched by MacDorman and Entezari (2015). They found correlations between higher creepiness scores and nine traits that were supported by existing literature. These traits were Perfectionism, Neuroticism and Anxiety, Animal Reminder Sensitivity, Personal Distress, Human–Robot Uniqueness, Human–Android Uniqueness, Religious Fundamentalism, and Negative Attitudes Toward Robots. They found that individual differences on these traits also predicted differences in the eeriness scores, with the exception of Perfectionism. Some of the examined traits are learned behaviour (such as Religious Fundamentalism), while others are a more biological adaptations of threat avoidance (e.g. Anxiety), meaning the UV could be rooted in biological traits, but strengthened by learned ideas (MacDorman & Entezari, 2015).
6 to avoid illnesses. Contagious diseases were often visible through abnormalities and in order to avoid catching these illnesses, it appears humans evolved mechanisms to respond to these abnormalities with negative emotions (e.g. disgust or anxiety) and behaviours (e.g.
avoidance). However, the system is overactive and also triggers with abnormal features unrelated to contagious diseases (Park et al., 2003). This avoidance can also be seen in monkeys, as they spend less time looking less at realistic synthetic faces as compared to real or unrealistic synthetic faces (Steckenfinger & Ghazanfar, 2009).
Building on this theory, Olivera-La Rosa (2018) theorizes the UV is a social response to avoid interaction with ‘twisted’ individuals. Humans read faces of other individuals to make a judgement on their intentions and abnormal features influence the assumed “moral status” of a face. Incongruent facial features trigger our alarm system, which in turn causes us to avoid these individuals. This effect is also present in robotic faces, as we are unable to accurately ‘read’ these faces. If these faces also have abnormal features, this would cause the characteristic uncanny feeling, which is in line with the research by MacDorman (2006) and Seyema and Nagayama (2007).
One of the oldest theories on the UV is category confusion about whether something falls under human or non-human. Category confusion means one is unable to accurately distinguish entities between known categories (Jentsch, 1906/2008), such as robot and human. In their research, MacDorman and Chattopadhyay (2016) found that increasing category confusion by making 3D replicas of people, animals and objects and presenting transitional images to participants does not increase ratings of eeriness. They proposed instead a theory that realism inconsistency is the cause for the UV. Realism inconsistency refers to
inconsistent levels of realism in a humanlike stimulus. This would lead to conflicting judgements on whether the entity is real.
7 This confusion results in a negative judgement and the eerie feeling (Keeris & Schmettow, 2016).
Theories focused on individual differences, especially regarding learned behaviour, are based on higher level processing. Traits such as Religious Fundamentalism (MacDorman and Entezari, 2015) would require judgements based on pre-obtained knowledge of what a robot should be. Such theories do not take into account the speed at which a face is determined creepy. Slijkhuis and Schmettow (2017) compared the judgements of participants after a short exposure time (50 to 100ms) to judgements after a longer exposure time (2 seconds) on the same stimulus in a replication study of Mathur and Reichling's (2016) experiment. Although the UV shifted towards lower human-likeness with shorter presentation times, the UV was still found. This would suggest that higher processing such as the theories proposed by
MacDorman and Entezari (2015) are unlikely, as the short presentation times do not allow for further cognitive elaboration.
Although there has been a debate on individual differences vs. innate human traits in relation to sensitivity to the UV, most existing research is focused on the existence of the UV in general and on deriving possible explanations thereof. To examine the role of individual differences, however, the first question to ask should be whether the UV is a universal experience. When results are averaged for every participant, there is still a possibility that certain people do not experience the UV at all (or to a much lesser degree than others), even when the results show the UV exists on average. If the UV is a universal experience, it is likely the UV is linked to innate processes in the mind.
The current research aims at answering this question by replicating Mathur and Reichling’s (2016) experiment. In this experiment, participants are shown a number of robot faces ranging from mechanical to humanlike and are asked how they feel about this image. By examining the individual results by means of a mulitlevel polynomial regression, we can check whether the UV is present for every participant and if there are differences in the magnitude of the experiences.
Furthermore, if the UV is a universal experience, it could be examined whether the trough of the UV is the same for everyone as well. In other words; does the same level of human likeness cause the most uncanny feeling for everyone? Should this be the case, it would rule out individual differences and preferences for certain kinds of robots as
8 human likeness invoke the uncanny feeling, while others do so to a lesser degree. If individual differences do show up, it could be examined if personality traits or learning activities shape the facial recognition mechanism that could explain these differences.
Methods
Procedure
Participants were first given a short explanation of the procedure of the study. They were told that they would rate their emotional response on robot faces, but not that the goal of the experiment was to research the Uncanny Valley, because knowing this might result in thinking they were expected to fill it in accordingly and thus resulted in a response bias.
After a participant signed the Informed Consent form, they completed some trial runs of the experiment to get acquainted with the controls and the type of stimuli they would be presented with during the experiment. During these trials, the experimenter was available in the room to answer questions about the program. When the participants cleared the practice trials, the experimenter left the room and the participants completed the experiment by themselves.
In the experiment, participants rated all stimuli on their eeriness three times in random order, with a different item of the scale each time. This was done to avoid influences of stimuli sequence and item formulation on the eeriness scores. In-between every 48 stimuli, there was a short break of at least 30 seconds, after which the participant could choose to continue at any time. When the participant was finished, the experimenter explained the aim of the study and the participant had another chance to ask questions before leaving the room.
Stimuli
9 The stimuli Mathur and Reichling (2016) gathered were found via four Google image searches with the terms ‘‘robot face”, ‘‘interactive robot”, ‘‘human robot,” and ‘‘robot.” Slijkhuis and Schmettow (2017) found their additional stimuli with the terms “humanlike robot” and “human face robot”. These additional stimuli were rated in to be in the range of 70 to 90 ranks of human likeness, as the trough was expected within that range and adding more stimuli would improve the accuracy of the curve. The scores for these faces were inter-rater reliability tested, taking the mean as the human-mechano score.
Mathur and Reichling (2016) set up specific inclusion and exclusion criteria for their stimuli, which were also incorporated in Slijkhuis and Schmettow’s (2017) study. If multiple images of the same robot were found, only the first one they encountered that matched the graphical criteria was accepted. If the graphical criteria were not met, they looked up different images of the same robot. All images were cropped to only display the face entirely.
Inclusion criteria were:
1. Full face is shown from top of head to chin.
2. Face is shown in frontal to 3/4 aspect (both eyes visible). 3. The robot is intended to interact socially with humans. 4. The robot has actually been built.
5. The robot is capable of physical movement (e.g., not a sculpture or purely CGI representation that lacks a three-dimensional body structure).
6. The robot is shown as it is meant to interact with users (e.g., not missing any hair, facial parts, skin, or clothing, if these are intended).
7. The robot represents an android that is plausibly capable of playing the wagering game (e.g., not a baby or an animal).
8. The resolution of the original image (or an exact copy when one could be located) is sufficient to yield a final cropped image at 100 d.p.i. and 3 in. tall.
Exclusion criteria were:
1. The robot represents a well-known character or a famous person (e.g., Einstein). 2. The image includes other faces or human body parts that would appear in the final
cropped image.
3. Objects or text overlap the face. 4. The robot is marketed as a toy.
10 participants, 10 stimuli that had little influence on the UV in Mathur and Reichling’s (2016) and replication studies (Keeris & Schmettow, 2016; Slijkhuis & Schmettow, 2017)
experiments had been taken out.
Measures
The program previously used by Slijkhuis and Schmettow (2017) included items from the ‘eeriness’ construct of a questionnaire designed by Ho and MacDorman (2017). These items had been translated to both German and Dutch by native speakers. The translations were then checked by translating them back to English to compare to the original items. These
translations were required so participants could fill in the experiment in their native language (see appendix A for the translated items).
The items contained of two words describing the stimulus and were filled in using a Visual Analogue Scale with higher scores relating to more negative feelings towards the depicted face. Low scores would mean the emotional response on the face is ‘neutral’ rather than positive, as one would respond to a normal human face. Participants rated each stimulus in threefold, and in the fixed-effects model the average of these three measurements was taken to reflect their emotional response. In the multi-level model, the variance in these
measurements was used.
Design
We used a repeated measure design in which the participants rated robot faces on their eeriness. The independent measure in this experiment is the human-mechano (huMech) score of the faces shown. The dependent measure was the eeriness score as rated by the participants. The repeated measures give a greater accuracy for the real subjective rating of a stimulus, by decreasing the influence of noise.
11 declines. In terms of this research, it would mean scores of emotional response would increase until a certain degree of human likeness, only to decrease after this point. Using this type of model, the UV can also not be researched, as Mori (1970/2012) theorized there is an increase of familiarity up until the human likeness becomes ‘eerie’. When the human likeness
increases even more, the eeriness fades (and thus the emotional response becomes positive again).
Only a third-degree polynomial with both a peak and a trough would accurately depict such a relationship between human likeness and emotional response. This is in line with Mathur and Reichling’s (2016) findings. In their study, they tested the accuracy of a first-, second- and third-degree model on their data and found the third-degree model to be the most fitting.
To estimate the trough of a third-degree polynomial, several steps have to be taken. First, the stationary points have to be found. These are the points at which the slope of the graph is 0, which is either at a peak or a trough. This can be done by plotting the derivative of the polynomial, which shows the slope of the original function at any point x. Secondly, the local minimum point has to be selected. As the derivative of the third-degree polynomial crosses 0 on the y-axis, there are two stationary points. The slope of the first derivative will be positive at the local minimum, meaning this point can be determined by taking the second derivative. When the second derivative is positive at the x of the first derivative crossing 0, it shows the slope of the first derivative is increasing. After this point, the initial function also shows an increase again.
In contrast to Mathur and Reichling (2016), we analyse the polynomials on participant level using multi-level modelling. This is required to answer our research question, because we can only check whether everyone experiences the UV by analysing it per individual.
12 process is repeated numerous times until there are enough samples (van Ravenzwaaij, Cassey, & Brown, 2018).
Materials
The experiment was run on two different computers. The first one had a 15.6" screen, 4GB of RAM, Quad Core Intel Core i5 (2.6 GHz) and ran on OS Windows 10. The second computer had a 15.6” screen, 4GB RAM, Quad Intel Core i5 (2.4 GHz) and ran OS Windows 8.1. Both computers had PsychoPy 1.85.4 installed. As input devices, both computers used a mouse. To minimize the influence of different computers on the responses, both computers were used by the same amount of participants.
Participants
In total, 26 people (19 male) took part in the experiment with ages ranging from 18 to 76 years old (average = 30,15; sd = 14,85). Of these participants, 20were native Dutch speakers; the others were German speakers. We made use of a snowball sample starting with people close to the researcher. 13 participants were psychology students at the University of Twente, of which 4 Master students. All participants signed an informed consent form, confirming they understood the goal and procedure of the study and their voluntary participation.
Results
Exploratory Data Analysis
In the experiment of Mathur and Reichling (2016), the data for all participants was averaged. Doing so gives little insight in the variability of responses and provides no information on if all participants individually experienced the uncanny feeling. Here, we try to find out if every participant shows a characteristic uncanny valley curvature and if so, if the trough position is the same for all participants. However, because this is in part a replication study, average results are first examined.
13 the emotional response ratings. A local maximum (rating -.43) can be found around 25% of the huMech scale (huMech score 20), and a local minimum (rating -.58) at around 75% (huMech 60). In this graph, the eeriness scores were inversed, so higher scores mean lower eeriness ratings (or higher non-eeriness). The higher scores represent a ‘neutral’ response (like seeing an average human face), whereas lower scores mean a negative emotional response (i.e. eerie). The responses on repeated stimuli were highly correlated to each other (.89 for first and second; .90 for first and third; .91 for second and third), meaning the three responses of each participant on the same stimulus were coherent.
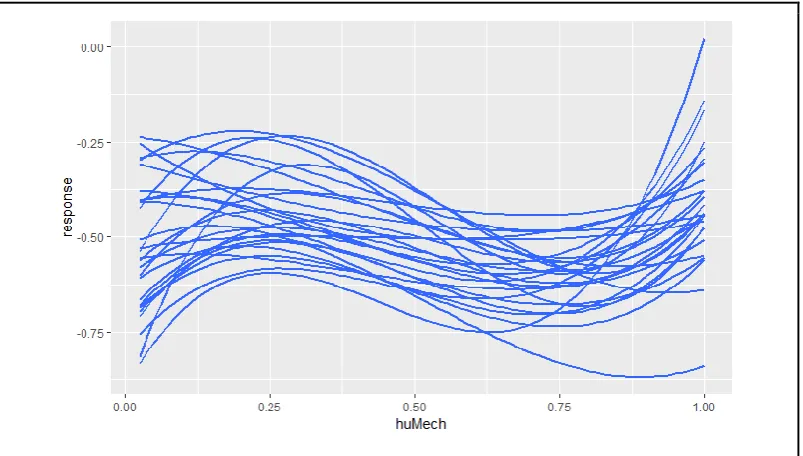
[image:14.595.98.501.447.681.2]However, the individual graphs show some variability in trough depth and position, as can be seen in figure 3. Trough depth resembles the lowest point in perceived non-eeriness, trough position points to the huMech score that resembles the eeriest stimuli. In these graphs, huMech ranges from 0 to 1, which relates to the entire huMech spectrum ranging from 1 to 80. For all participants, the trough position is between 0 and 1, which means our range of stimuli accurately captured the range of the UV for these participants. Had a trough shown up below 0 or above 1, it would mean they would respond more negatively to stimuli that were less or more humanlike than the ones presented in this study. More specifically, all troughs appear in the range of 50% to 90% (or 40 and 72 huMech).
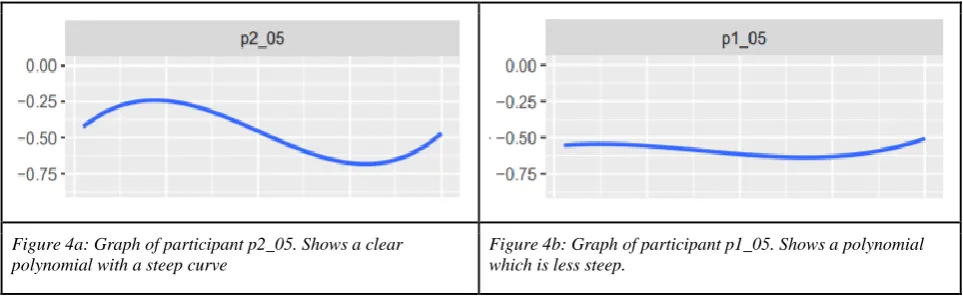
14 In the next section, some examples will be presented to demonstrate this variability. The results for all participants can be found in appendix A. For some participants, the graph appears similar to the one in figure 1 (e.g. p2_05, see figure 4a). These graphs show a local minimum and maximum that differ greatly from each other (-0.25 to -0.65 for p2_05), but these are around the same huMech scores (25% / huMech 20 minimum and 75% / huMech 60 maximum).
Figure 3: Graphs of all participants, showing great variability in trough position and curvature steepness.
For other participants, the difference between highest and lowest non-eerie scores is a lot smaller, making their curves less steep. In these graphs, a local minimum and maximum are visible, but their emotional response ratings are closer to each other (e.g. p1_05 with scores ranging from -0.50 to -0.60; see figure 4b). Most of these participants have the trough around the same huMech score, between ~70% and ~80% (56 and 64 on huMech
15 Figure 4a: Graph of participant p2_05. Shows a clear
polynomial with a steep curve
Figure 4b: Graph of participant p1_05. Shows a polynomial which is less steep.
[image:16.595.66.541.360.508.2]The troughs for all participants are not always in the same area. Although most appear in the 70% to 75% range, there are some exceptions. P2_04 (see figure 5a) shows a trough near the 90% (72 on huMech score), which is higher than the others. The minimum can still be recognized as a trough, as there is a slight increase in non-eeriness afterwards. Therefore, a UV curve can still be discerned.
Figure 5a: Graph of participant p2_04. Shows a polynomial
with a trough around huMech score 0.90 Figure 5b: Graph of participant p1_07. No third-degree polynomial is visible.
Lastly, there are also participants that did not show a characteristic UV curve (e.g. p1_07. see figure 5b). Instead, the non-eeriness levels went down when huMech scores increased until approximately halfway (55% / 44 huMech). A trough was still visible, but the graphs lack a local maximum. After this point, faces became less eerie. More humanlike faces were rated lower than mechanical faces (lowest huMech scored -0.25, whereas highest
huMech (80) scored around -0.35).
Regression analysis
The first steps of the regression analysis concern averaged results, starting with calculating the probability of a trough showing up given the current results. In Bayesian statistics,
16 in 95% of the cases”, but rather explained as a certainty: “With a probability of 95%, the true value is contained in this interval” (Schmettow, 2018). Calculating the probability of a trough showing up given the averaged data in our sample, we can see that this value is 1. This
suggests a probability of 100% that, on average, the Uncanny Valley shows up. Next, we look at the average trough position (see figure 6). As expected, it turns out that the trough is
[image:17.595.125.472.198.406.2]between 70% and 75% (huMech scores 56 and 60).
Figure 6: Average trough position is between 70 and 75% of the huMech scale.
For all MCMC draws (5 chains of 6000 iterations), it is determined whether a trough exists. This results in an overall probability for any participant to experience the UV. In our sample, this probability was bigger than .995 for all participants (see figure 7). For most participants (88%) this probability was virtually 1. This means that for all participants, it is more than 99,5% certain that they experience the Uncanny Valley phenomenon.
[image:17.595.126.469.536.735.2]17 Trough positions are also estimated for every participant. In figure 8, these trough positions are ordered from low to high center value. As can be seen, most participants have a trough around center 70% to 75% (huMech 56 and 60). For these participants, the lower bound is approximately 62% (huMech 50), and the upper bound 80% (huMech 64). The trough most towards ‘mechanical’ is around 55% / huMech 44 (lower bound 48% / huMech 39; higher bound 60% / huMech 48). The trough most towards ‘humanlike’ is centered around 90% / huMech 72, with more variance in bounds (85% / 68 huMech lower, 115% / huMech 92 higher).
Figure 8:Caterpillar graph of trough positions.
Lastly, figure 9 shows the coefficients that make up the polynomial graphs of each individual. These are the values of huMech³, huMech², huMech1 and constant for every participant.
[image:18.595.121.477.533.743.2]18
Additional findings
When looking at the individual ratings participants gave, some distinctive response styles can be discovered. A response style is a participant’s tendency of responding in a way that cannot be explained by scale item (Survey Research Center, 2016).
These response styles are in part caused by the process of anchoring, introspection and binning when evaluating. Anchoring means thinking of what it would mean to give the most extreme values (i.e. what face would call for a “Supernatural” vs “Ordinary” rating).
Introspection is the process of evaluating how intensely they feel about the currently
presented stimulus. This is influenced by several factors, such as current mood and a person’s history. Lastly, binning means dividing the ‘gut feeling’ intensity into the presented categories (e.g. a 5-point Likert scale), in some cases based on stereotypes (Schmettow, 2018).
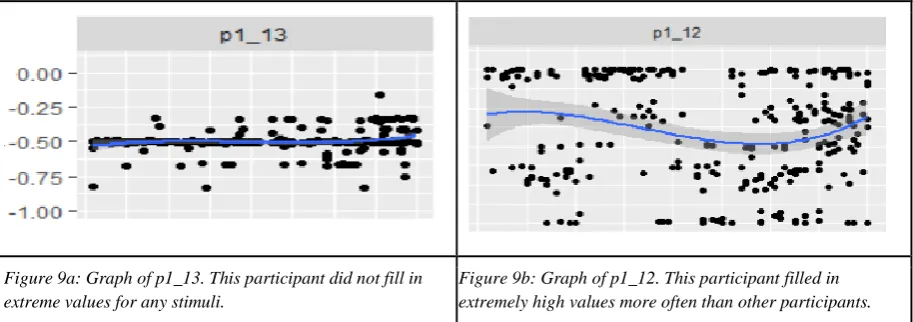
[image:19.595.69.526.455.616.2]Schmettow (2018) also names some response patterns that can be distinguished. Some of these can also be discovered when looking at the results of the current study. For example, p1_13 fits the ‘undecisive’ trope; they do not fill in extreme values for any stimulus (see figure 9a). On the contrary, p1_12 filled in extremely values (especially on the higher end of non-eeriness) more often than other participants (see figure 9b).
Figure 9a: Graph of p1_13. This participant did not fill in extreme values for any stimuli.
Figure 9b: Graph of p1_12. This participant filled in extremely high values more often than other participants.
19 Figure 10: Graphs of p2_01 and p2_02. These participants used the same eeriness values for all stimuli.
Two participants (p2_01 and p2_02) had the same type of responses in the sense that they only filled in 6 or 7 different values. These values are approximately the same for both participants (see figure 10). This is odd, given that we used a Visual Analogue Scale rather than a 7-point Likert scale and therefore any value would be an acceptable response. Both participants also have high outliers on lower huMech scores. These participants show a clear form of binning, as they divided their feeling intensity into 7 points.
Discussion
In research concerning the Uncanny Valley, there has been a debate on whether individual differences or innate human traits are the cause for its existence. The goal of the current research was to provide some insight into the possibility that individual differences could explain the UV phenomenon. We did this by examining whether the Uncanny Valley is a universal experience, in which case we could conclude that individual differences (such as personality or learned behaviour) do not predict whether someone experiences the UV.
20 Our data shows that a local minimum can be found reliably for every participant individually. This means that the Uncanny Valley is indeed a universal experience. In line with Mori’s (1970/2012) theory, there is an increase in affinity until a certain point of human-likeness. Afterwards, the uncanny feeling sets in until a trough can be discerned. Increasing human likeness further would invoke a neutral to positive emotional response again. These results are also present when averaging results across participants, like Mathur and Reichling (2016) did in their research.
However, there is some variability in individual responses. While most participants showed a third-degree polynomial, the intensity of eerie vs. neutral (visible by trough intensity) varied between participants. There were also participants who did not show the initial increase in non-eeriness as human-likeness went up; instead, their ratings decreased as human-likeness increased until a trough. For these participants the ‘valley’ was still visible, but their graphs were not characteristic UV curves.
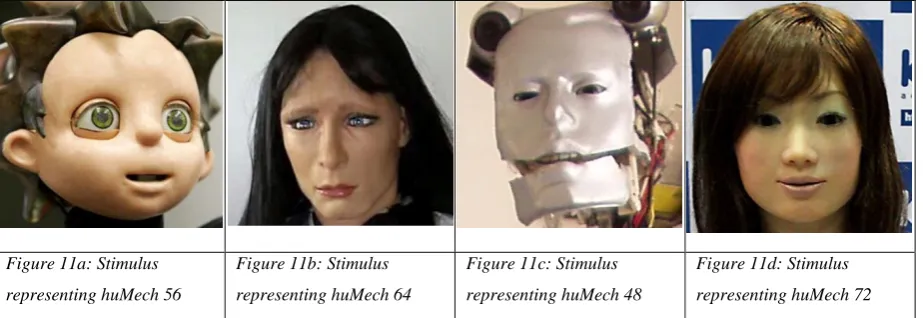
[image:21.595.68.530.563.722.2]Not only trough intensity varies between participants, trough positions (which level of human likeness is considered most eerie) were also different between participants, meaning there is no specific human-mechano (huMech) score that appears least or most eerie to everyone. Most participants showed a trough between 70% and 80% on the huMech scale (Stimuli 56 and 64 respectively, see figures 11a and b). However, there were variations to both the lower end (around 60% – huMech 48, figure 11c) and the higher end (approximately 90% – huMech 72, figure 11d). These individual differences might explain differences found in trough position in previous research (Mori, 1970/2012; Mathur & Reichling, 2016; Keeris & Schmettow, 2016; Slijkhuis & Schmettow, 2017).
Figure 11a: Stimulus
representing huMech 56
Figure 11b: Stimulus
representing huMech 64
Figure 11c: Stimulus
representing huMech 48
Figure 11d: Stimulus
21 Variability in trough depth and trough position between participants means there is support for individual differences modulating sensitivity to the UV. Sensitivity to the UV may be strengthened by individual differences (i.e. personality traits or learned behaviour). The sample in the current study cannot accurately portray the entire population, meaning some factors influencing UV sensitivity could not have been taken into account.
Individual differences in Uncanny Valley sensitivity
Which personal differences could influence the sensitivity to the Uncanny Valley has been topic of research for years, yet not always with conclusive evidence. MacDorman and Entezari’s (2015) provided a collection of theories concerning individual differences influencing the UV.
Some of these theories have been in part debunked already by Slijkhuis & Schmettow (2017) in their research to the UV with short presentation times, as this meant higher level processing was unlikely to be involved in UV sensitivity. Religious Fundamentalism was one of such theories, as it relies on the assumption that religious people negatively respond to these faces, because they resemble humans and humans are supposed to be ‘unique creatures’. Another such theory is Animal Reminder Sensitivity, which proposes we are reminded of our own ‘animalness’ and robots lacking this property are therefore seen as unnatural
(MacDorman & Entezari, 2015).
Other theories proposed in MacDorman and Entezari’s (2015) research might still be viable explanations. These theories concern the traits Perfectionism and Neuroticism/Anxiety, as well as Human-Robot and Human-Android Uniqueness and Personal Distress. Other researchers have found traits that would modulate the UV sensitivity that tie in with the various theories explained by MacDorman and Entezari (2015).
Perfectionism
22 judgement would lead to the negative emotional response, which is in line with the framework presented by Keeris and Schmettow (2016).
Perfectionism was measured in MacDorman and Entezari’s (2015) research with the subscale “Concern over Mistakes” (CM) from the Multidimensional Perfectionism Scale (MPS; Frost, Marten, Lahart, & Rosenblate, 1990). This scale contains nine statements, such as “If I fail partly, it is as bad as being a complete failure” and “I hate being less than the best at things”. A high score would suggest someone experiences negative emotions when making a mistake, such as an erroneous judgement on whether an entity is human or not.
Measuring only concern over mistakes seems to fall short when trying to find a link between perfectionism and UV sensitivity. While the CM scale might explain the negative response on the erroneous judgements, this does not yet take into account the suggested attention for detail perfectionist people would have. This could explain why MacDorman and Entezari (2015) did not find conclusive evidence for such a link. Considering the research by Slijkhuis and Schmettow (2017) in which the UV was shown to be experienced even when stimuli were presented for a short time, it should be expected that the ‘attention for detail’ is a fast process if it would play a part in UV sensitivity. This could be researched by a task in which the participants have to memorize details of specific stimuli that are presented for a short time. To incorporate the theory that attention for detail leads to better flaw recognition, this task could consist of finding differences between sets of two images that differ from each other slightly.
By comparing UV sensitivity of people who perform well on a task that measures attention for detail to those who perform poorly on the same task, and taking into account CM, perfectionism could tested out as a possible explanation of UV sensitivity. People who perform poorly on the ‘attention for detail’ task or score low on CM (or both) are then expected to show a less defined UV curvature.
Neuroticism and anxiety
23 Especially the anxiety facet of neuroticism has been linked to the UV in previous research (Jentsch, 1906/2008). MacDorman and Entezari (2015) suggest anxiety in this context stems from terror management. This theory concerns ways humans deal with the knowledge that death is inevitable, both consciously – for example by suppressing thoughts of death – and unconsciously by having a cultural worldview and self-esteem that one is living up to the values in their worldview. Being faced with an uncanny robot would draw out subconscious mortality-related fears (MacDorman, 2005).
Alternatively, anxiety may be related to the threat avoidance theory. As explained before (see introduction), this is a mechanism meant to avoid illness or otherwise dangerous situations by giving a negative emotional response towards entities that appear to carry contagious diseases or deformities, which in turn leads to a desire to stay away from these individuals (Olivera-La Rosa, 2018; Park et al., 2003). Sasaki, Ihaya and Yamada (2017) found a link between avoidance of novelty and eeriness scores on entities resembling humans. People who scored higher on the Behavioral Inhibition System scales (Carver & White, 1994) also had elevated ratings of eeriness on hard-to-categorize objects.
Examining the BIS scale shows that there are some items which are related to items on the CM scale of the MPS. These items include “I worry about making mistakes” and “I feel worried when I think I have done poorly at something” (BIS) vs. “I should be upset if I make a mistake” (CM). An overlap in measurement scales could suggest that novelty avoidance ties in partly with perfectionism. However, other items do not appear to be shared by
perfectionism, meaning they have not simply been measuring the same aspect.
24 Human–Robot Uniqueness and Android–Robot Uniqueness
Human-Robot and Human-Android Uniqueness are two similar theories, but would influence the UV in opposing ways. Both theories are based on Jentsch’s (1906/2008) category
confusion theory. Human-robot uniqueness refers to someone’s tendency to see ‘robots’ and ‘humans’ as completely separate entities, whereas Android-Robot uniqueness means
knowledge of an ‘android’ concept which is different than ‘robot’. Seeing robots and humans as two unique ‘models’ would increase UV sensitivity, because humanlike robots would not fit either category.
Keeris and Schmettow (2016) added that this confusion stems from an erroneous judgement of a stimulus; something that is first classified as ‘human’ might turn out to be ‘non-human’ after a deeper inspection. This would lead to a negative emotional response which is classified as the ‘uncanny’ feeling.
MacDorman and Entezari’s (2015) explain that android-robot uniqueness would dampen the UV effect, because learning a new cognitive category (i.e. ‘android’) should resolve the uncertainty about which category an entity belongs to. This would mean entities are no longer perceived as ‘human’ or ‘robot’, but either ‘human’, ‘android’ or ‘robot’, which would prevent the deeper inspection leading to a turnover of category and thus the uncanny feeling.
Lischetzke, Izydorczyk, Hüller and Appel (2017) researched UV sensitivity based on a need of structure. People who have a high need for structure are more likely to create
cognitive structures that are clearly defined and well-bounded (such as mental models for ‘human’ and ‘robot’). They are also more likely to respond negatively to situations in which these structures are challenged, or when no clear structure can be found. Lischetzke et al. (2017) reason that encountering a humanlike robot is a novel situation, meaning previous situations – and thereby existing mental models – provide too little information. Therefore, people who have a higher need for structure would respond more negatively to these situations as there is no pre-defined structure to hold onto.
Lischetzke et al. (2017) used a mixed effects model to test whether higher need for structure predicted heightened sensitivity to the UV in two experiments. They found that this effect was present when using fine-grained morphs, but not in a 3-step manipulation.
25 grey area in-between, because these challenge their mental models of what robots are
(Lischetzke et al., 2017).
However, some people with a higher need for structure may already have formed constructs for ‘android’. According to MacDorman and Entezari (2015), these people should not be especially sensitive to the UV, as their current structure is not challenged. Put
differently, a closer inspection of an android would not lead to a turnover of categories. It would make sense that only people who score high on PNS, high on human-robot uniqueness and low on android-robot uniqueness experience the UV – or at least more intensely than others. This might also explain why a 3-step manipulation did not lead to results, whereas fine-grained morphs did have an effect; in the first setup, only categories ‘robot’, ‘android’ and ‘human’ are needed. In the second, there may be faces that do not fit any of these categories well according to the mental model of the viewer, meaning they might still experience the overturning of categories upon deeper inspection.
In the research by Lischetzke and colleagues (2017), need for structure was measured using the Personal Need for Structure (PNS) scale constructed by Neuberg and Newsom (1993). Like the BIS scale, the PNS scale shows overlap with some previously named
measurement scales. For example, “It upsets me to go into a situation without knowing what I can expect from it” (PNS) and “If I think something unpleasant is going to happen I usually get pretty ‘worked up’” (BIS). For people with high need for structure, going into a novel situation is similar to being in an unpleasant situation. Therefore, they might rate these questions equally. Additionally, “I find that a well-ordered life with regular hours makes my life tedious (reverse scaled)” and “I enjoy having a clear and structured mode of life” (PNS) are similar to some items on the “Organization” subscale of the MPS (e.g. “Organization is very important to me”). This overlap could mean ‘need for structure’ is related to both ‘novelty avoidance’ and ‘perfectionism’.
Personal Distress
26 Secondly, these robots could act as reminders of mortality or soullessness (MacDorman & Entezari, 2015).
Both of these theories seem related to the terror management theory or the threat avoidance theory, but differ slightly; rather than invoking a negative response due to fear or disgust, Personal Distress presumes that people try to empathize instead. However, because they usually know a humanlike robot is not actually human, subconscious reminders of its soullessness are thought to block the empathetic response (MacDorman & Entezari, 2015; Misselhorn, 2009).
To measure the Personal Distress construct, MacDorman and Entezari (2015) used the Personal Distress subscale of the Interpersonal Reactivity Index (IRI; Davis, 1980). This scale contains questions on paralysis due to empathy (e.g. “When I am with a friend who is
depressed, I become so uncomfortable that I can't really talk to him” and “When I see
someone who badly needs help in an emergency, I go to pieces”), as well as questions on how someone reacts to emergency situations (e.g. “I tend to lose control during emergencies”). The latter category has some comparability to the Anxiety thing.
Abubshait, Momen, and Wiese (2017) examined the role of empathy, social reasoning and mentalizing skills in UV sensitivity. Using a nested model, taking ‘likability’ as
measurement for UV and Empathy Quotient (Baron-Cohen & Wheelwright, 2004) for empathy, they assessed whether higher scores on empathy predicted a more pronounced UV. In contrast to MacDorman and Entezari (2015), they found no link between the two.
In order to come up with a definite answer, future research could focus on individuals who score particularly low on empathy. If these individuals show a less clearly defined UV curvature, it stands to reason that empathy does influence UV sensitivity.
Additional findings
The first thing to note is that not all the aforementioned research is comparable to each other. Some researchers examined average scores (e.g. MacDorman & Entezari, 2015), whereas others used multi-level models to draw conclusions (e.g. Lischetzke et al., 2017). Burleigh (2015) argues that especially when examining individual differences, the data analysis should include multi-level modelling. When averaging across participants, results might be
27 Some of the measurement scales for different traits do seem to overlap (e.g. the
Behavioral Inhibition System scale and Concern over Mistakes scale of the Multidimensional Perfectionism Scale). Future research could examine which items have higher prediction value for the UV than others. It may be that overlapping questions are the main contributors to the UV, suggesting that only part of the construct is relevant for UV sensitivity.
Different aspects of the evaluated constructs could influence either trough depth (highest perceived eeriness) or trough position (which stimuli appear most eerie). Checking on participant- as well as item-level which influence the UV curvature most, it may be that a different construct (which combines items from different questionnaires) has a bigger
influence on the UV sensitivity than those proposed before.
Limitations of the current study
Aside from the previously discussed sample that is not representative of the entire population, some additional factors could have played a role in the UV measurements in this study. As Slijkhuis and Schmettow (2017) already mentioned in their research using the same eeriness scale (Ho and MacDorman, 2016), the translations of the items could have shaped the responses of participants. Some participants also mentioned they found certain items of the eeriness scale unfitting for certain stimuli, e.g. where the face was neither ‘Uninspiring’ nor ‘Spinetingling’. The Dutch translations of these words – especially the latter, which is ‘Opwindend’ – had different connotations. ‘Opwindend’ could also mean ‘Exciting’ or ‘Arousing’. German participants also mentioned some of these translation ‘errors’.
However, when comparing Dutch and German participants to each other, there are no characteristic differences between them. This suggests that translation issues might only be a minor inconvenience and that it didn’t have a significant effect on the eeriness ratings. Additionally, Mathur and Reichling (2016) used a different measurement in their study, but were also able to provide sufficient evidence for the existence of the Uncanny Valley. These findings contribute to the thought that the exact terminology does not affect the eeriness ratings, so long as the scale has a neutral statement on one end (such as “Uninspiring”) and a negative emotion (e.g. “Shocking”) on the other as is the case in the eeriness scale (Ho and MacDorman, 2016).
28 robots. Being familiar with the definition of the UV combined with the closeness to the
researcher might lead participants to rate the stimuli in a way they think the researcher would expect them to. Despite efforts to only reveal the goal of the experiment after the participant finished it, there were participants who had knowledge about the UV and deducted what the goal of the experiment could be. Even though we did not test for this effect, it is unlikely that this significantly influenced eeriness ratings. At no point during the experiment was the human-mechano score visible for the participant, and ratings for human likeness are mostly subjective. Trying to reliably steer one’s responses to deliberately assist in (or sabotage) the experiment would therefore be a near impossible task.
Subjective ratings of human likeness such as the huMech score used by Mathur and Reichling (2016), Slijkhuis & Schmettow (2017) and in the current study might not be an accurate measurement. As suggested by MacDorman (see introduction), the Uncanny Valley only shows up when stimuli have features of non-humanness. These features would become more salient upon deeper inspection, which would then lead to a negative emotional response (Keeris & Schmettow, 2016). The findings of the current study and the previously named studies suggest otherwise. The UV phenomenon was clearly present for all participants while we did not morph any images to have more salient non-human features.
Additionally, even when a rating scale is accurate, the way participants fill in such a measurement tool can vary. Our results show that participants use different ‘strategies’ when they are answering the questions. Whereas some participants only gave ratings close to the middle (neither eerie nor non-eerie), others filled in extreme values. There were also
participants who appeared to have used the Visual Analogue Scale in the same manner as one would fill in a 7-point Likert scale. All these different response styles could influence the degree to which these ratings represent the ‘true value’. Therefore, the differences found between participants may (in part) be caused by these response strategies.
Conclusion
30
References
Abubshait, A., Momen, A., & Wiese, E. (2017). Seeing human: Do individual differences modulate the Uncanny Valley? Proceedings of the Human Factors and Ergonomics Society, 2017–Octob, 870–874. https://doi.org/10.1177/1541931213601690
Baron-Cohen, S., & Wheelwright, S. (2004). The Empathy Quotient: An Investigation of Adults with Asperger Syndrome or High Functioning Autism, and Normal Sex Differences, 34(2). https://doi.org/10.1023/B:JADD.0000022607.19833.00
Beer, J., Prakash, A., Mitzner, T., & Rogers, W. (2011). Understanding Robot Acceptance: Technical report HFA-TR-1103. Georgia Institute of Technology, 1–45.
Brink, K. A., Gray, K., & Wellman, H. M. (2017). Creepiness Creeps In: Uncanny Valley Feelings Are Acquired in Childhood. Child Development, 00(0), 1–13.
https://doi.org/10.1111/cdev.12999
Burleigh, T. J. (2015). A challenge to the study of individual differences in uncanny valley sensitivity: The importance of looking at individual-level response patterns. Interaction Studies, 16(2), 186–192. https://doi.org/10.1075/is.16.2.04bur
Carver, C. S., & White, T. . (1994). Behavioral inhibition, behavioral activation, and affective responses to imending reward and punishment: The BIS/BAS Scales. Journal of
Personality and Social Psychology, 67(2), 319–333.
Davis, M. H. (1980). A Multidimensional Approach to Individual Differences in Empathy. JSAS Catalog of Selected Documents in Psychology, 10, 85.
https://doi.org/http://dx.doi.org/10.1037/0022-3514.44.1.113
Frost, R. O., Marten, P., Lahart, C., & Rosenblate, R. (1990). The Dimensions of Perfectionism. Cognitive Therapy and Research, 14(5), 449–468.
https://doi.org/10.1007/BF01172967
Ho, C. C., & MacDorman, K. F. (2017). Measuring the Uncanny Valley Effect: Refinements to Indices for Perceived Humanness, Attractiveness, and Eeriness. International Journal of Social Robotics, 9(1), 129–139. https://doi.org/10.1007/s12369-016-0380-9
Jentsch, E. (2008). On the Psychology of the Uncanny (1906). In Uncanny Modernity: Cultural Theories, Modern Anxieties (pp. 216–228). Basingstoke: Palgrave Macmillan. https://doi.org/10.2307/1412663
Kätsyri, J., Mäkäräinen, M., & Takala, T. (2017). Testing the ‘uncanny valley’ hypothesis in semirealistic computer-animated film characters: An empirical evaluation of natural film stimuli. International Journal of Human Computer Studies, 97(September 2016), 149– 161. https://doi.org/10.1016/j.ijhcs.2016.09.010
31 Lischetzke, T., Izydorczyk, D., Hüller, C., & Appel, M. (2017). The topography of the
uncanny valley and individuals’ need for structure: A nonlinear mixed effects analysis. Journal of Research in Personality, 68, 96–113.
https://doi.org/10.1016/j.jrp.2017.02.001
MacDorman, K. F. (2005). Mortality salience and the uncanny valley. Proceedings of 2005 5th IEEE-RAS International Conference on Humanoid Robots, 2005(March), 399–405. https://doi.org/10.1109/ICHR.2005.1573600
MacDorman, K. F. (2006). Subjective Ratings of Robot Video Clips for Human Likeness, Familiarity, and Eeriness: An Exploration of the Uncanny Valley. ICCS/CogSci-2006 Long Symposium: Toward Social Mechanisms of Android Science, 26–29.
https://doi.org/10.1111/j.1524-4725.2009.01121.x
MacDorman, K. F., & Chattopadhyay, D. (2016). Reducing consistency in human realism increases the uncanny valley effect; increasing category uncertainty does not. Cognition, 146, 190–205. https://doi.org/10.1016/j.cognition.2015.09.019
MacDorman, K. F., & Entezari, S. O. (2015). Individual differences predict sensitivity to the uncanny valley. Interaction Studies, 16(2), 141–172.
https://doi.org/10.1075/is.16.2.01mac
MacDorman, K. F., & Ishiguro, H. (2006). The uncanny advantage of using androids in cognitive and social science research. Interaction Studies, 7(3), 297–337.
https://doi.org/10.1075/is.7.3.03mac
Mathur, M. B., & Reichling, D. B. (2016). Navigating a social world with robot partners: A quantitative cartography of the Uncanny Valley. Cognition, 146, 22–32.
https://doi.org/10.1016/j.cognition.2015.09.008
Misselhorn, C. (2009). Empathy with inanimate objects and the uncanny valley. Minds and Machines, 19(3), 345–359. https://doi.org/10.1007/s11023-009-9158-2
Mori, M. (1970). The uncanny valley, 7(4), 33–35. https://doi.org/10.1109/MRA.2012.2192811
Mori, M., MacDorman, K. F., & Kageki, N. (2012). The uncanny valley. IEEE Robotics and Automation Magazine, 19(2), 98–100. https://doi.org/10.1109/MRA.2012.2192811
Neuberg, S. L., & Newsom, J. T. (1993). Personal Need for Structure: Individual Differences in the Desire for Simple Structure. Journal of Personality and Social Psychology, 65(1), 113–131. https://doi.org/10.1037/0022-3514.65.1.113
Olivera-La Rosa, A. (2018). Wrong outside, wrong inside: A social functionalist approach to the uncanny feeling. New Ideas in Psychology, 50(January), 38–47.
32 Park, J. H., Faulkner, J., & Schaller, M. (2003). Evolved disease-avoidance processes and
contemporary anti-social behavior: Prejudicial attitudes and avoidance of people with physical disabilities. Journal of Nonverbal Behavior, 27(2), 65–87.
Sasaki, K., Ihaya, K., & Yamada, Y. (2017). Avoidance of novelty contributes to the uncanny valley. Frontiers in Psychology, 8(OCT), 1–13.
https://doi.org/10.3389/fpsyg.2017.01792
Schmettow, M. (2018). New statistics for the design researcher A Bayesian course in tidy R. Retrieved January 11, 2019, from
https://schmettow.github.io/New_Stats/GLM.html#rating-scales
Seyema, J., & Nagayama, R. S. (2007). The Uncanny Valley: Effect of Realism on the Impression of Artificial Human Faces. Technology, 16(4), 337–351.
Slijkhuis, P. J. H., & Schmettow, M. (2017). The Uncanny Valley Phenomenon A replication with short exposure times. University of Twente.
Steckenfinger, S. A., & Ghazanfar, A. A. (2009). Monkey visual behavior falls into the uncanny valley. Proceedings of the National Academy of Sciences, 106(43), 18362– 18366. https://doi.org/10.1073/pnas.0910063106
Survey Research Center. (2016). Response Styles. Retrieved January 11, 2019, from http://ccsg.isr.umich.edu/index.php/resources/advanced-glossary/response-styles van Ravenzwaaij, D., Cassey, P., & Brown, S. D. (2018). A simple introduction to Markov
Chain Monte–Carlo sampling. Psychonomic Bulletin and Review, 25(1), 143–154. https://doi.org/10.3758/s13423-016-1015-8
Złotowski, J. A., Sumioka, H., Nishio, S., Glas, D. F., Bartneck, C., & Ishiguro, H. (2015). Persistence of the uncanny valley: the influence of repeated interactions and a robot’s attitude on its perception. Frontiers in Psychology, 6(June), 1–13.
33
Appendix A
English items Dutch items German items
Low High Low High Low High
Reassuring Eerie Geruststellend Griezelig Beruhigend Gruselig
Numbing Freaky Nietszeggend Eng Nichtssagend Unheimlich
Ordinary Supernatural Gewoontjes Bovennatuurlijk Gewöhnlich Übernatürlich Uninspiring Spinetingling Oninteressant Opwindend Uninteressant Aufregend
Boring Shocking Saai Schokkend Langweilig Schockierend
Predictable Thrilling Voorspelbaar Spannend Vorhersehbar Spannend
Bland Uncanny Flauw Verontrustend Fade Beunruhigend
37
Appendix C
Regression analysis
Regression averaged over stimuli
We start with the same model as Mathur, using a third degree polynomial on averaged data:
𝜇𝑖 = 𝛽0+ 𝛽1𝑥𝑖 + 𝛽2𝑥𝑖2+ 𝛽3𝑥𝑖3
In the later analysis we will estimate the trough of the UV curve as this is the most
characteristic point of the function. It denotes where participants have the strongest feelings of aversion. Below, we define a function to compute the lowest stationary point (the trough) of third degree polynomials.
## Finds the trough of the UV function (3d polynomial), ## if no exists in real space, it returns Na
trough <- function (coef, ...) {
UseMethod("trough", coef)
}
trough.numeric
function(coef = c(-.2, -.5, .2, .7)) {
if(length(coef) != 4) stop("the uncanny valley trough polynomi al requires exactly four parameters")
poly <- polynomial(coef) dpoly <- deriv(poly) ddpoly <- deriv(dpoly) points <- solve(dpoly)
pt_dir <- as.function(ddpoly)(points) if(!(any(is.complex(pt_dir)))){
points[pt_dir > 0] }else{
NA } }
trough.matrix
function(coef) plyr::aaply(as.matrix(coef), .margins = 1, trough)
trough.data.frame <- function(coef) trough(as.matrix(coef))
# as.function(polynomial(c(-1, -2, -3, -4))) # c <- c(-1,-2,3,4)
# m <- matrix(c(c, -.1,-.2,.3,.4), nrow = 2, byrow = T) #
38
#
# trough(c) # trough(m)
fn_uncanny
function (coef, ...) {
UseMethod("fn_uncanny", coef)
}
fn_uncanny.numeric
function(coef) {
if(length(coef) != 5) stop("not the correct number of parameters
,
four coefficients and x required")
coef[1] +
coef[2] * coef[5] +
coef[3] * coef[5]^2 +
coef[4] * coef[,5]^3 }
fn_uncanny.matrix
function(coef) {
if(ncol(coef) != 5) stop("not the correct number of columns,
four coefficients and x required")
coef[,1] +
coef[,2] * coef[,5] +
coef[,3] * coef[,5]^2 +
coef[,4] * coef[,5]^3 }
fn_uncanny.data.frame
function(coef) {
fn_uncanny(as.matrix(coef))
}
dp_str
function(coef){
print(str(coef))
}
# ## #
# fn_maxlike <-# function(coef) {
# coef_1 = cbind(coef, 0)
39
#
## use this to beautify rstanarm parameter names from polynomial reg ression
recode_poly_par
function(P){
P_out
P_1 %>%
mutate(parameter = recode(parameter,
"poly(huMech, 3)3" = "huMech3", "poly(huMech, 3)2" = "huMech2", "poly(huMech, 3)1" = "huMech1", "Intercept" = "huMech0"),
fixef = recode(fixef,
"poly(huMech, 3)3" = "huMech3", "poly(huMech, 3)2" = "huMech2", "poly(huMech, 3)1" = "huMech1", "Intercept" = "huMech0"))
class(P_out) <- class(P)
P_out }
str_recode_poly
function(P) {
P <- str_replace(P, "poly\\(huMech, 3\\)", "huMech") P <- str_replace(P, "Intercept", "huMech0")
P }
recode_poly_par
function(P){
P_out
P_1 %>%
mutate(parameter = str_recode_poly(parameter),
fixef = str_recode_poly(fixef))
class(P_out) <- class(P)
P_out }
par.poly <- function(P){ P_out <- P %>%
tidyr::extract(fixef,
into = c("par_poly"), regex = "(huMech.)", remove = F) %>%
class(P_out) <- class(P)
40
# trough.tbl_post <-# function(P){
# P <- as_data_frame(P_1) # P_mat
<-# P %>%
# filter(str_detect(par_poly, "huMech")) %>% # select(iter, Condition, par_poly, value) %>% # spread(key = par_poly, value = value)
# }
# P_1 %>% ## copying huMech0 to get a complete column set # filter()
# bind_rows()
We start with a regression on average responses (over stimuli). As we have averaged over stimuli, we only have fixed effects.
load("RK.Rda") F_1
formula("response ~ 0 + (huMech0 + huMech1 + huMech2 + huMech3)")
# F_1 <-
# formula("response ~ 0 + poly(huMech, 3):Condition")
M_1
RK_2 %>%
brm(F_1,
family = gaussian, data = .,
chains = 4, iter = 1000)
## Compiling the C++ model
## Start sampling
save(M_1, file = "M_1.Rda")
load("M_1.Rda")
P_1
posterior(M_1) %>%
print()
## ** tbl_post: 2000 samples in 4 chains ##
## ** Effects:
41 ## ** Dispersion:
## parameter ## sigma ##
## ** Shape:
## data frame with 0 columns and 0 rows ##
## ** Correlations:
## data frame with 0 columns and 0 rows ##
## ** User annotations: ##
load("RK.Rda") load("M_1.Rda")
P_1
posterior(M_1) %>%
mutate(par_poly = as.integer(str_remove(fixef, "huMech"))) %>%
posterior()
We compute the posterior distribution of troughs:
T_1 <- fixef(P_1)
T_1_fitted
predict(M_1)
# T_1_poly
<-# data_frame(huMech = seq(from = 0, to = 1, length.out = 101)) %>% # right_join(T_1) %>%
# mutate(score = huMech0 + huMech1 * huMech +
# huMech2 * huMech^2 + huMech3 * huMech^3)
P_1_tr
P_1 %>%
filter(type == "fixef") %>%
select(iter, par_poly, value) %>%
spread(par_poly, value) %>%
mutate(trough = trough(.[2:5]))
T_1_tr
P_1_tr %>%
filter(!is.na(trough)) %>%
dplyr::summarize(center = modeest::shorth(trough), lower = quantile(trough, .025),
42 T_1_tr
RK_2 %>%
ggplot(aes(x = huMech, y = response)) +
geom_point(alpha = .3) +
geom_smooth(method="lm", se=TRUE, fill=NA,
formula=y ~ poly(x, 3, raw=TRUE)) +
#geom_point(data = T_1_tr, aes(x = center), y = -0.4, size = 3) +
geom_errorbarh(data = T_1_tr,
aes(x = center, xmin = lower, xmax = upper, y = 0.1), height = .1)
Computing the probability that a trough exists.
Multilevel model
Now, the non-averaged data is analyzed, where we have repeated measures. The model builds on the previous polynomial model, but adds participant-level random effects (as well as item-level and stimulus-level). Practically, this means that individual polynomials are estimated - one per participant. In result, we can describe individual differences in UV sensitivity. Do people have the same position of where their perceived uncannines is?
As in the original data set we only have fifteen responses per participant, the following analysis uses only data from our experiment, where we have 40 per condition.
load("RK.Rda")
F_2
formula(response ~
0 + huMech0 + huMech1 + huMech2 + huMech3 +
((0 + huMech0 + huMech1 + huMech2 + huMech3)||Part) +
((0 + huMech0)|Item) +
((0 + huMech0)|Stimulus))
M_2
brm(F_2,
data = RK_1, iter = 6000, warmup = 2000, chains = 5,
control = list(max_treedepth = 12))
save(M_2, file = "M_2.Rda")
load("M_2.Rda")
43 Population-level troughs
We start with the fixed effects, which reflects the population-level. We expect that the effects are similar to those obtained by averaging over participants. The plot below shows the fitted curves in all three conditions with the estimated population-level trough.
## extracting posterior and fitted values P_2 <- posterior(M_2)
T_2_fixef <- fixef(P_2) T_2_ranef
P_2 %>%
filter(re_factor == "Part") %>%
posterior() %>%
ranef()
# P_2 %>%
# filter(type == "ranef") %>%
# group_by(par_poly, Condition) %>% # summarize(center = shorth(value)) %>% # select(par_poly, Condition, center) %>% # spread(par_poly, center)
#
# kable(T_2, digits = 2)
Now we calculate the population level trough positions and depth of trough (fall). Depth of trough is calculated from the left, i.e. huMech = 0.
# fixed effects posterior
P_2_fixef
P_2 %>%
filter(type == "fixef") %>%
mascutils::discard_redundant()
P_2_trough
P_2_fixef %>%
select(chain, iter, fixef, value) %>%
spread(fixef, value)
P_2_trough$trough
P_2_trough %>%
select(huMech0:huMech3) %>%
trough()
P_2_trough$trough_like
P_2_trough %>%
select(huMech0:huMech3, trough) %>%
44 P_2_trough$low_like <- ## likeability at zero huMech
P_2_trough %>%
select(huMech0:huMech3) %>%
mutate(huMech_pos = 0) %>%
fn_uncanny()
P_2_trough$fall
P_2_trough$low_like - P_2_trough$trough_like
T_2_trough
P_2_trough %>%
select(trough, fall) %>%
gather(parameter, value) %>%
filter(!is.na(value)) %>%
group_by(parameter) %>%
dplyr::summarize(center = median(value), lower = quantile(value, .025), upper = quantile(value, .975))
kable(T_2_trough, digits = 2)
parameter center lower upper fall 0.04 -0.06 0.15 trough 0.73 0.67 0.79
Participant level-troughs
Mathur et al. examined the UV effect on population level, meaning that first all responses are averaged over participants. Averaging polynomials is a bad idea when participants differ in how they respond to the stimuli. In previous studies we have seen strong variation in participants response patterns, so this can be an issue. With a random effects analysis, we can estimate a polynomial curve per participant. We will see a bunch of curves and our question of interest is:
1. Do participants vary in where they experience their trough? 2. Do participants differ in their overall response pattern?
3. What is the probability for any participant to experience the uncanny valley (i.e. there exists a trough)
Random effect and fixed effects parameters are part of a linear model, which is why we first have to extract the posterior distributions for fixed and random effects separately. Then we sum fixed effects and participant-level random effects to get the polynomial coefficients per participant. From that we derive the participants’ troughs. All transformations are
performed on posterior samples. Point and interval estimates are computed at the very last step.
G_variation_polynomial
P_2 %>%