warwick.ac.uk/lib-publications
Original citation:
Chau, Yu-Xi, Connaughton, Colm and Grosskinsky, Stefan. (2015) Explosive condensation in
symmetric mass transport models. Journal of Statistical Mechanics : Theory and Experiment,
2015 (11). P11031.
Permanent WRAP URL:
http://wrap.warwick.ac.uk/79428
Copyright and reuse:
The Warwick Research Archive Portal (WRAP) makes this work by researchers of the
University of Warwick available open access under the following conditions. Copyright ©
and all moral rights to the version of the paper presented here belong to the individual
author(s) and/or other copyright owners. To the extent reasonable and practicable the
material made available in WRAP has been checked for eligibility before being made
available.
Copies of full items can be used for personal research or study, educational, or not-for-profit
purposes without prior permission or charge. Provided that the authors, title and full
bibliographic details are credited, a hyperlink and/or URL is given for the original metadata
page and the content is not changed in any way.
Publisher’s statement:
"This is an author-created, un-copyedited version of an article accepted for
publication/published Journal of Statistical Mechanics : Theory and Experiment. IOP
Publishing Ltd is not responsible for any errors or omissions in this version of the manuscript
or any version derived from it. The Version of Record is available online at
http://dx.doi.org/10.1088/1742-5468/2015/11/P11031
."
A note on versions:
The version presented here may differ from the published version or, version of record, if
you wish to cite this item you are advised to consult the publisher’s version. Please see the
‘permanent WRAP URL’ above for details on accessing the published version and note that
access may require a subscription.
Explosive condensation in symmetric mass
transport models
Yu-Xi Chau1, Colm Connaughton1,2,3, Stefan Grosskinsky1,2
1Centre for Complexity Science, University of Warwick, Coventry CV4 7AL, UK
2 Mathematics Institute, University of Warwick, Coventry CV4 7AL, UK 3 London Mathematical Laboratory, 14 Buckingham St., London WC2N 6DF,
UK
E-mail: y-x.chau@warwick.ac.uk, c.p.connaughton@warwick.ac.uk, s.w.grosskinsky@warwick.ac.uk
Abstract. We study the dynamics of condensation in a misanthrope process
with nonlinear jump rates and factorized stationary states. For large enough density, it is known that such models have a phase separated state, with a non-zero fraction of the total mass concentrating in a single lattice site. It has been established in [B Waclaw and M R Evans, Phys. Rev. Lett., 108(7):070601, 2012] for asymmetric dynamics that such processes exhibit explosive condensation, where the time to reach the stationary state vanishes with increasing system size. This constitutes a spatially extended version of instantaneous gelation which has previously been studied only in mean-field coagulation models. We show that this phenomenon also occurs for symmetric dynamics in one dimension if the non-linearity is strong enough, and we find a coarsening regime where the time to stationarity diverges with the system size for weak non-linearity. In higher space dimensions explosive condensation is expected to be generic for all parameter values. Our results are based on heuristic mean field arguments which are confirmed by simulation data.
1. Introduction
The statistical mechanics of non-equilibrium cluster growth is a topic of recurring scientific interest due to a wide range of applications in polymer physics, atmospheric science, soft matter and astrophysics (see [1] and the references therein). A large collection of clusters is studied, each of which is an aggregate of constituent units called monomers. Clusters grow as a result of pairwise interactions. Two basic growth mechanisms are common in practice: coagulation and particle exchange. In coagulating systems, when a cluster of sizeiinteracts with a cluster of sizej, a single cluster of size i+j is formed. In particle exchange models, when a cluster of size
i interacts with a cluster of size j, a monomer is exchanged, resulting in a pair of clusters with sizes i−1 and j+ 1. Related is the well-known Becker–D¨oring model of homogeneous nucleation where monomer exchange is indirect: clusters grow or decay by absorbing or shedding one monomer at a time (see [2] and the references therein). In both coagulation and particle exchange models, the rates of interaction generally depend on the sizes, i andj, of the interacting clusters. This dependence is encoded in a (usually symmetric) function, K(i, j), of the cluster sizes called the interaction kernel. GivenK(i, j), one fundamental question of practical importance is to understand the rate at which large clusters are formed.
A common feature of both processes which is relevant to this question is a dynamical transition known as gelation. It occurs when the kernel is a sufficiently rapidly increasing function of the particle sizes. Gelation was originally discovered as a singularity in the mean-field coagulation equations resulting in the divergence of the second moment of the cluster size distribution in a finite time,t∗. For a full discussion
see [3] and the references therein. The mean field equations for exchange driven growth can exhibit similar behaviour [4]. The meaning of this singularity becomes clear if one considers a finite Markov chain [5] containingN particles and studies its behaviour in the limitN → ∞. This was done explicitly for coagulation with the product kernel,
K(i, j) =ij, in [6]. It was shown that, for fixedN, a finite fraction of the total mass in the system is collected into a single ”super-particle” within a timetN. AsN → ∞,
tN tends to a finite value, t∗, known as the gelation time and the mass contained in
the super-particle diverges. Gelation in an infinite system is therefore interpreted as the formation of a cluster of arbitrarily large size within a finite time.
Soon after the discovery of the gelation transition, it was conjectured [7,8] that for some kernels, the gelation time,t∗, is zero. The counter-intuitive idea that arbitrarily
large clusters could form in arbitrarily short time is called instantaneous gelation. This effect was proven rigorously for coagulation models in [9]. A similar regime is observed for exchange-driven growth [4] and for the Becker-D¨oring model [10, 11]. Since it exhibits a singularity at time 0+, instantaneous gelation cannot be described using mean field kinetic equations without introducing some kind of regularisation. Such regularisation could be done by introducing an explicit cut-off into the kinetic theory as was done for coagulation in [12] or by heuristically incorporating a finite system size,N, into the mean field equations as was done for exchange-driven growth in [4]. In both cases, there is strong evidence that while the gel time indeed decreases as the regularisation is removed, this decrease is logarithmically slow. Consequently it is expected to be difficult to distinguish between regular finite time gelation and instantaneous gelation in practice.
extended systems. A counter-example has recently been found [13] in a variation of a spatially extended exchange-driven growth model of misanthrope type. Misanthrope processes [14, 15] are lattice models in which particles jump between neighbouring sites at rates which are a function of the number of particles at both the origin and destination sites. If one thinks of each site on the lattice as a cluster, the analogy with exchange-driven growth becomes clear. Such processes have been extensively studied because they can exhibit stationary measures which can be factorised as a product of single site measures and calculated analytically. Furthermore, these stationary measures can exhibit an interesting transition as the total particle density is varied. If the density exceeds a critical value, a finite fraction of all particles concentrates on a single lattice site, whereas the bulk of the system is distributed homogeneously at the critical density. This phenomenon is referred to as condensation and the site on which a fraction of all particles concentrates is called the condensate. The connection between condensation and gelation emerges when one considers the dynamics of how the condensate is formed in time. The condensate is the analogue of the super-particle discussed above. The question of how the condensate forms dynamically cannot be answered solely from knowledge of the stationary product measure itself. The model studied in [13] was found to generate a condensate in a time which decreases logarithmically with the system size, like in the case of instantaneous gelation. They called this effect ”explosive condensation”.
The dynamics of condensation in spatially homogeneous particle systems has already been studied heuristically in [16] and in subsequent work on zero-range processes [17, 18, 19, 20, 21] and related models [22, 23]. In these processes the jump rate of particles depends only on the occupation number on the departure site, and condensation occurs if this is a sufficiently fast decreasing function. There is also a significant literature on the dynamics of condensation in spatially heterogeneous models (see [24] and references therein) which is not discussed here. Mathematically rigorous results in the homogeneous case have first been obtained for stationary distributions (see [25, 19,26] and references therein), and more recently also on the stationary dynamics of the condensate (see e.g. [27, 28]), and the formation of the condensate from homogeneous initial conditions [29]. The hydrodynamic behaviour has been studied heuristically in [30]. In condensing zero-range type models the motion of large clusters is the slowest time scale, exchange of particles occurs through fluctuations in size, and relaxation time scales diverge with the system size.
While misanthrope-type processes share the same factorized stationary states as zero-range processes, the dynamics of condensation is entirely different [31,32]. Large clusters move on the same time scale as they exchange particles, or merge when they meet. This has first been established for the inclusion process on a rigorous level in [33] and with heuristic extensions in [34]. This process has been introduced in [35] and is basically a linear version of the explosive condensation model, where condensation occurs only due to the scaling of a system parameter [36]. This induces a separation of time scales, and relaxation times diverge with the system size. Besides applications to energy transport [37], the inclusion process can also be interpreted as a multi-allele version of the Moran model [38]. The model studied here would be a non-linear extension of the latter, where the competitive advantage of a group increases super-linearly with the group size. Further applications are discussed in [32] and references therein.
0 0.2 0.4 0.6 0.8 1 0
50 100 150 200 250 300 350
t
σ
2(
t
)
Stationarity Coarsening
Nucleation
0 0.5 1 1.5 x10⁻²
0 20 40 60 80 100 120
t
σ
2(
t
)
0 0.2 0.4 0.6 0.8 1 x10 −2
0 2 4 6 8 10 12 14 16 18
t
σ
2(
t
)
Initialization Explosion
Explosion
Nucleation Stationarity
[image:5.595.100.469.79.253.2]Nucleation begins
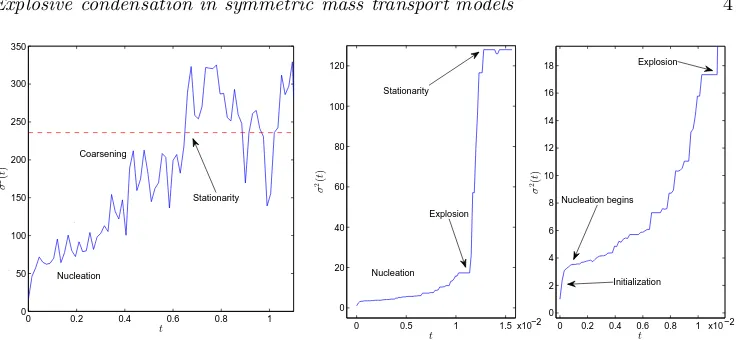
Figure 1. The two different mechanisms of condensation, with coarsening (left) for γ= 2.25 and explosion (middle and right) forγ= 4.5, are illustrated using the second moment of occupation numbersσ2(31). For explosion, nucleation of clusters leads to a gradual increase (zoom on right) until one cluster reaches a critical size. In contrast, the coarsening regime (left) is not well separated from nucleation and both lead to a gradual increase to reach stationarity. Further parameter values areL= 128 andρ= 4,d= 0.2 (left) andρ= 1,d= 0.3 (right).
condensation depend crucially on the asymmetry of the dynamics which facilitates mass transport. In this paper we show that this is not the case, and establish a detailed picture of the condensation dynamics for a symmetric system on a one-dimensional lattice with periodic boundary conditions. If the non-linearity of the jump rates is strong enough (characterized by a system parameter γ >3) explosive condensation occurs analogously to the asymmetric system. Local fluctuations of the initial conditions are amplified and clusters form in an initial nucleation regime. As soon as one of them reaches a critical size explosion occurs, the cluster moves fast enough to cover the whole lattice in a vanishing amount of time and grow into the condensate. For weaker non-linearity (with system parameter γ ∈ (2,3)), the critical cluster size cannot be reached and several macroscopic clusters form during nucleation. These are then moving across the lattice, exchanging mass in a coarsening regime very similar to the dynamics in inclusion processes, and the time to reach a single condensate diverges with the system size. These two mechanisms are illustrated in Figure1using the second moment of the occupation numbers (cf. (31)) as a suitable observable to characterize the distance to stationarity. The second mechanism does not exist for asymmetric dynamics or symmetric dynamics in higher dimensions. Our derivation also applies to asymmetric systems and all dimensions, and provides a slight simplification of the arguments presented in [13].
The paper is organised as follows. In Section 2 we introduce the model and summarize known results on the stationary distributions, emphasizing differences to zero-range models regarding the stationary particle current or activity. In Section3
2. The model
2.1. Definition and notation
The explosive condensation model (η(t) :t≥0) is a stochastic particle system defined on a lattice ΛL ofLsites, which we fix to be one-dimensional with periodic boundary
conditions. Configurations are denoted by η= (ηx :x∈ΛL)∈XL whereηx∈N is
the number of particles at sitex∈ΛL. This can be arbitrarily large and the full state
space is given byXL=NΛL.
A particle at sitexjumps to sitey6=xwith rate
c(η, x, y) :=p(x, y)ηxγ(d+ηγy) with parameters γ >1, d >0. (1)
The purely spatial part p(x, y)≥ 0 is given by rates of an irreducible random walk on the lattice Λ, which determines the dynamics of a single particle together with the parameterd >0. In this paper we focus on symmetric nearest neighbour dynamics with
p(x, y) =1
2δy,x+1+ 1
2δy,x−1 , (2)
other choices are shortly discussed in Section 4. The interaction part of the rates is such that larger occupation numbers on the departure or target site increase the jump rate in a super-linear fashion, controlled by the parameter γ >1. These rates are a slight variation of the ones introduced in [13], which are
(ηx+d)γ−dγ(d+ηy)γ . (3)
We present our analysis and numerical results for the rates (1) since they have a slightly simpler form. Forγ= 1 both rates coincide, and correspond to the previously studied inclusion process [33,34]. They show the same asymptotic behaviour and all results, including factorized steady states as well as condensation dynamics, hold in an analogous fashion in both models. For reference, if spatial structure is neglected and
dis small compared to site occupation numbers, the rate equations for this model are equivalent to those studied for exchange-driven growth by Ben-Main and Krapivsky [4] with the simple product kernel K(i, j) = (i j)γ. For reasons, explained below, we
shall be interested in the regime γ >2. At the mean field level, this regime should exhibit instantaneous gelation according to the analysis of [4].
The dynamics of the continuous-time process (η(t) :t≥0) is then given by the usual master equation
d
dtpt[η] =
X
x,y∈Λ
c(ηy,x;x, y)pt[ηy,x]−c(η;x, y)pt[η]
(4)
for allη∈XL, with the shorthandpt[η] =P[ηt=η]. We use the notationηy,x with
ηy,x
z =ηz−δz,y+δz,x for the configuration η with one particle moved from siteyto
x, and the usual convention that pt[η] = 0 ifηz<0 for somez∈Λ.
2.2. Stationary distributions
Factorized stationary states for this class of misanthrope processes are well established, see [15] as well as [31,32] and references therein. Since we focus on translation invariant systems, we have homogeneous factorized distributions
νφL[η] =
Y
x∈ΛL
νφ[ηx] with marginals νφ[n] =
1
z(φ)w(n)φ
Here the stationary weights are given by
w(n) =
n
Y
k=1
(k−1)γ+d
kγ ∼n−
γ asn
→ ∞, (6)
where the asymptotic behaviour is the same as for the rates (3) used in [13]. So the single-site partition function is
z(φ) =
∞ X
k=0
w(k)φk<∞ for allφ∈[0,1], (7)
since we assumeγ >1. The fugacity parameterφcontrols the average particle density in the grand-canonical setting, which is given by the expectation
R(φ) :=hηxiφ=
∞ X
k=0
kνφ[k] =φ∂φlogz(φ). (8)
This is a monotone increasing function with R(0) = 0 and maximal value ρc :=
R(1) ∈ (0,∞]. In complete analogy to previous results on zero-range processes [16,17,18,19] and the model with rates (3) in [13], the process exhibits condensation in the thermodynamic limit if the critical densityρc<∞, which is the case if and only
if γ >2. In that case, the system phase separates into a homogeneous background
with densityρc, and the excess mass (of order (ρ−ρc)Lparticles) concentrates on a
single lattice site, called the condensate.
Mathematically, this is formulated in terms of the canonical distributions
πL,N[η] :=
1XL,N(η)
ZL,N
Y
x∈ΛL
w(ηx), (9)
which concentrate on configurationsXL,N =η∈XL :Px∈ΛLηx=N with a fixed
particle numberN ≥0, and the normalization ZL,N is simply given by a finite sum
over all stationary weights. The process is ergodic on the finite setXL,N, andπL,N
is the unique stationary distribution. Condensation can then be understood in terms of the equivalence of canonical and grand-canonical ensembles in the thermodynamic limit with densityρ≥0,
πL,N →
νφ, R(φ) =ρ≤ρc
ν1, ρ≥ρc , asN, L→ ∞, N/L→ρ . (10)
This has been established rigorously in [25,19,26,39] and holds in a weak sense, i.e. canonical expectationshfiL,N of bounded, local functionsf :XL,N →Rconverge to
the corresponding expectation hfiφ under the grand-canonical product distribution.
Forρ < ρc this also holds for unbounded integrable functionsf [31].
The interpretation is that for ρ > ρc the system exhibits a phase separated
(condensed) state with a single condensate as explained above. Depending on the initial condition, the condensed phase can have larger initial volume which shrinks during time evolution, as is the case in the well-studied coarsening process for zero-range dynamics [20,19,29] or inclusion processes [33,34]. The homogeneous (or bulk) phase of the system is distributed with a truncated version of the critical distribution ¯
ν1, where occupation numbers are bounded by a size of orderLdue to the presence of
2.3. Fundamental diagram
A typical stationary configuration in the explosive condensation model looks almost identical to that of extensively studied condensing zero-range processes with rates
g(n) = 1 +b/n, since the stationary weights w(n) have the same power-law decay. However, as has already been observed in [13] for totally asymmetric rates, the dynamics of the process is very different. On the level of stationary distributions this is signified by the expected jump rate
jL,N :=
ηxγ(d+ηγy)
L,N , (11)
and its behaviour in the thermodynamic limit
j(ρ) := lim
N,L→∞
N/L→ρ
jL,N . (12)
This corresponds to the activity in a symmetric system, and to the stationary current in an asymmetric system wherej(ρ) determines the fundamental diagram of the model. For simplicity we refer to this quantity simply as current in the following. With the equivalence of ensembles, the limiting current can be computed at least for ρ < ρc
under the factorized grand-canonical distribution choosingφaccording to (10),
jgc(φ) :=ηxγ(d+ηyγ)
φ=hη γ
xiφ d+hηγyiφ. (13)
For general zero-range processes it is well known thatjgc(φ) =φ, and thereforej(ρ)
is simply given by the inverse of (8) for ρ < ρc. Since the rates g(n) = 1 +b/n are
bounded, (10) also implies thatj(ρ) = 1 for allρ≥ρc. The convergence for finite L
is dominated by the jump rateg((ρ−ρc)L) out of the condensate [40] (as shown in
Figure 2). So the condensed phase in zero-range models does not contribute to the current in this model, and it is known that the condensate remains at a fixed position and only moves on a very slow timescale [20,27,28].
For the model studied here, however, the rates are not bounded and it is clear from the power-law decay in (6) and (13) that the current diverges asρ→ρc. This indicates
that the condensed phase contributes to, and in fact dominates the stationary current for super-critical systems. As opposed to zero-range processes, the condensate moves with a high rate of order Lγ as is discussed in more detail later. In the condensed
state of a system withN particles onLsites whereN/L > ρc, the canonical stationary
current is therefore asymptotically given by
jL,N '
2
L(ρ−ρc)
γLγ
hηγxi1+
L−1
L hη
γ
xi21 . (14)
The first contribution is due to the condensate, and the second is a bulk contribution determined by expectations w.r.t. the truncated critical distribution ¯ν1, and we
omitted lower order terms involving the parameter d. Note that hηγ
xi1 = ∞, but
in the phase separated state bulk occupation numbers are bounded by the condensate size of order (ρ−ρc)L, and the truncated moment is therefore alsohηxγi1≤(ρ−ρc)L.
Thus
jL,N '2(ρ−ρc)γ+1Lγ+ const. L2 , (15)
which diverges asL→ ∞, and sinceγ >2 the current is dominated by the condensed phase. The different behaviour for the fundamental diagrams of zero-range and explosive condensation models is illustrated in Figure2.
L=258
L=1026
L=514
jgc
jHΡL=¥forΡ³Ρc
Ρc
0.0 0.5 1.0 1.5 2.0
0.001 1 1000 106 109 1012
Ρ jL,N
L=258
L=1026
L=514
jgc
jHΡL=1 forΡ>Ρc
Ρc
0.2 0.4 0.6 0.8 1.0 1.2 1.4 0.85
0.90 0.95 1.00 1.05 1.10
[image:9.595.110.465.75.205.2]Ρ jL,N
Figure 2. Canonical currentjL,N (11) as a function of densityρ=N/L for
different system sizesL(full coloured lines) for the explosive condensation model withd= 1 andγ= 5 (left) and for a zero-range process with ratesg(n) = 1 +b/n withb= 4 (right), resulting from exact recursions in the canonical ensemble (see e.g. [40]). It is approximated by the grand-canonical currentjgc(13) forρ < ρc
(full black line) and by (15) for supercritical densities in the explosive model (dashed lines). The finite-size corrections in zero-range processes are also given by the current in the condensed phase as explained in the text. Note that both plots have very different scales.
decreases with the system size L. This has been established in [13] for totally asymmetric dynamics for all γ > 2. While there is no a-priori reason to expect mean field theory to be relevant to dynamics on a one-dimensional lattice, it is interesting to remark that the explosive condensation regime,γ >2, corresponds with the instantaneous gelation regime at mean-field level. In the following we investigate this phenomenon for symmetric mass transport dynamics.
3. Main results on condensation dynamics
In contrast to the totally asymmetric system, which exhibits explosive condensation for all γ >2, the symmetric model only shows explosion for γ >3 and the time to stationarity diverges forγ∈(2,3). In the latter regime the approach to stationarity is dominated by a cluster coarsening dynamics similar to inculsion processes [33, 34]. The main difference between the two scenarios is whether the largest cluster is able to reach a critical sizemc which has to scale sublinearly with the system size L, as
is discussed in the next subsection. Once it exceeds that size, it will move across the lattice in a time vanishing with system size, and the model exhibits explosion. Both cases can be distinguished by a very different scaling of the expected time to stationarityhTSSi. This can be defined as
TSS := inft >0 : max
x∈Ληx(t)≥(ρ−ρc)L , (16)
i.e. the time for the process to reach a fully condensed configuration with a condensate of size (ρ−ρc)L.
3.1. Nucleation and critical cluster size
The role of the initial conditions is not crucial for our result, as long as they are homogeneous. We use two such conditions, for the first one we simply place all
••
• •
• • • • • • • • • • • • • •
• •
•
m=10,Γ=2.5
• m=20,Γ=2.5
m=20,Γ=5
0.0 0.2 0.4 0.6 0.8 1.0
0.00 0.05 0.10 0.15 0.20 0.25
Η1m Π2
,m
@
Η1
,m
-Η1
D
1600 1650 1700 1750 1800 1850 1900 19500 10
20
x
η
[image:10.595.111.452.94.208.2]x
Figure 3. Amplification of fluctuations through local dynamics. Left: the
bimodality of the two-site distribution (17) increases with occupation numbersm and the parameterγ(d= 1). This leads to rough configurations with increasing fluctuations as shown on the right forγ= 7 (d= 1,ρ= 2,L= 2048) at a very early time 3.56×10⁻⁷, just before one of the clusters starts dominating.
logL. We also confirmed our results numerically for deterministic initial conditions where each site contains exactly ρ particles for integer densities. This has no fluctuations and naturally leads to slower dynamics than the first choice. But also in this case the fluctuations in the dynamics lead to clusters of size logLwithin arbitrarily small time intervals, since the dynamics is driven byLindependent Poisson processes. The resulting equilibration dynamics for both initial conditions shows the same scaling and only differs in prefactors.
The initial fluctuations in occupation numbers are amplified by the local dynamics and lead to the nucleation of larger clusters. Consider a two-site system with rates (1) and a total ofmparticles, whereη2=m−η1. With (9) the stationary distribution is
given by
π2,m[η1, m−η1] =
w(η1)w(m−η1)
Z2,m
. (17)
Since the weights w have a power-law tail, the distribution is bimodal with the boundaries dominating more and more with increasingm and increasing parameter
γ as shown in Figure 3. So the mass between any two neighbouring sites tends to concentrate in one of them, which leads to rough configurations and the formation of clusters as dynamically stable objects.
These clusters then perform fluctuation activated motion, where a cluster at site
xjumps to a neighbouring site y=x±1 with rate
D(m) =mγ(d+hηγyi)/m∼mγ−1. (18)
Here we have used that the environment outside the cluster is not yet stationary, so hηyγi=O(1) depending only on the particle density. So the cluster loses a particle at
rate O(mγ), and the factor 1/m is the probability that the remaining particles will
others follow within the same time scale. Omitting terms involving the parameterd, we have to leading order for the corresponding time scale
m−1
X
k=1
1
kγ(m−k)γ ∼m
1−2γZ 1/2
1/m
x−γdx
∼m−γ
m1−γ , (19)
which justifies (18).
Sinceγ >2 jump rates of clusters increase super-linearly in their size, and through their symmetric motion clusters gain mass at rate D(m)/m=mγ−2. Therefore the
time it takes to grow to a sizemL logLwhich is larger than the initial fluctuations,
is proportional to
Z mL
logL
m2−γdm=m
3−γ
L −(logL)3−γ
3−γ ∼
( m3−γ L
3−γ , γ ∈(2,3) (logL)3−γ
γ−3 , γ >3
.(20)
This vanishes asγ >3 and the time to grow a cluster of any size is in fact dominated by the maximal initial size logL. Forγ ∈(2,3) the time diverges depending on the final size of the cluster mL, and for macroscopic clusters of size O(L) it scales like
L3−γ.
In this context, we define the critical cluster sizemc as
L2/D(m
c) =L2/mγc−1∼1 ⇒ mc ∼L2/(γ−1). (21)
By definition, if m mc the cluster visits all L sites of the lattice instantaneously,
i.e. in a timeo(1) asL→ ∞. Together with (20) the system then exhibits explosive condensation, where equilibration is dominated by the fast motion of a single largest cluster. This is only possible if
mcL ⇔ γ >3, (22)
whereas for γ ∈ (2,3) we have mc L and the system cannot exhibit explosion.
We discuss both cases in detail below. Note that the nucleation of clusters we just discussed is dominated by purely local dynamics, the clusters then start to interact globally leading to equilibration of the system.
3.2. Coarsening dynamics forγ∈(2,3)
Ifγ <3 the critical cluster sizemc L (21) cannot be reached, and instead several
clusters of macroscopic size m = O(L) nucleate from the initial condition within a diverging time of orderL3−γ. The system reaches a phase separated state where the
condensed phase is split in several isolated clusters, which move across the lattice and exchange mass in the global part of the dynamics. In this case equilibration is therefore dominated by a coarsening process of clusters similar to inclusion processes. We analyze this in a mean field approach close to the methods in [34], where we denote by m(t) the average cluster size and by n(t) the number of clusters at timet, such that by conservation of mass
m(t)n(t) = (ρ−ρc)L . (23)
Since the background in the phase separated state is stationary, we have to use the truncationhηyγi1≤min analogy with (15), to get for the jump rate of a cluster
102 103 104 100
101 102
L
h
TS
S
i
γ= 2.5,ρ= 4, d= 0.01
γ= 2.75,ρ= 4, d= 0.01 TSS =kLb, k= 5.75, b= 0.5
TSS =kLb, k= 6.75, b= 0.25
102 103 104
10−1 100 101 102
L
h
TS
S
i
(d)
γ= 2.5,ρ= 4, d= 0.1
γ= 2.75,ρ= 4, d= 0.1 TSS =kLb, k= 0.5, b= 0.5
[image:12.595.106.462.90.215.2]TSS =kLb, k= 0.8, b= 0.25
Figure 4. The expected time to stationarityhTSSi(16) forγ∈(2,3) increases
with the system size, shown for different values ofγandd. The predicted scaling law (30) with fitted constants is denoted by dashed lines, data are averaged over 100 realizations.
Note that this is larger than in the nucleation regime (18) due to enhanced fluctuations of the bulk. The average distance between clusters is
s(t) =L/n(t) =m(t)/(ρ−ρc), (25)
so they meet at a rate proportional to
D(m(t))/s(t)2=mγ−2(ρ−ρc)2. (26)
Since the dynamics is symmetric, when two clusters of size m1 and m2 meet they
merge with probability proportional to 1/(m1+m2), in analogy with results for the
inclusion process [33,34]. The clusters start exchanging particles as soon as they are separated by only one site, and the occupation number of this intermediate site is a symmetric random walk in continuous time on the state space {0, . . . , m1+m2}.
If the clusters do not merge they still exchange a certain number of particles, which happens more frequently and leads to a mass exchange on the same order as merge events. This is explained in detail in [34] for inclusion processes which correspond to
γ= 1, and applies similarly in the model studied here. If two clusters merge, the average size increases by
∆m(t) = (ρ−ρc)L
n(t)−1 −
(ρ−ρc)L
n(t) =
m(t)
n(t)−1 ∼m(t). (27)
Putting (26), (27) and the merge probability of order 1/m(t) together, the change in cluster size is given by
d
dtm(t) = const. m(t)
γ−2 . (28)
The solution with initial conditionm(0)∼Lis given by
m(t) =C(ρ−ρc) (t+t0)1/(3−γ) with t0=
m(0)3−γ
C(ρ−ρc)
. (29)
We pull out a factor (ρ−ρc) from the multiplicative constant since simulations support
the intuition thatn(t) is independent of the density, andm(t) scales asρ−ρc.
From the scaling law (29) it follows that the time to reach the stationary value (ρ−ρc)L during coarsening scales like L3−γ. This is of the same order as the time
101 102
102
t
σ
2(t
)
L= 16
L= 32
L= 64
L= 128
L= 256
L= 512
L= 1024
L= 2048
C(t+t0)(1/(3−γ))
101 102
102
t
σ
2(t
)
L= 16
L= 32
L= 64
L= 128
L= 256
L= 512
[image:13.595.124.434.110.295.2]C(t+t0)(1/(3−γ))
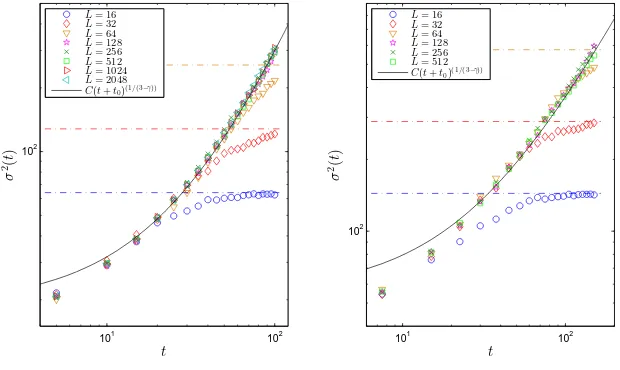
Figure 5. The second momentσ2(t) increases asymptotically as a power law predicted in (32) given by a full line, before it saturates at the stationary value (ρ−ρc)2Lindicated by dashed lines. Parameter values areγ= 2.5,d= 0.1,ρ= 2
(left), andγ= 2.25,d= 0.01,ρ= 3 (right). Data points are averaged over 100 realizations and errors are comparable to the size of the symbols. Fit constants are t0 = 33.6, C = 0.0168 (left) andt0 = 31.9 andC = 0.545(right), whereC includes the factor (ρ−ρc)2in (32).
well separated in this model (cf. Figure1), in contrast to previous results for inclusion processes where separation results from the scaling of the system parameterd[33,34]. In total, the time to stationarity scales like
hTSSi ∼L3−γ → ∞ forγ∈(2,3), (30)
which is confirmed by simulation data presented in Figure4.
To compare the scaling law (29) to numerical data, we use the second moment as an observable which is numerically better accessible than the mean cluster size. In a phase separated state withn(t) clusters of typical sizem(t) this is given by
σ2(t) :=D1
L X
x
ηx2(t)
E
= L−n(t)
L hη
2
xi1+n(t)
L m
2(t). (31)
Again,hη2
xi1=∞for the critical product distribution with γ ∈(2,3), but using the
truncation by m =O(L) we see that this term is of order L3−γ L. So the bulk
contribution can be neglected for largeL, and with (23) we get
σ2(t) = (ρ−ρc)m(t) =C(ρ−ρc)2(t+t0)1/(3−γ). (32)
This is plotted in Figure 5 and shows good agreement with simulation data in a coarsening window, before it saturates at its stationary value (ρ−ρc)2L.
3.3. Explosive condensation forγ >3
Forγ > 3 the critical cluster sizemc ∼L2/(γ−1) (21) scales sublinearly with L and
102 104 10−4
L hTS
S
i
102 103 104 105 10−4
L
h
TS
S
i
102 104 10−6
L
h
TS
S
i
102 103 104 105 10−6
L
h
TS
S
[image:14.595.104.463.81.260.2]i
Figure 6. The expected time to stationarityhTSSi(16) forγ >3 decreases with
the system size, shown forρ= 2 and different valuesγ= 5,d= 0.1 and 1 (left), and γ= 7,d= 0.1 and 1 (right). The predicted scaling law (33) with a fitted constant is shown by blue dashed lines, data are averaged over 200 realizations and errors are of the size of the symbols.
in (20). From then on the largest cluster dominates the dynamics, visits all sites of the lattice and grows to a condensate containing all excess mass in a time vanishing with the system sizeL. As the speed of the clusters increases with increasing size, the time to stationarity is dominated by the nucleation time scale and we expect
hTSSi ∼(logL)3−γ →0 forγ >3. (33)
This is plotted in Figure6 and shows good agreement with simulation data.
The time evolution of the average cluster size in this regime is dominated by the largest cluster, which gains mass at rateD(m)/mas explained above. Since the bulk is still non-stationary we can use (18) for the cluster jump rate, and this leads to
d
dtm(t) = const. m(t)
γ−2 . (34)
This turns out to coincide with (28) for γ < 3, even though the dynamics in both regimes look very different. Forγ >3 the right-hand side grows super-linearly in m
which leads to a finite-time blowup of the solution,
m(t) =C(ρ−ρc) (tbu−t)−1/(γ−3) with tbu=
m(0)3−γ
C(ρ−ρc)
. (35)
The blow-up timetbu is determined by the initial conditionm(0), and since m(0)∼
logLwe see that
tbu∼(logL)3−γ →0 asL→ ∞. (36)
This is consistent with explosive condensation and the scaling ofhTSSiin (33). Using
again the connection σ2(t) = (ρ−ρ
c)m(t) analogous to (32), we confirm (35) by
comparison with numerical data in Figure7.
The explosive dynamics in this regime is completely analogous to the totally asymmetric case studied in [13]. Our derivation of the scaling ofhTSSican be directly
−0.005 0 0.005 0.01 0.015 0.02 0.025 0.03 0.035 0.04 0
20 40 60 80 100 120 140 160
t
σ
2(t
)
L= 32
L= 64
L= 128
L= 256
L= 512
a(tbu−t)-1/(γ−3)
tbu= 0.01866
σ2
∞for L = 32
10−4 10−3 10−2
101
102
tbu−t
σ
2(t
bu
−
t
)
[image:15.595.101.463.105.316.2]L = 32 L = 64 L = 128 L = 256 L = 512
Figure 7. The second momentσ2(t) follows the prediction from (35) indicated by a full gold line forL= 512 with corresponding fitted blow up time given by a dash dotted line (left). It saturates at the stationary value (ρ−ρc)2Lindicated
by a dashed red line forL= 32. Plotting against (tbu−t) in double-log scale
confirms the functional behaviour following from (35) indicated by straight lines (right). Parameter values areγ= 5,ρ= 2 andd= 0.1. Data points are averaged according to (37) over 50 realizations and errors are of the size of the symbols.
Note that in contrast to the caseγ <3, the nucleation and explosive condensation regime are well separated, and a transition occurs when the largest cluster reaches the critical size mc, as can also be seen in Figure 1. Since the nucleation regime
is dominated by local dynamics, the time to reachmc is random and as discussed in
Section3.1is basically determined by a maximum ofLPoisson random variables. The fluctuations of the latter are on the same scale logL as the expectation, leading to persistent randomness even with increasing system sizeL. Oncemc is reached and the
explosion mechanism takes over, relevant observablesσ2(t) and the size of the largest
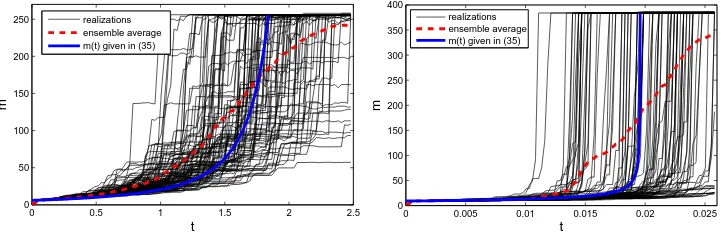
clusterm(t) follow an almost deterministic trajectory with very small fluctuations (see Figure8). Variations in system trajectories therefore result from a random time shift corresponding to completion of the nucleation regime, and after that typical individual trajectories L1 P
xηx(t)2 follow (35) wheretbu is replaced by a random time (see blue
curve in Figure8). This implies that the typical behaviour is very different from the ensemble averageσ2(t) (red dashed curve in Figure8). Instead of averaging at fixed
timest, it is thus more informative to average the time it takes different trajectories to reach a levelσ2 of the second moment, i.e.
t(σ2) :=Dinf
s >0 : 1
L X
x
ηx(t)2≥σ2
E
. (37)
0 0.5 1 1.5 2 2.5 0
50 100 150 200 250
t
m
realizations ensemble average m(t) given in (35)
0 0.005 0.01 0.015 0.02 0.025
0 50 100 150 200 250 300 350 400
t
m
[image:16.595.98.460.101.224.2]realizations ensemble average m(t) given in (35)
Figure 8. Individual trajectories for the largest cluster size shown in black compare well with the prediction (35) shown as a thick blue curve, modulo a random time shift. The usual ensemble average (dashed red curve) does not coincide with the typical behaviour, and representative averages of these dynamics are therefore given by (37), which is used in Figure 7. Parameter values are L= 128,d= 0.1, andγ= 3.5,ρ= 2 (left), andγ= 5,ρ= 3 (right). For larger γ, fluctuations of individual trajectories get smaller.
This behaviour is in contrast to the case γ < 3, where typical trajectories fluctuate around the mean with fluctuations decreasing with the system size, due to self-averaging effects arising from global coarsening dynamics. This results in a decreasing error withLin Figure 4, whereas it is largely independent ofL in Figure
6.
3.4. The boundary caseγ= 3
For the boundary case γ = 3 in one dimension, our results (28) and (34) predict a linear equation
d
dtm(t) = const. m(t), (38)
with an exponential solution for the growth of the mean cluster size. Analogously, this leads to the prediction for the second moment
σ2(t) =C1eC2t with constantsC1, C2>0. (39)
It reaches the stationary value (ρ−ρc)2Lin a time of order logL, which is the expected
scaling of hTSSiin this case. This behaviour is confirmed in Figure9 for the system
with the rates (3) originally studied in [13], confirming that our analysis does not depend on the detailed functional form of the rates but only on their asymptotic behaviour.
4. Summary and discussion
0 50 100 150 200 250 300 350 102
103
t
σ
2(t
)
L= 16 L= 32 L= 64
L= 128
L= 256
L= 512
L= 1024
σ2(t) =C1e(C2t)
101 102 103 104
50 100 150 200 250 300 350 400 450 500
L
h
TS
S
[image:17.595.105.459.111.302.2]i
Figure 9. The second momentσ2(t) increases asymptotically exponentially with time as predicted in (39) given by a full line, before it saturates at the stationary value (ρ−ρc)2Lindicated by dashed lines (left). Parameter values
are γ= 3, d= 0.1, ρ= 2, using the rates (3), and fit constants areC1 = 25, C2= 0.018. This leads to a logarithmic increase forhTSSias shown on the right,
which fits well the prediction log(ρ−ρc)2
C1 +
1
C2logLgiven by a full line. Data
points are averaged over 100 realizations and errors are comparable to the size of the symbols unless indicated.
• Initialization: due to fluctuations in the initial conditions or the dynamics at a very early stage, the largest occupation numbers in the system scale as logLwith the system sizeL.
• Nucleation: amplification of these initial fluctuations by local dynamics leads to large clusters of the critical system sizemc∼L2/(γ−1)(21) within a time of order
(logL)3−γ (20) for γ >3. For γ
∈ (2,3) macroscopic clusters of sizeO(L) are established in a time of orderL3−γ (20).
The remaining time evolution is then governed by two distinct global dynamics:
• Coarsening for γ ∈ (2,3): macroscopic clusters move across the lattice and exchange particles or merge on a time scale L3−γ which overlaps with the
nucleation regime, leading tohTSSi ∼L3−γ (30).
• Explosive condensation forγ >3: a single cluster dominates the process, covering the lattice in vanishing time and growing to a single condensate in an almost deterministic fashion. This is clearly separated from and much faster than the nucleation regime, which dominates the time scalehTSSi ∼(logL)3−γ (33).
mixing to break spatial correlations. It is clear that symmetric transport will mix more slowly than asymmetric transport. Our analysis suggests that this difference makes possible the existence of the window 2 < γ < 3 in which spatial correlations in the coarsening process in one dimension remain sufficiently strong to prevent the explosive behaviour present at mean-field level.
Our theoretical arguments are slightly different from previous work on asymmetric systems [13, 32], but can be directly adapted to the that situation, which leads to simpler explanations of the explosive condensation regime. Our results imply that asymmetry of the dynamics is in fact not necessary for explosive condensation, and that the phenomenon is simply caused by strong enough non-linearity of the jump rates. Our arguments can also be directly generalized to higher dimensions. It is known that the expected number of steps for a symmetric random walk to visit all sites of ad-dimensional lattice with side lengthLscales like the volumeLd ford≥2,
with logarthmic corrections ford= 2 and 3. With (21), the critical cluster size then scales like
mc∼Ld/(γ−1)Ld ford≥2 andγ >2 . (40)
Therefore, we expect explosive condensation for symmetric systems in higher dimensions for all values of γ > 2, resulting from the scaling of cover times for symmetric random walks being similar to asymmetric ones. The non-explosive behaviour forγ ∈(2,3) in one dimension is in fact a special case resulting from the
L2scaling of cover times and recurrence of random walks. The transient behaviour of
higher dimensional random walks also implies that clusters gain mass at an increased rate D(m) =mγ−1, which leads to a vanishing nucleation time of order (logL)2−γ
for all γ >2 as a correction to (20). This is then the expected scaling for hTSSiin
all higher dimensions. Numerical data of the quality to test predicted scaling laws in higher dimensions are hard to obtain and beyond the scope of this paper. The spatial partp(x, y) does not have to be nearest neighbour, our results apply directly as long as it is irreducible and spatially homogeneous. A further interesting question in this context is the role of inhomogeneities, and in particular whether the model could be non-explosive on (random) graphs which have bottlenecks and large cover times for random walks.
In general, the simulation of particle systems with non-linearly increasing jump rates is computationally very demanding. Rejection based algorithms such as random sequential update are highly inefficient, and the only option is Gillespie’s algorithm which generates the sample path of general continuous-time Markov chains [41]. A single step of a macroscopic cluster requires of order L2 individual transitions
Acknowledgements
C.C. and S.G. acknowledge support by the Engineering and Physical Sciences Research Council (EPSRC), Grant Nos. EP/I014799/1 and EP/I01358X/1.
References
[1] P L Krapivsky, S Redner, and E Ben-Naim. A Kinetic View of Statistical Physics. Cambridge University Press, Cambridge, 2010.
[2] J M Ball, J Carr, and O Penrose. The Becker-Dring cluster equations: Basic properties and asymptotic behaviour of solutions. Comm. Math. Phys., 104(4):657–692, 1986.
[3] F Leyvraz. Scaling theory and exactly solved models in the kinetics of irreversible aggregation.
Phys. Reports, 383(2):95–212, 2003.
[4] E Ben-Naim and P L Krapivsky. Exchange-driven growth. Phys. Rev. E, 68:031104, 2003. [5] D J Aldous. Deterministic and Stochastic Models for Coalescence (Aggregation and
Coagulation): A Review of the Mean-Field Theory for Probabilists. Bernoulli, 5(1):3–48, 1999.
[6] A A Lushnikov. Exact kinetics of the sol-gel transition. Phys. Rev. E, 71(4):046129, 2005. [7] J L Spouge. Monte carlo results for random coagulation. J. Colloid Interface Sci., 107(1):38 –
43, 1985.
[8] P G J van Dongen. On the possible occurence of instantaneous gelation in Smoluchowski’s coagulation equation. J. Phys. A: Math. Gen., 20:1889–1904, 1987.
[9] I Jeon. Spouge’s Conjecture on Complete and Instantaneous Gelation. J. Stat. Phys., 96(5):1049–1070, 1999.
[10] N V Brilliantov and P L Krapivsky. Nonscaling and source-induced scaling behaviour in aggregation model of movable monomers and immovable clusters. J. Phys. A: Math. Gen., 24:4789–4803, 1991.
[11] J R King and J A D Wattis. Asymptotic solutions of the BeckerDring equations with size-dependent rate constants. J. Phys. A: Math.Gen., 35(6):1357, 2002.
[12] R C Ball, C Connaughton, T H M Stein, and O Zaboronski. Instantaneous gelation in Smoluchowski’s coagulation equation revisited. Phys. Rev. E, 84(1):011111, 2011.
[13] B Waclaw and M R Evans. Explosive Condensation in a Mass Transport Model. Phys. Rev.
Lett., 108(7):070601, 2012.
[14] C Cocozza-Thivent. Processus des misanthropes. Z. Wahrscheinlichkeitstheorie Verw. Geb., 70(4):509–523, 1985.
[15] M R Evans, Satya N Majumdar, and R K P Zia. Factorized steady states in mass transport models. J. Phys. A: Math. Gen., 37(25):L275, 2004.
[16] J-M Drouffe, C Godr`eche, and F Camia. A simple stochastic model for the dynamics of condensation. J. Phys. A: Math. Gen., 31(1):L19–L25, 1998.
[17] M R Evans. Phase Transitions in one-dimensional nonequilibrium systems. Braz. J. Phys., 30(1):42–57, 2000.
[18] C Godr`eche. Dynamics of condensation in zero-range processes. J. Phys. A: Math. Gen., 36(23):6313–6328, 2003.
[19] S Grosskinsky, G M Sch¨utz, and H Spohn. Condensation in the zero range process: stationary and dynamical properties. J. Stat. Phys., 113(3-4):389–410, 2003.
[20] C Godr`eche and J M Luck. Dynamics of the condensate in zero-range processes. J. Phys. A:
Math. Gen., 38(33):7215–7237, 2005.
[21] M R Evans and T Hanney. Nonequilibrium statistical mechanics of the zero-range process and related models. J. Phys. A: Math. Gen., 38(19):R195–R240, 2005.
[22] C Godr`eche and J M Luck. Nonequilibrium dynamics of the zeta urn model. Eur. Phys. J. B, 23:473–486, 2001.
[23] C Godr`eche. From Urn Models to Zero-Range Processes: Statics and Dynamics. Lect. Notes
Phys., 716:261–294, 2007.
[24] C Godr`eche and J M Luck. Condensation in the inhomogeneous zero-range process: an interplay between interaction and diffusion disorder. J. Stat. Mech, 2012(12):P12013, 2012.
[25] I Jeon, P March, and B Pittel. Size of the largest cluster under zero-range invariant measures.
Ann. Probab., 28(3):1162–1194, 2000.
[27] J Beltr´an and C Landim. Metastability of reversible condensed zero range processes on a finite
set. Probab. Theory Related Fields, 152(3-4):781–807, 2011.
[28] I Armend´ariz, S Grosskinsky, and M Loulakis. Metastability in a condensing zero-range process in the thermodynamic limit. arXiv:1507.03797, 2015.
[29] J. Beltr´an, M. Jara, and C. Landim. A martingale problem for an absorbed diffusion: the nucleation phase of condensing zero range processes. arXiv:1505.00980, 2015.
[30] G M Sch¨utz and R J Harris. Hydrodynamics of the zero-range process in the condensation regime. J. Stat. Phys, 127(2):419–430, 2007.
[31] P Chleboun and S Grosskinsky. Condensation in Stochastic Particle Systems with Stationary Product Measures. J. Stat. Phys., 154(1-2):432–465, 2014.
[32] M R Evans and B Waclaw. Condensation in stochastic mass transport models: beyond the zero-range process. J. Phys. A: Math. Theor., 47(9):095001, 2014.
[33] S Grosskinsky, F Redig, and K Vafayi. Dynamics of condensation in the symmetric inclusion process. Electron. J. Probab., 18(0), 2013.
[34] J Cao, P Chleboun, and S Grosskinsky. Dynamics of condensation in the totally asymmetric inclusion process. J. Stat. Phys., 155(3):523–543, 2014.
[35] C Giardin`a, J Kurchan, and F Redig. Duality and exact correlations for a model of heat conduction. J. Math. Phys., 48(3):033301–033315, 2007.
[36] S Grosskinsky, F Redig, and K Vafayi. Condensation in the inclusion process and related models.
J. Stat. Phys, 142(5):952–974, 2011.
[37] C Giardin`a, J Kurchan, F Redig, and K Vafayi. Duality and Hidden Symmetries in Interacting Particle Systems. J. Stat. Phys., 135(1):25–55, 2009.
[38] P A P Moran. The statistical processes of evolutionary theory. Clarendon Press; Oxford University Press., 1962.
[39] I Armend´ariz, S Grosskinsky, and M Loulakis. Zero Range Condensation at Criticality. Stoch.
Proc. Appl., 123(9):3466–3496, 2013.
[40] P Chleboun and S Grosskinsky. Finite size effects and metastability in zero-range condensation.
J. Stat. Phys., 140(5):846–872, 2010.
[41] D T Gillespie. A general method for numerically simulating the stochastic time evolution of coupled chemical reactions. J. Comp. Phys., 22(4):403434, 1976.