A Thesis Submitted for the Degree of PhD at the University of Warwick
Permanent WRAP URL:
http://wrap.warwick.ac.uk/103509
Copyright and reuse:
This thesis is made available online and is protected by original copyright.
Please scroll down to view the document itself.
Please refer to the repository record for this item for information to help you to cite it.
Our policy information is available from the repository home page.
Nanodiamonds in levitated optomechanics
by
Angelo Christopher Frangeskou
Thesis
Submitted to the University of Warwick
for the degree of
Doctor of Philosophy
Department of Physics
Contents
List of Figures v
List of Tables viii
Acknowledgments ix
Declarations x
Abstract xii
Chapter 1 Introduction 1
1.1 There’s plenty of room in the middle . . . 1
1.2 Motivation for study . . . 2
1.3 Thesis structure . . . 7
Chapter 2 Theory of optical dipole traps 8 2.1 Introduction . . . 8
2.2 Optical forces . . . 10
2.2.1 Trap sti↵ness . . . 12
2.2.2 Optical potential . . . 14
2.2.3 Equilibrium trapping position . . . 14
2.4.1 Non-equilibrium thermodynamics and internal temperature . 22
Chapter 3 Electron paramagnetic resonance 24
3.1 Magnetic interactions . . . 24
3.1.1 The electronic Zeeman interaction . . . 25
3.1.2 The nuclear Zeeman interaction . . . 26
3.1.3 The hyperfine interaction . . . 26
3.1.4 Zero-field splitting . . . 28
3.1.5 The nuclear quadrupole interaction . . . 30
3.2 Resonant excitation by electromagnetic fields . . . 30
3.2.1 Resonance . . . 30
3.2.2 The rotating frame . . . 32
3.2.3 Pulsed EPR . . . 32
3.2.4 Common EPR experiments and pulse sequences . . . 33
3.3 Experimental EPR . . . 35
Chapter 4 Defects in diamond and the nitrogen-vacancy centre 37 4.1 Introduction . . . 37
4.2 Synthesis of diamond . . . 38
4.2.1 HPHT synthesis . . . 39
4.2.2 Chemical vapour deposition . . . 40
4.3 Defects in diamond . . . 40
4.3.1 Single substitutional nitrogen . . . 42
4.4 The nitrogen-vacancy centre . . . 43
4.4.1 Discovery and identification . . . 43
4.4.2 Optical and spin dynamics . . . 45
4.4.3 Optical readout . . . 47
Chapter 5 Nitrogen vacancy centres under 1550 nm illumination 50
5.1 Introduction . . . 50
5.2 Methods . . . 51
5.2.1 Confocal microscopy . . . 51
5.2.2 Optically detected magnetic resonance . . . 55
5.2.3 Sample preparation . . . 58
5.3 Results . . . 58
5.3.1 Optical e↵ects of 1550 nm illumination . . . 58
5.3.2 Impact of 1550 nm illumination on the electron spin . . . 61
5.4 Conclusion . . . 64
Chapter 6 Fabrication and characterisation of CVD derived nanodi-amonds containing nitrogen vacancy centres 67 6.1 Introduction . . . 67
6.2 Quantitative electron paramagnetic resonance . . . 69
6.3 Fabrication process . . . 71
6.4 Raman spectroscopy . . . 72
6.5 Energy dispersive X-ray spectroscopy . . . 73
6.6 Confocal microscopy . . . 75
6.7 Conclusion . . . 77
Chapter 7 Optical trapping of CVD derived nanodiamonds in vac-uum 78 7.1 Introduction . . . 78
7.2 Methods . . . 80
7.2.1 Optical dipole trap . . . 81
7.2.2 Interferometric position detection . . . 83
7.2.5 Fluorescence detection . . . 87
7.3 Results . . . 89
7.3.1 Centre-of-mass measurements . . . 89
7.3.2 Loss pressures . . . 93
7.3.3 Simulation of temperatures in high vacuum . . . 94
7.3.4 Degradation . . . 98
7.4 Conclusion . . . 99
7.4.1 Future outlook . . . 100
Chapter 8 Conclusion 103 8.1 Summary of research findings . . . 103
8.2 Concluding remarks . . . 105
List of Figures
1.1 Photograph of a levitated nanodiamond. . . 3
1.2 Schematic of a spin-optomechanical matter-wave experiment . . . 4
2.1 Cartoon of optical forces in a dipole trap . . . 12
2.2 Simulation of trap depth as a function of nanoparticle radius and optical power . . . 15
2.3 Simulated power spectral densities at di↵erent pressures . . . 20
2.4 Simulated power spectral densities at di↵erent centre-of-mass temeper-atures . . . 22
3.1 The rotating frame of reference . . . 31
3.2 Hahn echo sequence . . . 34
3.3 Schematic of an EPR spectrometer . . . 35
4.1 Carbon phase diagram . . . 38
4.2 Schematic representation of di↵erent types of lattice point defects . . 41
4.3 NV energy level diagram . . . 45
4.4 Time-resolved fluorescence intensity of the NV centre . . . 47
4.5 Configuration diagram . . . 48
5.3 Confocal micrograph showing single NV centres . . . 53
5.4 Schematic of the microwave bridge for single spin control. . . 55
5.5 Coplanar waveguide for single spin control . . . 56
5.6 Photograph of external magnets and stage area . . . 57
5.7 Psat curves with and without 1550 nm illumination. . . 59
5.8 g(2)(⌧) measurements with and without 1550 nm illumination. . . 60
5.9 Fluorescence intensity as a function of 1550 nm power. . . 60
5.10 Impact of 1550 nm illumination on bright nanodiamonds. . . 62
5.11 ODMR spectra with and without 1550 nm illumination. . . 62
5.12 Rabi oscillations with and without 1550 nm illumination. . . 63
5.13 T2 measurements with and without 1550 nm illumination. . . 64
6.1 Rapid passage EPR spectra of CVD parent material . . . 70
6.2 Confocal micrograph showing the e↵ect of step-flow growth . . . 72
6.3 Raman spectrum of milled CVD diamond . . . 72
6.4 Scanning electron micrograph of CVD derived nanodiamonds . . . . 73
6.5 STEM image and energy dispersive X-ray spectra of CVD derived nanodiamonds . . . 74
6.6 g2(⌧) measurement of a CVD derived nanodiamond. . . . 76
6.7 Continuous-wave ODMR spectra of single NV centres in CVD derived nanodiamonds . . . 76
7.1 Schematic of the optical dipole trap . . . 81
7.2 Photograph of the trapping chamber . . . 83
7.3 Time trace and spectral density of a levitated nanodiamond at 4 mbar 84 7.4 Measurement of errors . . . 85
7.5 Image of a trapped nanoparticle . . . 87
7.6 Ensemble NV fluorescence from a levitated nanodiamond . . . 88
7.8 A = 2C2k
BTcm/m for all nanodiamonds as a function of trapping
power . . . 90
7.9 Power spectral densities of ND4 . . . 90
7.10 !0 as a function of p P . . . 91
7.11 ND4 centre-of-mass temperatures . . . 91
7.12 Internal temperature of ND3 . . . 93
7.13 Histogram of loss pressures . . . 94
7.14 Simulation of temperatures of various diamonds and silica in a dipole trap . . . 96
7.15 Alternative simulation of temperatures of various diamonds and silica in a dipole trap . . . 98
List of Tables
4.1 Survey of the mechanical and optical properties of diamond . . . 38
4.2 Properties of synthetic type 1b and IIa diamonds . . . 39
5.1 NV centreT2 times with and without 250 mW 1550 nm illumination. 64
6.1 N0s concentrations determined by EPR . . . 71
6.2 Optical lifetimes of single NV centres in CVD derived
nanodia-monds. Lifetimes are determined from fits of the photon
autocor-relation function using equation 5.1. . . 77
Acknowledgments
I would first like to thank Gavin Morley for his supervision. Gavin has gone above and beyond his remit as a supervisor to aid my personal development. I would also like to thank him for bravely a↵ording me a great deal of freedom within the laboratory and entrusting me to carry out the project. It has made working in the lab over the last four years fun and fulfilling. I would also like to thank Peter Barker for his co-supervision of this work. Peter has been generous with his time and his insight. The times I spent in his labs at UCL were invaluable. Mark Newton has also contributed much of his knowledge and expertise to the project and I would also like to thank him.
It was a pleasure working with Anis Rahman for the middle two years of this PhD, designing, building, and re-building the dipole trap together. Anis taught me almost everything I know about working with optics, and much more. He has been a great teacher to me, and I cannot express my gratitude enough.
The work carried out at Cardi↵University by Oliver Williams, Soumen Man-dal, and Laia Gines was essential to this project. The diamonds they milled and purified form the basis of a significant proportion of my results, and for that I am incredibly grateful. Thank you to Fedor Jelezko and the Institute of Quantum Op-tics at Universit¨at Ulm, who hosted me for one month in 2015. The knowledge they passed on allowed us to build a confocal microscope upon my return. Building it with Ben Green and Phil was one of the most enjoyable periods of my PhD.
My fellow group members Anton, Maik, Colin, and Guy have all made im-portant contributions to my time at Warwick. I was also fortunate enough share my time at Warwick with Chris Hartland, Matt, Mika, Ben Breeze, Sinead, Claudio, Enrik, Chris Wedge, and Yasmin. I am greatly indebted to all of these people.
To Andre, Sarah, David, Katie, Fouad, and Krishna, I wouldn’t be doing this if it were not for all of you. Meatings over the years with Dave and Drew have kept me at a healthy weight. I would also like to give a rare thanks to Hus, Luke, Matt, Neil, and Simon for their brotherly friendship.
Declarations
I declare that the work presented in this thesis is my own except where stated otherwise, and was carried out entirely at the University of Warwick, during the period of October 2013 to August 2017, under the supervision of Dr. Gavin Morley and Prof. Peter Barker (University College London). The research reported here has not been submitted, either wholly or in part, in this or any other academic institution for admission to a higher degree. Some parts of the work reported and other work not reported in this thesis have been published, as listed below. It is anticipated that further parts of this work will be submitted for publication in due course.
Published papers
1. A. C. Frangeskou, A. T. M. A. Rahman, L. Gines, S. Mandal, O. A. Williams, P. F. Barker, G. W. Morley, Pure nanodiamonds for levitated optomechanics in vacuum, New Journal of Physics20, 043016 (2018)
2. A. T. M. A. Rahman, A. C. Frangeskou, P. F. Barker, G. W. Morley, An analytical model for the detection of levitated nanoparticles in optomechanics, Review of Scientific Instruments89, 023109 (2018)
3. Y. C. Chen, P. S. Salter, S. Knauer, L. Weng, A. C. Frangeskou, C. J. Stephen, S. N. Ishmael, S. Johnson, B. L. Green, G. W. Morley, M. E. Newton, J. G. Rarity, M. J. Booth, J. M. Smith, Laser writing of coherent colour centres in diamond, Nature Photonics11, 77-80 (2017)
5. A. T. M. A. Rahman, A. C. Frangeskou, M. S. Kim, S. Bose, G. W. Morley, P. F. Barker, Burning and graphitization of optically levitated nanodiamonds in vacuum, Scientific Reports6, 21633 (2016)
Conference presentations
1. A. C. Frangeskou, A. T. M. A. Rahman, L. Gines, S. Mandal, O. A. Williams, P. F. Barker, G. W. Morley, Pure nanodiamonds for levitated optomechan-ics in vacuum, 67th De Beers Diamond Conference, Uni. of Warwick, oral presentation (2017)
2. A. C. Frangeskou, A. T. M. A. Rahman, L. Gines, S. Mandal, O. A. Williams, P. F. Barker, G. W. Morley,Pure nanodiamonds for vacuum levitated optome-chanics, MRS Spring Meeting & Exhibit, Phoenix, Arizona, Symposium ED1 Student Best Poster Award (2017)
3. A. C. Frangeskou, A. T. M. A. Rahman, P. F. Barker, G. W. Morley,Nitrogen vacancy centres in levitated nanodiamonds, iMR CDT Conference, Marwell Hotel, Southampton, oral presentation (2016)
4. A. C. Frangeskou, A. T. M. A. Rahman, P. F. Barker, G. W. Morley,Optical trapping of nanodiamonds, 3rd Institute of Physics, Uni. of Stuttgart, oral presentation (2015)
5. A. C. Frangeskou, A. T. M. A. Rahman, P. F. Barker, G. W. Morley,Nitrogen vacancy centres in levitated nanodiamonds, Quantum Information, Comput-ing, and Control Summer School, Uni. of Warwick (2015)
6. A. C. Frangeskou, A. T. M. A. Rahman, P. F. Barker, G. W. Morley,Nitrogen vacancy centres in levitated nanodiamonds, De Beers Diamond Conference, poster presented annually (2014-16)
Abstract
This thesis reports on research undertaken to explore the viability of using
nanodi-amonds containing nitrogen vacancy (NV) centres in optical dipole traps.
The impact of illuminating single NV centres with 1550 nm, a common dipole
trap wavelength, is investigated. A reduction of 7% in the fluorescence intensity is
observed using 20-30 mW of illumination, whilst the NV centre’s optically detected
magnetic resonance (ODMR) signal contrast and electron spinT2 time remain
un-a↵ected. These results are better than those of similar experiments with 1064 nm.
A method for creating and characterising pure type IIa nanodiamonds
con-taining NV centres is presented. Bulk chemical vapour deposition (CVD) diamonds
are electron irradiated and annealed, before being ball milled into nanodiamonds.
The bulk purity is determined by quantitative electron paramagnetic resonance.
The nanodiamonds are characterised by Raman spectroscopy, electron microscopy
and energy dispersive X-ray spectroscopy (EDX). Small quantities of contamination
by the silicon nitride milling material could be found using EDX. A confocal
micro-scope was constructed and single NV centres inside the nanodiamonds were found
to be photostable and ODMR shows an average ODMR contrast of 9%.
An optical dipole trap was constructed and CVD derived nanodiamonds were
levitated. Measurements of the centre-of-mass motion show that unlike commercial
type 1b nanodiamonds, they mostly remain at or close to thermal equilibrium in
moderate vacuum where commercial material was previously reported to burn and/
or graphitise, even when the optical intensity is raised above 700 GW/m2.
Chapter 1
Introduction
1.1
There’s plenty of room in the middle
In 1959, Richard Feynman delivered a lecture entitled “There’s plenty of room at
the bottom” [1], for which he is, somewhat unfairly, given credit for spawning the
field of nanotechnology. In truth, by 1959 the electron microscope had already long
been invented [2], but through the purview of our time, Feynman’s lecture is seen
as the beginning of a golden age in fundamental and applied nanoscale science.
The ability to construct devices and make observations at the nanoscale,
whilst confirming much of what quantum theory predicted, conflicted with our lived
experience. From the outset this apparent conflict can be naively dismissed in a
binary manner: small things obey the laws of quantum mechanics, and big things
behave classically. Yet quantum theory, despite being the most accurate scientific
theory we have, sets no limits on size, mass, or the number of particles.
Never-theless, to stay with the example of nanotechnology, Wojciech Zurek [3] points out
that Josephson junctions are proof that macroscopic numbers of electrons can
over-come a non-conducting barrier via quantum tunneling [4]. Another example are the
results over the last two decades in mesoscopic physics has been the demonstration
that macromolecules exhibit wave-particle duality [7–10]. This was first discovered
by Arndt et al. in 1999 with a setup similar to Young’s double-slit interferometer
[7]. A collimated molecular beam of neutral C60 fullerenes was passed through a
di↵raction grating and detected 1.25 m behind the grating by a photoionisation
pro-cess. Scanning the detection away from the centre of the molecular beam revealed
clear first-order di↵raction peaks that disappeared when the di↵raction grating was
removed.
These works have provided a motivation for physicists to not just look at ever
smaller dimensions, but to probe the mesoscopic world at the boundary between
quantum (microscopic) and classical (macroscopic) systems.
1.2
Motivation for study
Coherent sensing of a mechanical oscillator using a coupled single electron spin was
proposed in 2009 [11] and demonstrated experimentally in 2012 [12]. The motion of a
magnetised cantilever tip was detected using a defect centre electron spin in diamond
known as the nitrogen vacancy (NV) centre [13]. In these experiments, the classical
motion of the oscillator due to driving and Brownian motion was detected, although
coupling to an electron spin, that is quantum by definition, makes for an interesting
proposition. For example, the authors proposed that if the cantilever is cooled, zero
point fluctuations could be observed. The purpose of this PhD project was to begin
the construction of an experiment that would eventually test whether a ⇡100 nm sized diamond (approximately 109 atoms) could be placed into a spatial quantum
superposition, and detected with an NV centre spin. This question is the subject
of a number of theoretical proposals [14–17]. They propose to exploit a coupling
of a quantum superposition state of the NV electron spin inside a nanodiamond to
Figure 1.1: Photograph of a levitated nanodiamond.
oscillator system through contact to the environment, the nanodiamond is levitated
by an optical tweezer in high vacuum. A readout mechanism of the electron spin
evidences whether or not a superposition took place.
Proposals [14–17] are a form of matter-wave interferometry. One of the
purposes of these, and other matter-wave interferometry proposals summarised in
[18, 19], is to build upon the experiments involving macromolecules [7–10] and test
the superposition principle with nanoparticles [20, 21]. A mesoscopic nanoparticle in
a quantum state could be an ideal system for testing various models of wavefunction
collapse, which are discussed in [21–23].
Another potential route to the quantum regime with nanoparticles is
cool-ing the centre-of-mass motion of glass spheres levitated in high vacuum to their
quantum ground state [24–29]. Millikelvin cooling of the centre-of-mass motion of a
nanoparticle was first demonstrated in 2011 by Li et al. [24] by using the radiation
pressure of a laser for each spatial degree of freedom to oppose the detected
veloc-ity of the nanoparticle. In 2012, Gieseler et al. [25] developed a new scheme that
only required the use of a single laser to reach millikelvin temperatures. This was
achieved by active modulation of the depth of the optical potential well trapping
1.2.1 Matter-wave interferometry
Proposals [12–15] amount to a form of matter-wave interferometry. One of the pur-poses of these, other matter-wave interferometry proposals [17, 18], is to to build upon the experiments involving macromolecules [7–9] and test the superposition principle with nanoparticles [19]. Another potential route to the quantum regime with nanoparticles is cooling the centre-of-mass motion of levitated silica spheres to their quantum ground state [20–23]. A potential benefit of using a levitated nan-odiamond containing a nitrogen vacancy centre spin is the possibility to circumvent the ground state cooling required to observe mesoscopic quantum mechanical e↵ects [12, 14], which had proven to be difficult, although recent progress towards quantum ground state cooling appears promising [22, 23].
A schematic of the first nanodiamond matter-wave proposal can be sum-marised as follows:
|0i (1.1)
|i(|+ 1i+| 1i) p
2 (1.2)
1.3 Thesis structure
Chapters 2, 3, and 4 outline the theory required to interpret the results presented in the thesis. Chapter 2 provides a grounding in the theory of optical dipole trapping sub-wavelength nanoparticles and their dynamics in vacuum. An overview of elec-tron paramagnetic resonance (also referred to as elecelec-tron spin resonance) is given in chapter 3, which serves as a prerequisite to chapter 4. Chapter 4 begins with a brief discussion of synthetic diamonds, and the point defects in diamond relevant to this project, before the nitrogen vacancy centre is introduced.
Experimental results are given in chapters 5, 6, and 7. Results are presented in chapter 5 on the impact of 1550 nm illumination, a common wavelength used
3
1.2.1 Matter-wave interferometry
Proposals [12–15] amount to a form of matter-wave interferometry. One of the pur-poses of these, other matter-wave interferometry proposals [17, 18], is to to build upon the experiments involving macromolecules [7–9] and test the superposition principle with nanoparticles [19]. Another potential route to the quantum regime with nanoparticles is cooling the centre-of-mass motion of levitated silica spheres to their quantum ground state [20–23]. A potential benefit of using a levitated nan-odiamond containing a nitrogen vacancy centre spin is the possibility to circumvent the ground state cooling required to observe mesoscopic quantum mechanical e↵ects [12, 14], which had proven to be difficult, although recent progress towards quantum ground state cooling appears promising [22, 23].
A schematic of the first nanodiamond matter-wave proposal can be sum-marised as follows:
|0i (1.1)
|i(|+ 1i+| 1i) p
2 (1.2)
1.3 Thesis structure
Chapters 2, 3, and 4 outline the theory required to interpret the results presented in the thesis. Chapter 2 provides a grounding in the theory of optical dipole trapping sub-wavelength nanoparticles and their dynamics in vacuum. An overview of elec-tron paramagnetic resonance (also referred to as elecelec-tron spin resonance) is given in chapter 3, which serves as a prerequisite to chapter 4. Chapter 4 begins with a brief discussion of synthetic diamonds, and the point defects in diamond relevant to this project, before the nitrogen vacancy centre is introduced.
Experimental results are given in chapters 5, 6, and 7. Results are presented in chapter 5 on the impact of 1550 nm illumination, a common wavelength used
3
t
t0 t = 2π/ω
In order to test proposals [12–15], it is therefore necessary to:
•Levitate a nanodiamond in high vacuum.
•Control the nitrogen vacancy electron spin inside it.
•Readout the spin state of the electron.
This thesis explores the experimental viability of these requirements.
1.3 Thesis structure
Chapters 2, 3, and 4 outline the theory required to interpret the results presented in the thesis. Chapter 2 provides a grounding in the theory of optical dipole trapping sub-wavelength nanoparticles and their dynamics in vacuum. An overview of elec-tron paramagnetic resonance (also referred to as elecelec-tron spin resonance) is given in chapter 3, which serves as a prerequisite to chapter 4. Chapter 4 begins with a brief discussion of synthetic diamonds, and the point defects in diamond relevant to this project, before the nitrogen vacancy centre is introduced.
Experimental results are given in chapters 5, 6, and 7. Results are presented in chapter 5 on the impact of 1550 nm illumination, a common wavelength used to form optical dipole traps, on the nitrogen vacancy centre’s optical and electron spin properties. Chapter 6 reports on the characterisation of nanodiamonds con-taining nitrogen vacancy centres derived from chemical vapour deposition (CVD) diamonds, using a variety of spectroscopic techniques. The results of levitating CVD derived nanodiamonds in vacuum are presented in chapter 7, and contrasted with commercially available nanodiamonds. Finally, the thesis is concluded in chapter 8.
(0) (1.1)
4
1.2.1 Matter-wave interferometry
Proposals [12–15] amount to a form of matter-wave interferometry. One of the pur-poses of these, other matter-wave interferometry proposals [17, 18], is to to build upon the experiments involving macromolecules [7–9] and test the superposition principle with nanoparticles [19]. Another potential route to the quantum regime with nanoparticles is cooling the centre-of-mass motion of levitated silica spheres to their quantum ground state [20–23]. A potential benefit of using a levitated nan-odiamond containing a nitrogen vacancy centre spin is the possibility to circumvent the ground state cooling required to observe mesoscopic quantum mechanical e↵ects [12, 14], which had proven to be difficult, although recent progress towards quantum ground state cooling appears promising [22, 23].
A schematic of the first nanodiamond matter-wave proposal can be sum-marised as follows:
|0i (1.1)
|i(|+ 1i+| 1i) p
2 (1.2)
1.3 Thesis structure
Chapters 2, 3, and 4 outline the theory required to interpret the results presented in the thesis. Chapter 2 provides a grounding in the theory of optical dipole trapping sub-wavelength nanoparticles and their dynamics in vacuum. An overview of elec-tron paramagnetic resonance (also referred to as elecelec-tron spin resonance) is given in chapter 3, which serves as a prerequisite to chapter 4. Chapter 4 begins with a brief discussion of synthetic diamonds, and the point defects in diamond relevant to this project, before the nitrogen vacancy centre is introduced.
Experimental results are given in chapters 5, 6, and 7. Results are presented in chapter 5 on the impact of 1550 nm illumination, a common wavelength used
3 1.2.1 Matter-wave interferometry
Proposals [12–15] amount to a form of matter-wave interferometry. One of the pur-poses of these, other matter-wave interferometry proposals [17, 18], is to to build upon the experiments involving macromolecules [7–9] and test the superposition principle with nanoparticles [19]. Another potential route to the quantum regime with nanoparticles is cooling the centre-of-mass motion of levitated silica spheres to their quantum ground state [20–23]. A potential benefit of using a levitated nan-odiamond containing a nitrogen vacancy centre spin is the possibility to circumvent the ground state cooling required to observe mesoscopic quantum mechanical e↵ects [12, 14], which had proven to be difficult, although recent progress towards quantum ground state cooling appears promising [22, 23].
A schematic of the first nanodiamond matter-wave proposal can be sum-marised as follows:
|0i (1.1)
|i(|+ 1i+| 1i) p
2 (1.2)
1.3 Thesis structure
Chapters 2, 3, and 4 outline the theory required to interpret the results presented in the thesis. Chapter 2 provides a grounding in the theory of optical dipole trapping sub-wavelength nanoparticles and their dynamics in vacuum. An overview of elec-tron paramagnetic resonance (also referred to as elecelec-tron spin resonance) is given in chapter 3, which serves as a prerequisite to chapter 4. Chapter 4 begins with a brief discussion of synthetic diamonds, and the point defects in diamond relevant to this project, before the nitrogen vacancy centre is introduced.
Experimental results are given in chapters 5, 6, and 7. Results are presented in chapter 5 on the impact of 1550 nm illumination, a common wavelength used
3
Figure 1.2: Time-evolution of centre-of-mass states in reference [14]. A nanodia-mond is levitated in a harmonic potential in the presence of a magnetic field gradi-ent and oscillates with a frequency !. At t= t0 the electron spin is prepared in a superposition state (0) =| i(|+ 1i+| 1i)/p2. The states are allowed to evolve, and spatially separate due to the magnetic field gradient. After one oscillation pe-riod 2⇡/! the spatially separated states return and interfere. Spin measurements evidence the superposition.
mK still corresponds to a macroscopic state, far from the quantum groundstate.
A benefit of using a levitated nanodiamond containing a nitrogen vacancy centre
spin is the possibility to circumvent the ground state cooling required to observe
mesoscopic quantum mechanical e↵ects [14, 16], which had proven to be difficult,
although progress in the last year appears incredibly promising [27, 28].
A nanoparticle levitated in high vacuum o↵ers the added benefit of being
iso-lated from its room temperature environment, unlike the optomechanical and
elec-tromechanical systems such as mirrors, cantilevers, and SQUIDs used in analogous
experiments that require cryogenic cooling in order to achieve quantum groundstate
cooling [30–36]. Nanoparticles also o↵er the greatest level of macroscopicity [20, 21].
A schematic of the first nanodiamond matter-wave proposal [14] can be
sum-marised as follows:
1. A nanodiamond containing a single nitrogen vacancy centre S = 1 spin is
levitated in a harmonic potential, in the presence of a strong magnetic field
gradient.
3. A resonant pulse excites the spin into a superposition state with equal
prob-abilities of |+ 1i and | 1i, (0) = | i(|+ 1i+| 1i)/p2. The magnetic field gradient couples the centre-of-mass and electron spin degrees of freedom
as the|+ 1iand | 1i states feel opposing forces from the magnetic field.
4. As the states evolve, the centre-of-mass states spatially separate into two
har-monic wells corresponding to the |+ 1i and | 1i states. The mechanical oscillation of the two results in a periodic interference as the centre-of-mass
states spatially re-combine.
5. A slight tilt in the experiment ensures the centre-of-mass states evolve into
di↵erent gravitational potentials, which impart a phase di↵erence between the
arms of the interferometer, which is detected by spin readout at the end of the
experiment.
The controllable relative phase from tilting the experiment can only arise if the
centre-of-mass states were in two spatially separated gravitational potentials, and
therefore evidences the superposition. This scheme has been superseded. By turning
o↵the trapping potential after the spin is prepared into a quantum superposition,
the centre-of-mass states can spatially separate by distances comparable to the size
of the nanoparticle [17], as opposed to⇡0.2 pm in the scheme outlined above. Rather than relying on the harmonic potential re-combine the spatially separated states, the
spin states can be flipped mid-way through the evolution to reverse the trajectories.
In order to test proposals [14–17], it is therefore necessary to:
• Levitate a nanodiamond in high vacuum.
• Control the nitrogen vacancy electron spin inside it.
cence. NV centre fluorescence from levitated nanodiamonds was detected initially
in ensembles of NV centres in 2013 [37] and single NV centres were later detected in
2015 [38]. That same experiment had demonstrated magnetic resonance of the
elec-tron spins, along with another study [39]. Coherent control of a nitrogen vacancy
spin in a levitated nanodiamond has also been demonstrated [40].
However a number of problems have been reported. Neukirch et al. [38]
re-ported that the majority of the nanodiamonds they levitated using a 1064 nm laser
did not show any fluorescence whatsoever. One study had shown that a 1064 nm
laser could be used to rapidly quench the fluorescence from an NV centre and use
it as an ‘optical transistor’ [41]. All of the experiments had to be conducted at
at-mospheric pressure or in low vacuum, due to burning or graphitisation at pressures
of approximately 1 mbar. Our study [42] had determined that the commercially
available nanodiamonds that were being used were absorbing too much of the
trap-ping light due to defects and impurities, and subsequently could not dissipate their
excess heat in vacuum.
Attempts to negate these issues in optical traps have included the use of ion
traps. Ensembles of NV centres were detected in an ion trapped cluster of
nanodi-amonds [43]. Magnetic resonance of NV centres in ion trapped nanodinanodi-amonds has
also been achieved [44]. However the geometry of ion traps can make the inclusion of
high numerical aperture detection optics difficult. Sub-Kelvin cooling of the
centre-of-mass motion of a nanodiamond was implemented in a magneto-gravitational trap
in high vacuum [45]. However heating is still an issue in ion traps and
magneto-gravitational traps because of the light required to induce NV fluorescence [46].
This thesis addresses these issues that have so far been impeding further
progress towards the implementation of matter-wave interferometry proposals with
1.3
Thesis structure
Chapters 2, 3, and 4 outline the theory required to interpret the results presented in
the thesis. Chapter 2 provides a grounding in the theory of optical dipole trapping
sub-wavelength nanoparticles and their dynamics in vacuum. An overview of
elec-tron paramagnetic resonance (also referred to as elecelec-tron spin resonance) is given
in chapter 3, which serves as a prerequisite to chapter 4. Chapter 4 begins with a
brief discussion of synthetic diamonds, and the point defects in diamond relevant to
this project, before the nitrogen vacancy centre is introduced.
Experimental results are given in chapters 5, 6, and 7. Results are presented
in chapter 5 on the impact of 1550 nm illumination, a common wavelength used
to form optical dipole traps, on the nitrogen vacancy centre’s optical and electron
spin properties. Chapter 6 reports on the characterisation of nanodiamonds
con-taining nitrogen vacancy centres derived from chemical vapour deposition (CVD)
diamonds, using a variety of spectroscopic techniques. The results of levitating CVD
derived nanodiamonds in vacuum are presented in chapter 7, and contrasted with
Chapter 2
Theory of optical dipole traps
2.1
Introduction
The idea that light can exert forces on matter goes as far back to Kepler, who in 1619
had speculated that radiation pressure was the reason for comet tails pointing away
from the Sun. However, it was not until the 1860s that a fully fledged theory of the
momentum of light was developed by Maxwell, born out of his treaties on electricity
and magnetism [47]. It was then proven experimentally by Lebedev [48] in Russia,
and Nichols & Hull [49] in the USA, both in 1901 using a torsion balance where the
masses had been replaced by mirrors - now known as the Nichols radiometer.
The radiation pressure on a reflective surface is given by the Maxwell-Bartoli
expression Pr = (1 +R)I0/c, where R is the magnitude of the reflectivity,I0 is the intensity of the light and c is the speed of light in vacuum [50]. It was not until
1970 that the first trap based on radiation pressure was realised by Arthur Ashkin
at Bell labs, who had conceived of the idea having calculated that the radiation
pressure from a focussed 1 W laser on a wavelength sized glass sphere (⇡10 8 N) could greatly exceed the force of gravity (⇡ 10 11 N) [51, 52]. However this type of trap was limited in a number of ways: it relied on gravity or the use of
approached mg for smaller sub-wavelength particles (Rayleigh particles) and so it
was limited to larger particles; it also became very weak for non-spherical particles.
A breakthrough was made in 1986 when Ashkin, along with eventual Nobel laureate
Steven Chu, invented the so called single-beam gradient force optical trap, now more
commonly known as optical tweezers or the optical dipole trap - an all optical trap
produced by a single tightly focussed laser beam with a trapping force thousands
of times larger than mg, that could trap dielectric particles as small as 25 nm and
as large as 10µm [53]. Chu won the Nobel prize for extending the technique to the
trapping and manipulation of neutral atoms [54].
Whilst much of the work with optical traps has been conducted in fluids,
many physicists have focussed on optical trapping in vacuum in order to study
lev-itated particles as mechanical oscillators decoupled from their environment. After
Ashkin demonstrated levitation in high vacuum [55], optically levitated particles
have been proposed as candidates for quantum groundstate cooling of their
me-chanical motion for the purpose of observing quantum meme-chanical phenomena in
mesoscopic systems [56, 57].
So far, the centre-of-mass motion of optically levitated silica spheres have
been cooled below room-temperature by active feedback modulation of either the
force due to radiation pressure [24] or the dipole trapping force [25–29], with the
latter technique producing centre-of-mass temperatures as low as 450µK [28]. These
cooling techniques have facilitated force detection sensitivities of up to zN/pHz, which could pave the way for the detection of exotic new forces [58, 59]. Silica
spheres have also been cooled in high vacuum in hybrid electro-optical traps [60, 61].
Optical tweezers have also been used to measure instantaneous velocities
of Brownian particles [62], to observe non-equilibrium thermodynamics [63], and
thermal squeezed states have been achieved with mesoscopic silica spheres [64].
yet [65]. Rotational vibration about the polarisation axis of the trapping laser was
later observed in non-spherical nanodiamonds, which may provide another more
suitable degree of freedom for quantum groundstate cooling owing to the higher
frequencies compared to translational motion [66].
This chapter shall give an overview of the theory of optomechanics in relation
to optical dipole trapping of Rayleigh particles, focussing on the dipole trapping
mechanism in section 2.2, the dynamics of optically levitated Rayleigh particles
as described by fluctuation-dissipation theorem in section 2.3, and the notion of a
centre-of-mass temperature in section 2.4.
2.2
Optical forces
In this section, the derivations of the optical forces experienced by a sub-wavelength
dielectric particle in a monochromatic field will be summarised. It is assumed that
the electric fields are time-harmonic and that the complex amplitude of the electric
field can be written in terms of the real amplitude and phase E0 and , i.e. E =
E0(r)ei (r)nE, wherenE is the direction of polarisation.
The condition for Rayleigh scattering is satisfied for sufficiently small
par-ticles (normally defined as a < /10, where a is the radius), such that the phase
of the scattered light does not vary over the particles surface, so that it can be
approximated as a point dipole. A dielectric Rayleigh particle in the presence of a
monochromatic electric field will have an induced dipole moment given by [67]
p=↵0(!)E(r), (2.1)
whereE(r) is the electric field at the particles positionr, and↵(!) =↵0(!) +i↵00(!)
is the complex polarisability given by the Lorentz-Lorenz equation,
↵(!) = 4⇡"0a3
"(!) "m(!) "(!) + 2"m(!)
where"0 is the vacuum permittivity, and"(!) and"m(!) are the complex dielectric constants of the particle and surrounding medium respectively. "m(!) = 1 will be assumed for the remainder of this thesis as air/ vacuum is the only medium of
interest. The polarisability can also be expressed in terms of the refractive index,
n, by recalling that n=p". The Lorentz force on a point dipole is [68]
F=↵0
(E·r)E+dE
dt ⇥B . (2.3)
Using the identities
(E·r)E=r
✓
1 2|E|
2
◆
E⇥(r ⇥E),
and
r ⇥E= @B @t ,
Eq. 2.3 becomes
F=↵0
1 2r|E|
2+ d
dt(E⇥B) , (2.4)
where the second term is the time-derivative of the Poynting vector, S = E⇥B. Often, as in this case, we are only concerned with the time-averaged Poynting vector,
hSi, and the second term averages to zero [67, 68]. Eq. 2.4 simplifies to what shall now be referred to as the gradient force,
hFgradi= ↵0
2rh|E|
2i. (2.5)
This force is related to the real part of the polarisability, and the intensity gradient
of the electric field and therefore seeks to act in the direction pointing towards the
re-gion of highest electric field intensity. It is worth noting that since the polarisability
z
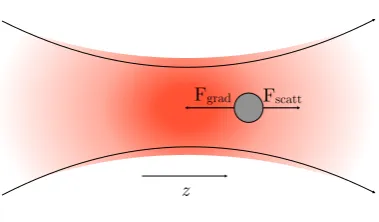
[image:26.595.227.417.115.226.2]Fgrad Fscatt
Figure 2.1: The gradient force acts to restore the particle to the point of highest intensity in the electric field, whereas the scattering force acts in the direction of propagation of the light. The result is an equilibrium position slightly o↵set from the center of the focal point as discussed in section 2.2.3.
and absorption. For a Rayleigh particle, this is
↵00= k 3
6⇡"0
↵02, (2.6)
wherek= 2⇡/ . ↵00 can be related to the scattering cross-section by s=↵00k/"0, which is given by [69]
s = 128
3 ⇡5a6
4
n2 1
n2+ 2 2
. (2.7)
Now the scattering force can be related to the scattering cross-section via [70]
Fscatt= s
c I(r,z)ˆz. (2.8)
The scattering force therefore scales asa6, unlike the gradient force which scales as
a3. This sets an upper-bound to the size of particles that can be trapped with single
beam optical dipole traps.
2.2.1 Trap sti↵ness
By knowing the nature of the electric field, the trap spring constants and potential
propagation taken to be zand a direction of polarisation of nE, may be written as [67]
E(⇢, z) = p E0
1 +z/z0
e
✓
x2 wx2(z)+
y2 w2y(z)
◆
+i (⇢,z)
nE, (2.9)
whereE0 is the amplitude, wx(z) and wy(z) are the x and y beam waists, respec-tively, andz0 =kw20/2 is the Rayleigh range. Then from the paraxial approximation
w=
⇡(N.A.), (2.10)
where N.A. is the numerical aperture. The phase is
(⇢) =kz ⌘(z) + k⇢ 2
2R2, (2.11)
wherek= 2⇡/ ,⇢=px2+y2 is the radial position,
⌘(z) = tan 1(z/z0) (2.12)
is an acquired phase shift as the beam propagates through the focus known as the
Guoy phase, and
R(z) =z
✓
1 +z 2 0
z2
◆
(2.13)
is the wavefront radius. Equation 2.9 is slightly modified in order to account for the
slight beam asymmetry caused by elongation of the electric field along the direction
of polarisation.
Assuming small displacements (|r|⌧ ), the gradient force is proportional to the displacement from the centre of the focal spot and can be approximated as
harmonic i.e.
expressed as
ktrapx,y = 4⇡3↵(!)P
c"0
(N.A.)4
4 , (2.15)
and
ktrapz = 2⇡3↵(!)P
c"0
(N.A.)6
4 . (2.16)
2.2.2 Optical potential
For Rayleigh particles, then in generalFscatt⌧Fgrad. By neglecting the scattering force such that the optical force is considered to be purely conservative, a potential
depth can be defined asU = p·E [57],
U = 3I0V
c Re
⇢
" 1
"+ 2 , (2.17)
whereI0 is the intensity. Typically a potential depth of at least⇡10kBT is required for stable trapping to avoid thermal excitations ejecting the particle out of the trap
[53]. Figure 2.2 shows that it is difficult to trap nanodiamonds with radii of less than
⇡20 nm without the use of higher optical intensities, which may lead to unwanted heating e↵ects.
2.2.3 Equilibrium trapping position
The axial equilibrium position of a trapped nanoparticle is not centred on the
in-tensity maximum of the laser, rather the forward scattering force displaces the
equi-librium position further along from the focus. This position is given by the point
where the gradient and scattering forces are equal.
The electric field can be expressed in terms of the intensity asE2 = 2I/" 0c.
10 20 30 40 50 Radius (nm) 100 200 300 400 500 Power (mW) 103 104 105
Trap Depth (K)
Figure 2.2: Simulation of trap depth as a function of nanoparticle radius and incident laser power for a nanodiamond with refractive index ofn= 2.4+i2.39⇥10 7trapped with light of = 1µm focussed with a numerical aperture of 0.95.
of a focussed Gaussian beam becomes [70]
I(z) = 2P ⇡w20
1
1 + (2z/kw02)2 (2.18)
which is the intensity as a function of axial displacement,z. To find an expression
for the equilibrium z position, zeq, then the equation Fgrad+Fscatt = 0 must be
solved forz. Substituting the gradient and scattering forces in Eqs. 2.5 and 2.8 into
this equation gives
↵0 2"0cr
I(z) + s
c I(z) = 0 (2.19)
Inserting Eq. 2.18 into Eq. 2.19 and using the chain to solverI(z) yields
2z(2/kw2 0)2
⇥
1 + (2/kw2 0)2z2
⇤2 +
(2"0 s/↵0) 1 + (2/kw2
0)2z2
= 0. (2.20)
Rearranging Eq. 2.20 gives a quadratic expression inzwith the solutions
zeq =
(2/kw2 0)2+
p
(2/kw2
0)4 (2"0 s/↵0)2(2/kw02)2 (2"0 s/↵0)(2/kw02)2
and
zeq =
(2/kw02)2 p(2/kw2
0)4 (2"0 s/↵0)2(2/kw02)2 (2"0 s/↵0)(2/kw02)2
. (2.22)
There are two solutions becauseI(z) is symmetric about z = 0. The first solution
corresponds to the point where the gradient and scattering forces are equal behind
the focus (z <0). Therefore the expression of interest is the second solution because
the scattering force acts in the forward direction. To the best of my knowledge, this
is the first analytic expression for the equilibrium trapping position for a Rayleigh
particle in an optical dipole trap. Recalling that s=↵00k/"0, the square root term of equation 2.22 gives rise to the condition
↵0 ↵00 > k
2w2
0, (2.23)
which for a 1550 nm laser focussed by a numerical aperture of 0.85 means that
the ratio of the real polarisability to the complex polarisability must exceed ⇡
5.5. The equality can also be expressed in terms of the nanoparticle radius. For
a nanodiamond with refractive index n = 2.4, then it is revealed that the radius
cannot be greater than a ⇡ 185 nm. The intensity will drop even further when considering o↵-axis displacements, so the actual maximum radius is likely to be
lower than this.
2.3
Dynamics: Fluctuation-dissipation theorem
The motion of a trapped dielectric nanoparticle is not only harmonic, but also
stochastic. Collisions with gas molecules drive the nanoparticle, causing its position
to randomly fluctuate, whilst the motion through the gas creates drag (dissipation).
This idea that the stochastic component of the motion arises from the same source
as the damping/ drag is now known as the fluctuation-dissipation theorem, and was
and later by Nyquist to explain Johnson noise in electrical circuits [72], before the
theory was generalised in 1951 [73]. The Brownian dynamics present in levitated
nanoparticles necessitates the inclusion of damping and driving terms in the equation
of motion,
¨
x(t) + x˙(t) +!02x(t) = fth(t)
m , (2.24)
wherex(t) is the time dependent position along thexaxis (transverse to the optical
axis), m is the mass, is the damping rate, fth(t) is the stochastic driving force, and!0 =
p
ktrap/m. Similar equations may be written for they (transverse) andz (axial) directions.
It is often instructive to study the dynamics of trapped nanoparticles in the
frequency domain. Using F {dnx(t)/dtn} = (i!)nX(!), the Fourier transform of the time-dependent displacement is
X(!) = Fth(!)
m(!20 !2+i !), (2.25)
whereX(!) =F {x(t)}, and Fth(!) =F {fth(t)}. The driving term is a stationary process. As such, no Fourier transform exists. However the Weiner-Kinchin theorem
states that the two-sided (integrating from 1 ! 1) power spectral density (PSD,
Sxx(!)) of a stationary process and the associated autocorrelation function (ACF,
Rxx(!)) of a system are a Fourier transform pair i.e. Sxx(!) =F {Rxx(!)} [74]. The ACF, which correlates the value of the signal at a timet to the signal
at a later timet+t0, is defined by
Rxx(t0) = lim tm!1
1
tm
Z 1
1
x(t)x(t+t0)dt, (2.26)
If we look at the ACF at zero time delay (t0 = 0), we have
Rxx(0) = lim tm!1
1
tm
Z 1
1
x2(t)dt, (2.27)
which is the mean-square displacement,hx2(t)i. Parseval’s theorem states that the integral of the square of a function is equal to the integral of the square of the Fourier
transform. Combining Parseval’s theorem with Eq. 2.27 and the Wiener-Kinchin
theorem, we may write [75]
Sxx(!) = lim tm!1
1
tm|
X(!)|2, (2.28)
as an extension of Parseval’s theorem, which gives us a relation between the PSD
and the mean-square displacement. Similarly we can recover the ACF with the
inverse Fourier transform,
Rxx(t0) = 1 2⇡
Z 1
1
Sxx(!)e i!t 0
d!, (2.29)
and recalling that the ACF at zero time delay (t0 = 0) is the mean-square
displace-ment, we have
hx2(t)i= 1 2⇡
Z 1
1
Sxx(!)d!. (2.30)
From Eq. 2.25, the mean-square displacement in the frequency domain is
|X(!)|2 = |Fth(!)| 2
m2⇥(!2
0 !2)2+ 2!2
⇤, (2.31)
and using Eq. 2.28, the PSD is
Sxx(!) = lim tm!1
1
tm
|Fth(!)|2
m2⇥(!2
0 !2)2+ 2!2
⇤. (2.32)
the gas, and is therefore a white noise on the signal, with a PSD described by a
constantSF Fth [76, 77]. Inserting Eq. 2.32 into Eq. 2.30 allows us to write
hx2(t)i= S th F F 2⇡m2
Z 1
1
d! (!2 !2
0)2+ 2!2
= S
th F F 2m2!2
0 2
, (2.33)
where SF Fth is the power spectral density of the white driving force. This integral can be found in Ref. [78], Appendix F. From the equipartition of energy,
hx2(t)i= kBTcm
m!2 0
, (2.34)
and equating this with Eq. 2.33 gives usSF Fth = 2m kBTcm, leaving us with
Sxx(!) =
2kBTcm
m (!2 !2
0)2+ 2!2
, (2.35)
which is the form of the PSD to be used throughout the remainder of this thesis.
An expression for is given by Epstein [57, 79],
= 16P
⇡¯va⇢, (2.36)
where P is the gas pressure, ¯v = p8kBT /⇡m is the mean gas velocity (N.B. not to be confused with the r.m.s. velocity), a is the nanoparticle radius, and ⇢ is
the nanoparticle density. Fig. 2.3 shows the simulated power spectral densities of
a nanoparticle as the damping rate ( ) is lowered, equivalent to lowering the gas
pressure from atmospheric pressure to 10 6 mbar. Lowering the damping rate
cor-responds to reducing the noise floor of the PSD, revealing the oscillation frequency
of the nanoparticle peaked atp!2
0 50 100 150 200 ω/2π (kHz)
10-24 10-22 10-20 10-18 S xx ( ω )
(a) 103
!101mbar
0 50 100 150 200
ω/2π (kHz)
10-30 10-25 10-20 10-15 S xx ( ω )
(b) 100
!10 6 mbar
Figure 2.3: Simulated power spectral densities at di↵erent pressures using Eqs. 2.35 and 2.36. The nanoparticle radius and density are 50 nm and 3515 kg/m3, respectively, and !0/2⇡ = 100 kHz. (a) Atmospheric pressure (dotted line), 100 mbar (dashed line) and 10 mbar (solid line). (b) 1 mbar (dotted line), 10 3 mbar (dashed line), and 10 6 mbar (solid line).
2.4
Temperature
The centre of mass temperature,Tcm, was introduced in section 2.3. More formally,
we can defineTcm from the equipartition of energy as
kBTcm=m!0hx2(t)i. (2.37)
From quantum theory, the energy in a bound system is quantised and the mean
thermal occupancy is therefore expressed as
hni= kBTcm
~!0
. (2.38)
For a levitated particle with Tcm = 300 K and a typical !0 = 100 kHz, the mean
thermal occupancy is approximately 108, far from the quantum groundstate of the
potential. One route to reaching the groundstate could be to increase the power
of the trapping laser and therefore the trap frequency, recalling from equation 2.15
that the spring constant of the trap scales linearly with power. However, this would
frequency of 100 kHz!
The only viable option is to cool the center of mass temperature. This has
been achieved by modulating the power of the trapping laser to damp the motion
of the particle [24, 25, 27, 28]. One method, known as parametric feedback cooling,
modulates the amplitude of the trapping laser at twice the frequency of the particles
trap frequency with an appropriate phase shift such that the trap sti↵ness increases
when the particle moves away from the trap center, and lowers as it moves towards
it. Activation of the feedback leads to a modification of the equation of motion
(equation 2.24) [25]
¨
x(t) + x˙(t) +!20x(t) = 1
m[fth(t) +ff b(t)], (2.39)
whereff b(t) is the force introduced by the parametric feedback modulation of the trap sti↵ness with frequency 2!0. This also leads to a small frequency shift of
!0!!0+ ! and an increase in the damping rate ! 0+ . The resulting PSD with the feedback turned on is
Sxxf b(!) = 2kBTcm
m
0 [!2 (!0+ !)2]2+!2(
0+ )2
. (2.40)
Assuming !⌧!0,Tcm is given by [25]
Tcm =T 0
0+
, (2.41)
where T is the equilibrium temperature in the absence of feedback, taken to be
300 K. It is worth noting that depending on the phase of the feedback modulation,
it is also possible to parametrically drive the particle and thus heat the centre of
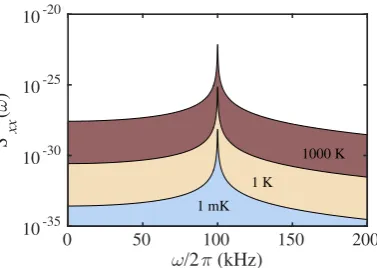
mass motion as well as cool it. Figure 2.4 shows the e↵ect of cooling and heating
0 50 100 150 200
ω/2π (kHz) 10-35
10-30 10-25 10-20
S
xx
(
ω
)
1 mK 1 K
[image:36.595.227.416.106.240.2]1000 K
Figure 2.4: Simulated power spectral densities of a nanoparticle at 10 6 mbar. The PSD is shown for centre-of-mass temperatures of 1000 K (heating), 1 K and 1 mK (cooling).
2.4.1 Non-equilibrium thermodynamics and internal temperature
Through cooling or heating of the centre-of-mass, a levitated nanoparticle can be in
thermodynamic non-equilibrium. Parametric driving and damping has been used to
generate these non-equilibrium states, from which the centre-of-mass was observed
to relax back to an equilibrium after the parametric modulation is turned o↵[80, 81].
However, internal heating of a nanoparticle also leads to non-equilibrium,
and non-equilibrium thermodynamic models can be used to determine the internal
temperature of the nanoparticle if it’s centre-of-mass temperature exceeds that of
the surrounding medium [42, 63, 82]. Collisions between the nanoparticle and gas
molecules are in general highly inelastic due to large thermal accommodation
coef-ficients (a phenomenological parameter that describes the degree of energy transfer
between two systems). In such a case, the nanoparticle’s interactions with the
sur-rounding gas can be divided into two independent baths: the impinging gas at
room temperature, and the emerging gas that has partially thermalised with the
nanoparticle. The centre-of-mass temperature and internal temperature are related
by
Tcm=
Timp imp+Tem em
imp+ em , (2.42)
emerging gas molecules, respectively, and imp+ em = . The internal
Chapter 3
Electron paramagnetic
resonance
Before introducing the nitrogen vacancy centre and other defects in diamond in
chapter 4, it is important to introduce the basic concepts of electron paramagnetic
resonance (EPR). The basis for this understanding will begin with an outline of
the magnetic interactions relevant to this thesis in section 3.1. An overview of
continuous wave and pulsed EPR experiments is given in 3.2. Finally, practical
aspects of EPR spectroscopy are discussed in section 3.3.
3.1
Magnetic interactions
In 1922 Walther Gerlach and Otto Stern observed in their seminal experiment that
a beam of silver atoms passed through a magnetic field gradient split up into two
spatially distinct beams [83]. The implication was that electrons possess a
quan-tised intrinsic angular momentum and magnetic moment, di↵erent from the orbital
angular momentum. Following from the early nuclear magnetic resonance (NMR)
experiments by Isidor Rabi in 1938 [84], Yevegeny Zavoiski performed the first
observed the first proton magnetic resonance in 1941, a result he dismissed at the
time, long before it was observed by Bloch and Purcell [86]).
3.1.1 The electronic Zeeman interaction
The quantised angular momentum and magnetic moment discovered in the
Stern-Gerlach experiment is referred to as spin. For an electron of mass me and charge
qe. The quantised magnetic moment is [87]
µe =
qe 2me~
ˆ
S, (3.1)
whereSˆ= (~/2) is the electron spin operator, is the Pauli spin matrix, and~is
the reduced Planck constant. Defining the Bohr magneton as
µB =
qe 2me~
, (3.2)
the magnetic moment of the electron is then canonically expressed as
µe= geµBSˆ, (3.3)
wherege is the free electron g-factor. The Zeeman e↵ect arises from the interaction of a spin with an external magnetic field, B0. Because the magnetic moment of an
electron is quantised, the energy levels split into discrete states. The number of these
energy levels is determined by the spin of the system, and the spin multiplicity is
2S+1, whereS =n/2 is the intrinsic electron spin fornelectrons. The z components
B0. The energy level splitting between these discrete states is
E=gµBB0 mS. (3.4)
The Hamiltonian for the electron Zeeman interaction is
HEZ = 1
~gµBB0ˆS. (3.5)
Measured deviations of g from ge, or anisotropy of g with respect to the external field B0, help to identify di↵erent types of samples. Shifts (also referred to as g
-strain) andg-anisotropy are analogous to the “chemical shift” observed in nuclear
magnetic resonance (NMR). Strictly speaking,g should therefore be expressed as a
tensor,g, rather than a scalar.
3.1.2 The nuclear Zeeman interaction
The spin of a nucleus is denoted byI, and like the electron, I = 1/2,1,3/2..., with
spin manifolds of mI = ±1/2 for an I = 1/2 system, or mI = 0,±1 for an I = 1 system etc. The Hamiltonian for the nuclear Zeeman interaction is
HNZ= 1
~gnµNB0ˆI, (3.6)
wheregn is the nuclear g-factor andµN is the nuclear magneton.
3.1.3 The hyperfine interaction
The hyperfine interaction is the energy level splitting caused by the Fermi contact
and dipolar coupling between an electron spin and a nuclear spin. Using equation
3.1, the larger mass of the proton results in a magnetic moment that is almost
three orders of magnitude smaller than that of the electron, and so the energy level
splittings at the ⇡ 0.3 T magnetic fields used in commercial EPR spectrometers. The Hamiltonian of the isotropic hyperfine interaction is [87]
Hiso=A0ˆSzˆIz, (3.7)
whereˆIz is the nuclear spin operator, and the hyperfine coupling constantA0 is
A0=
2µ0
3 gegnµBµN| (0)|
2, (3.8)
where µ0 is the vacuum permeability and | (0)|2 is the electronic wavefunction
density at the nucleus.
Equations 3.7 and 3.8 assume the interaction is isotropic. However, the
dipolar coupling of an electron and nuclear spin expanded inx,y, and z, is [87]
Hdipolar=
µ0
4⇡gegnµBµN
hr2 3x2
r5 SˆxIˆx+
r2 3y2
r5 SˆyIˆy +
r2 3z2
r5 SˆzIˆz (3.9) 3xy
r5 ( ˆSxIˆy+ ˆSyIˆx) 3xz
r5 ( ˆSxIˆz+ ˆSzIˆx) 3yz
r5 ( ˆSyIˆz+ ˆSzIˆy)
i
,
where r is the separation of the spins, and the origin of the x, y, z coordinates
is placed at the location of the nucleus. Averaging over the electron distribution,
equation 3.9 becomes
Hdipolar=
µ0
4⇡gegnµBµN
ˆ
Sx Sˆy Sˆz ·
2 6 6 6 6 4
hr2 3x2
r5 i h 3xyr5 i h 3xzr5 i
0 hr2r53y2i h 3yzr5 i
0 0 hr2r53z2i 3 7 7 7 7 5· 2 6 6 6 6 4 ˆ Ix ˆ Iy ˆ Iz 3 7 7 7 7 5
=SˆTA1ˆI.
contri-butions to the hyperfine interaction is then
Hh.f.=ˆSTAˆI, (3.10)
where the superscript T denotes the transpose, and A is the hyperfine coupling
tensor given by
A=A013+A1. (3.11)
Hyperfine couplings help determine the composition of samples containing
unpaired electrons as the spectrum contains information about the atomic make-up
of the sample, the wavefunction density at the nucleus, and of course the nuclear
spin,I.
3.1.4 Zero-field splitting
Even without hyperfine coupling, energy levels can be non-degenerate without an
applied magnetic field in systems with Stotal>1/2 and non-cubic symmetry.
Spin-orbit coupling, the exchange interaction between the electrons, and the dipolar
cou-pling of the electrons lift the ground-state degeneracy to provide a field-independent
term [88]
HZFS=SˆTDˆS, (3.12)
where D is the zero-field splitting tensor. Commonly D is written in terms of its
axial and transverse components, D and E. Equation 3.12 can then be re-written
as
HZFS=D
Sz2 1
3S(S+ 1) +E(S 2
x Sy2), (3.13)
where D = 3Dz/2 and E = (Dx Dy)/2. In systems with cubic symmetry, D =
E = 0, whilst for axially symmetric systems such as the NV centre in diamond,
D6= 0, E= 0. Both terms are non-zero in systems with lower symmetry.
spinsˆs1 and ˆs2 (i.e. ˆS =ˆs1+ˆs2) separated by r12 with g-factors g1 and g2, the
dipolar contribution to the zero-field splitting is expressed by
HDD=ˆsT1Dˆs2 = 1
r3 12
µ0 4⇡~g1g2µ
2 B
ˆsT1ˆs2
3
r2 12
(ˆsT1r12)(ˆsT2r12) . (3.14)
This term usually dominates the zero-field splitting interaction.
If the interaction between the electrons in such a paramagnetic system with
two unpaired spins is significant, as is the case for the spin systems discussed in this
thesis, the system splits into a singlet state (S = 0) and a triplet state (S = 1). The
separation in energy of the singlet and triplet states depends on the overlap of the
electron wavefunctions, and is given by the electron exchange interaction,
Hexch=ˆsT1Jˆs2, (3.15)
whereJis the exchange coupling tensor. Assuming the interaction is isotropic, the
isotropic exchange coupling constant is [87]
J0 = 2h a(1) b(2)|
q2e
4⇡"0r| a
(2) b(1)i, (3.16)
where a and b are di↵erent electron orbital wavefunctions. The sign of J0 de-termines whether the singlet or triplet is lower in energy, although in general the
triplet state will have lower energy due to a smaller Coulombic repulsion between
the electrons.
Spin-orbit coupling is significant to first-order for systems like the nitrogen
vacancy centre in diamond [89]. It is given by an addition of the orbital angular
momentum Lto the Zeeman interaction term
where HEZ is modified to include the orbital angular momentum, and HSO is the
spin-orbit coupling, described by a coupling constant [88].
3.1.5 The nuclear quadrupole interaction
Nuclei with spin I 1 have a non-spherical charge distribution. The charge
dis-tribution interacts with the electric field gradients caused by the nearby nuclei and
electrons, and is described by the Hamiltonian
HNZ =ˆITPˆI (3.18)
wherePis the nuclear quadrupole tensor. The e↵ect of the quadrupole interaction
is to shift EPR resonances and the appearance of forbidden transitions (transitions
that break selection rules), however both are small second-order e↵ects [88].
3.2
Resonant excitation by electromagnetic fields
3.2.1 Resonance
At thermal equilibrium, the populations of the spins in the spin up and spin down
states obey the Maxwell-Boltzmann distribution,
n"
n# =e
h⌫
kBT, (3.19)
where ⌫ is the frequency of the transition, i.e. E =h⌫ = geµBB0. For a g ⇡2 system, the resonance at 3380 mT corresponds to an energy level separation of
approximately 9.75 GHz (otherwise referred to as X-band), where the relative
pop-ulations ofn"/n# is approximately 0.998. This small population di↵erence causes a
net absorption of resonant microwave (m.w.) radiation and it is this net absorption
that is the source of an EPR signal, as shall be explored in more detail in section
x
y z
B0
ω
ω x
y z
B0
ω
M M
[image:45.595.143.498.118.327.2]Laboratory frame Rotating frame
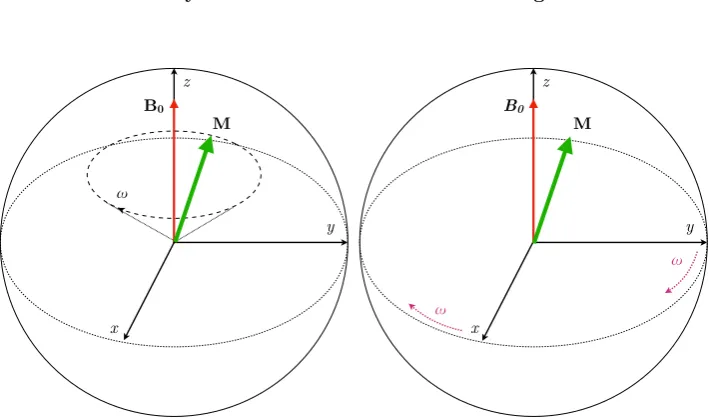
Figure 3.1: (left) In the laboratory frame, the magnetisation vector (green arrow) precesses on a cone about the external magnetic fieldB0 at the Larmor frequency !L. In the rotating frame (right), the x and y axes rotate about the z axis at a frequency!m.w., which greatly simplifies the dynamics when the resonance condition ⌦=!L !m.w.= 0 is fulfilled.
the electron, which causes a re-orientation of its magnetic moment. The magnetic
moment is quantised and so this corresponds to a transition between two discrete
spin states that satisfy the selection rule mS+ mI = 1.
In the laboratory frame, an external magnetic field exerts a torque on the
magnetic moment of an electron, and the electron precesses on a cone aboutB0 at
a frequency known as the Larmor frequency,
!L= 1
~geµBB0. (3.20)
Resonance is achieved when ⌦ = !L !m.w. = 0, where !m.w. = 2⇡⌫ is the fre-quency of the electromagnetic excitation. Typically in EPR, this radiation is in the
microwave frequency range owing to the larger resonant frequencies involved in
3.2.2 The rotating frame
From this point forward an ensemble of spins will be treated the same as
time-averaging a single spin. This will allow us to follow the theoretical formulation of
pulsed EPR by Schweiger & Jeschke [88]. When discussing ensembles of spins, it is
more useful to speak in terms of the net magnetisation due to the small population
di↵erences (equation 3.19). Any nuances will be stated where necessary. Results are
reported in this thesis on both ensembles and single spins, however all single spin
results are time-averaged.
To simplify the dynamics of the magnetisation during microwave irradiation,
a new frame of reference is introduced. The rotating frame (figure 3.1) rotates
about thez-axis at a frequency!m.w., whereˆz||B0. The resonant microwave field is
represented by a magnetic field vectorB1. When the resonance condition is fulfilled
(⌦ = 0) the magnetisation in this frame of reference precess about B1. It can
be shown that changing the phase of the oscillating field by rotates its rotating
frame direction in the xy plane by an angle [88]. Therefore the direction of the
oscillating field need only be controlled by the phase. For example, a circularly
polarised field with = 0 has a direction that defines the rotating frame x-axis and
causes rotations in theyz plane, and = 90 is along the rotating framey-axis and
causes rotations in thexz plane.
For a single spin, the rotating frame is the Bloch sphere. The poles of the
Bloch sphere represent the pure states of the two level spin system, and the equator
represents superpositions of|"iand |#i.
3.2.3 Pulsed EPR
The e↵ect of a microwave pulse applied for a timetp is to rotate the magnetisation. For example, applying a pulse along the y-axis ( = 90 ) tips the magnetisation
vector by a tip angle✓in the xzplane. Two types of pulses form the basis for most
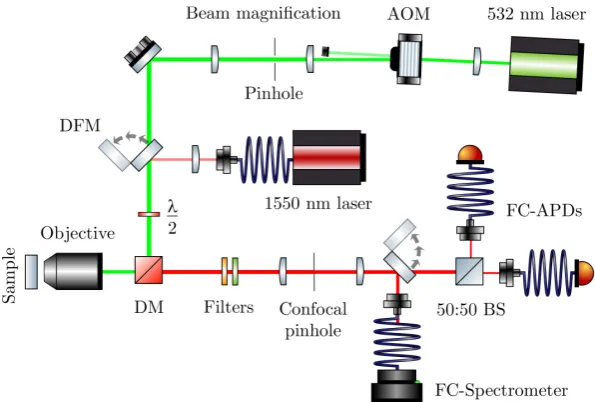
![Figure 3.3: Schematic of an EPR spectrometer, adapted from reference [91].](https://thumb-us.123doks.com/thumbv2/123dok_us/9455454.452584/49.595.201.442.103.305/figure-schematic-epr-spectrometer-adapted-reference.webp)
![Table 4.1: Survey of the mechanical and optical properties of single crystal diamond.Adapted from the Element Six Diamond Handbook [92].](https://thumb-us.123doks.com/thumbv2/123dok_us/9455454.452584/52.595.225.414.381.517/survey-mechanical-optical-properties-adapted-element-diamond-handbook.webp)
![Figure 4.3: NV� energy level diagram, adapted from [13, 137]. Numbers to the leftof the energy levels indicate the spin quantum number](https://thumb-us.123doks.com/thumbv2/123dok_us/9455454.452584/59.595.227.413.109.275/figure-energy-diagram-adapted-numbers-leftof-indicate-quantum.webp)
![Figure 4.4: Time-resolved fluorescence intensity of the NV� centre, from reference[140].The time-resolved fluorescence intensities from top to bottom are for thems = 0, ±1, and the di↵erence.](https://thumb-us.123doks.com/thumbv2/123dok_us/9455454.452584/61.595.231.414.288.430/figure-resolved-uorescence-intensity-reference-resolved-uorescence-intensities.webp)
![Figure 4.5: Configuration diagram for a ground state and excited state, adaptedfrom [141]](https://thumb-us.123doks.com/thumbv2/123dok_us/9455454.452584/62.595.206.442.105.310/figure-conguration-diagram-ground-state-excited-state-adaptedfrom.webp)