University of Warwick institutional repository: http://go.warwick.ac.uk/wrap
A Thesis Submitted for the Degree of PhD at the University of Warwick
http://go.warwick.ac.uk/wrap/59833
This thesis is made available online and is protected by original copyright. Please scroll down to view the document itself.
Synthesis and application of colloids in soft
matter systems
By
Thomas S. Skelhon
A thesis submitted in fulfillment of the requirements
for the degree of
Doctor of Philosophy in Chemistry
University of Warwick, Department of Chemistry
Table of Contents
Figures ...I
Acknowledgments... XI
Declaration ... XII
Abstract ... XIII
Publication List ... XV
Abbreviations ... XVII
Chapter 1 ...1
Introduction to Soft Matter ...1
1.1 Colloids... 2
1.2 Stability of colloids ... 3
1.2.1 Electrostatic stabilisation ... 5
1.2.2 Steric stabilisation ... 7
1.3 Heterogeneous polymerisation techniques ... 8
1.3.1 Emulsion polymerisation ... 9
1.3.2 Dispersion polymerisation ... 13
1.3.3 Suspension polymerisation ... 17
1.3.4 Precipitation polymerisation ... 17
1.3.5 Miniemulsion polymerisation ... 17
1.4 Janus particles... 18
1.4.1 Toposelective surface modification... 19
1.4.2 Template directed assembly... 20
1.4.3 Controlled surface nucleation ... 21
1.4.4 Microfluidics ... 22
1.5 Chocolate: from a colloidal perspective ... 24
1.5.1 Rheology of chocolate... 25
1.5.2 Moisture in chocolate ... 29
1.6 Scope and outline ... 30
1.7 References ... 31
Chapter 2 ... 37
Synthesis and interfacial properties of amphiphilic Janus particles
and their use as ice crystal inhibitors* ... 37
2.2. Introduction ... 38
2.2.1 Emulsion polymerisation ... 40
2.2.2 Synthesis of submicron Janus particles ... 41
2.2.3 Thermodynamics of entropic phase separation ... 42
2.2.4 Entropic phase separation as a route to dumbbell colloids ... 44
2.3. Results and discussion ... 46
2.3.1 One pot synthesis of amphiphilic Janus particles ... 46
2.3.2 Swelling and phase separation polymerisation ... 54
2.3.3 Limitation of solids content ... 63
2.3.4 Physical properties of Janus particles... 65
2.3.5 Crystalline behaviour of Janus particles ... 67
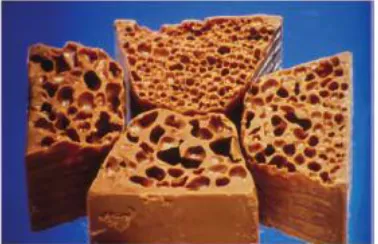
2.3.6 Foam stabilisation using Janus particles ... 72
2.3.7 Ice crystal inhibition of Janus particles ... 74
2.4 Conclusions ... 77
2.5 Experimental... 78
2.5.1 Materials... 78
2.5.2 Equipment ... 78
2.6 References ... 83
Chapter 3 ... 86
Synthesis of ‘hard-soft’ Janus particles by seeded dispersion
polymerisation ... 86
3.1 Abstract ... 86
3.2 Introduction ... 87
3.2.1 ‘Hard-soft’ Janus particles ... 87
3.2.2 Synthesis of hard-soft Janus by seeded emulsion polymerisation... 88
3.2.3 Seeded dispersion polymerisation ... 90
3.2.4 Synthesis of hard-soft Janus by seeded dispersion polymerisation ... 93
3.3 Results and discussion ... 95
3.3.1 Synthesis of micron sized hard-soft Janus particles ... 95
3.3.2 Seeded dispersion polymerisation of butyl acrylate in the presence of polystyrene seed particles at varying concentrations... 99
3.3.3 Synthesis of sub-micron hard-soft Janus particles ... 114
3.4 Conclusions ...119
3.5 Experimental...120
3.5.1 Materials... 120
3.5.2 Equipment ... 120
3.5.3 Dispersion polymerisation ... 121
3.6 References ...125
Chapter 4 ... 128
Hierarchical self-assembly of ‘hard-soft’ Janus particles into
colloidal molecules and larger supracolloidal structures ... 128
4.1 Abstract ...128
4.2 Introduction ...129
4.2.1 Colloidal molecules ... 130
4.2.3 Colloidal clusters from controlled surface nucleation... 131
4.2.4 Colloidal clusters from controlled clustering ... 131
4.2.5 Anisotropic colloidal assembly ... 134
4.3 Results and discussion ...140
4.3.1 Dilution as a route to particle flocculation ... 140
4.3.2 Flocculation kinetics of hard-soft Janus particles ... 142
4.3.3 Modelling colloidal stability of a sterically stabilised particle dispersion ... 146
4.3.4 Cluster formation of hard-soft particles ... 148
4.3.5 Surface energy simulations of clusters ... 152
4.3.6 Statistical distribution of primary particles per cluster ... 153
4.3.7 Higher order structures ... 156
4.3.8 Particle stabilised bubbles ... 157
4.4 Conclusions ...161
4.5. Experimental...162
4.5.1 Materials... 162
4.5.2 Equipment ... 162
4.5.3 Cluster Synthesis ... 165
4.6. References ...166
Chapter 5 ... 170
Water-in-oil Pickering stabilised emulsions for confectionery
formulations
*... 170
5.1 Abstract ...170
5.2 Introduction ...171
5.2.1 Fat reduction through emulsification ... 173
5.2.2 Pickering stabilisation ... 174
5.2.3 Chitosan interfacial reinforcement ... 179
5.3. Results and discussion ...181
5.3.2 Cocoa butter model systems ... 188
5.3.3 Real chocolate formulations ... 192
Figure. 5.14 ... 194
Figure. 5.15 ... 195
5.4 Conclusions ...196
5.5 Experimental...197
5.5.1 Materials... 197
5.5.2 Equipment ... 197
5.5.3 Protocols for preparation of the emulsions ... 198
5.6 References ...200
Chapter 6 ... 204
High internal phase agar hydrogel dispersions in confectionery
formulations
*... 204
6.1 Abstract ...204
6.2 Introduction ...205
6.2.1 Agarose hydrogels ... 208
6.2.2. Polyglycerol polyricinoleate stabiliser ... 210
6.3 Results and Discussion ...212
6.3.1 Agar microgel dispersions in sunflower oil ... 213
6.3.2 Two stage emulsification strategy ... 214
6.3.3 Shear cooling emulsification strategy ... 215
6.3.4 Rheology of agar microgel in sunflower oil dispersions ... 217
6.3.5 Electron microscopy of agar microgel in sunflower oil dispersions ... 219
6.3.6 Agar microgel dispersions in cocoa butter... 221
6.3.7 Electron microscopy of agar microgel dispersions in cocoa butter... 221
6.3.8 Dispersing agar microgels in chocolate ... 224
6.3.9 Rheology of chocolate based microgel dispersions ... 225
6.3.10 Thermal analyses of chocolate microgel dispersions ... 228
6.4 Conclusions ...230
6.5 Experimental...231
6.5.1 Materials... 231
6.5.2 Equipment ... 231
6.5.3 Emulsification protocols ... 233
6.6 References ...233
Chapter 7 ... 236
Conclusions and outlook... 236
Appendix A ... 239
Characterisation of colloidal, interfacial and bulk properties ... 239
A.1 Gravimetry ...239
A.2 Dynamic light scattering ...240
A.3 Electrophoretic light scattering ...242
A.4 Electron microscopy ...244
A.5 Rheology ...246
A.6 Droplet shape analyser...250
A.7 References ...252
Appendix B ... 253
I
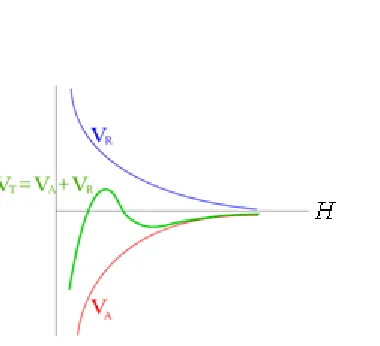
Figure 1.1 Schematic of repulsive (VR), attractive (VA) and combined total (Vt)
potentials arising from the respective Columbic and van der Waals interactions between particles over interparticle separation (H) ... 6
Figure 1.2 The particle size ranges possible from common heterogeneous polymerisation techniques ... 9
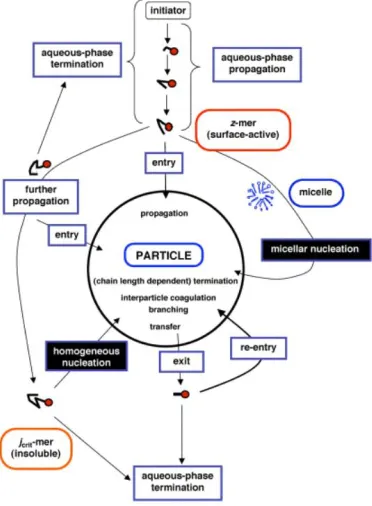
Figure 1.3 Possible events occurring during the initial stages of an emulsion
polymerisation from a radical perspective, reproduced from Gilbert et al.25 ... 11
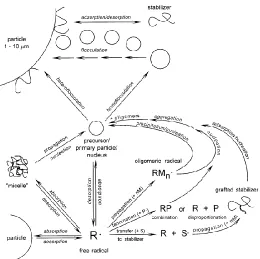
Figure 1.4 A schematic model for the particle nucleation and growth of sterically
stabilised particles in dispersion polymerisation. Reproduced from Kawaguchi43... 15
Figure 1.5 Schematic representation of mechanisms involved in free radical dispersion polymerisation ... 16
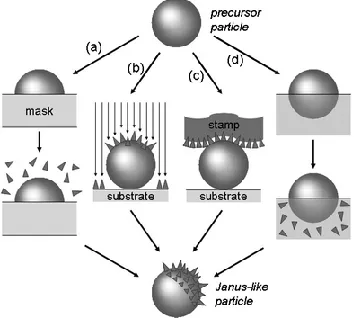
Figure 1.6 Schematic depicting the variety of different methods to manufacture Janus particles by toposelective surface modification. (a) embedding in a film and treating exposed side, (b) directional flux of material, (c) microcontact printing, (d) partial contact with reactive media56 ... 19
Figure 1.7 (a) Use of templates to geometrically confine particles of different size and (b) assembly of gold nanoparticles onto silica particles by deposition through a
microporous membrane to render Janus particles ... 20
Figure 1.8 (a) Microfluidic co-flow jetting device forming hemispherical Janus monomer droplets which are polymerised by a UV source.73 (b) Quadruple co-flow device using a mask and UV source to pattern highly complex Janus particles for medical diagnostics52 ... 22
Figure 1.9 Phase separation of a metastable FePt core from a CdS shell upon heating. An example of synthesising Janus particles from inorganic phase separation78 ... 23
Figure 1.10 (left) misshapen enrobed chocolate products with ‘feet’ resulting from insufficient yield stress. (right) Effect of yield stress on coating chocolate biscuits. Note the result of a too high yield stress83 ... 25
Figure 1.11 Effect of plastic viscosity of chocolate on bubble size in aerated products8326
Figure 1.12 Influence of particle size distribution on Casson plastic viscosity and yield stress of chocolate. (1) 30% fat; (2) 32% fat84 ... 27
Figure 1.13 Influence of fat content on Casson plastic viscosity and yield value of
chocolate. Fine (1) and coarse (2) particulate size distributions84 ... 28
Figure 2.1 Schematic and table summarising the effect of three major thermodynamic forces on the swelling of a particle ... 43
Figure 2.2 Schematic indicating the range of morphology possible depending on
II
Figure 2.3 (left) Conversion plots and (right) particle hydrodynamic diameter as a
function of (conversion)1/3 for the seed emulsion polymerisation with and without HEMA co-monomer. Lines indicate fitted linear functions ... 49
Figure 2.4 (Top)FEG-SEM micrographs of Janus seed particles with HEMA corona. (Bottom) FEG-SEM micrographs of Janus seed particles without p(HEMA) ... 51
Figure 2.5 (Top left) Number average size distribution for poly(styrene) seed particles with and without HEMA. Hydrodynamic radii (Top right) Polydispersity indices (Bottom left) and Zeta potentials (Bottom right) of seed particles plotted over a range of salt concentrations measured by dynamic light scattering ... 53
Figure 2.6 Fractional conversion (left) and mass conversion (right) of the seeded
emulsion polymerisations as a function of time for three ratios of added monomer to seed polymer mass ratios... 55
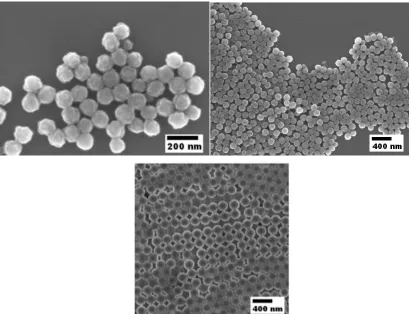
Figure 2.7 FEG-SEM image of amphiphilic Janus particles with 3:1 monomer : polymer ratio ... 56
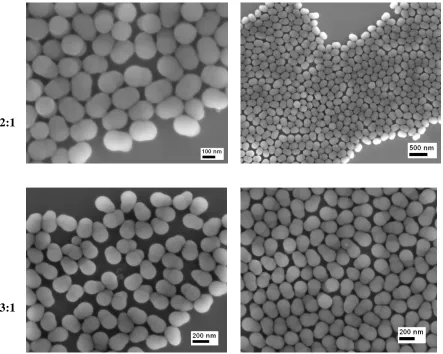
Figure 2.8 FEG-SEM images of Janus particles, including high magnification at different m/p ratios as indicated on the left... 58
Figure 2.9 Schematic and high resolution fake colour FEG-SEM image of a Janus particle depicting the dimensions measured for spherical cap size evaluation, the function of which is expressed on the right ... 59
Figure 2.10 (left) Hydrodynamic Diameter size distribution for the 3 ratios of Janus particles (right)Diameter as measured by dynamic light scattering (DLS) and by
measurement of the longest axis by (SEM). Using the image analysis in fig. 2.12, volume of the particles is plotted (Vp) – all as a function of monomer:polymer ratio ... 59
Figure 2.11 Volume of respective hydrophilic and hydrophobic lobes on Janus particles at different m/p ratios based on SEM image analysis from fig. 2.12 ... 60
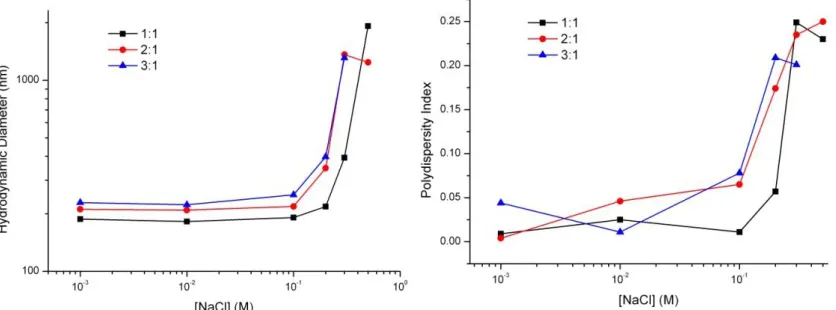
Figure 2.12 Janus particles of varying m/p ratios plotted as (left) hydrodynamic diameter and (right) PDI, both as a function of salt concentration as determined by DLS ... 62
Figure 2.13 (left) Zeta potentials of Janus particles of varying m/p ratios plotted as a function of salt concentration (right) zeta potential as a function of m/p ratio measured in deionised water at pH 5.5 ... 62
Figure 2.14 FEG-SEM images of a Janus particles synthesised at 30 wt% solids content with a 2:1 m/p ratio ... 64
Figure 2.15 Interfacial tension as a function of time for a droplet of 0.1 wt% aqueous suspensions of Janus particles suspended in hexadecane as measured by droplet shape analysis. Three m/p ratios of particles were measured. (left) linear scale, (right)
logarithmic scale ... 66
Figure 2.16 (l) FEG-SEM image of convectively assembled Janus particles of 2:1 m/p ratio. (r) Fast Fourier Transform analysis of the FEG-SEM image ... 68
III
Figure 2.18 FEG-SEM image across a pinning line region of convectively assembled Janus particles on a silica substrate. Areas of different packing arrangements are
indicated and delineated by red lines ... 70
Figure 2.19 High magnification FEG-SEM images of the areas with different packing orders, with associated FFT analysis below each image ... 71
Figure 2.20 Cryo-SEM images of an aqueous foam stabilised by Janus particles. (l) a collection of bubbles in close proximity, note the bucking of the bubble caused by jamming of particles at the air-water interface. (r) Plateau-Rayleigh junction between three bubbles ... 72
Figure 2.21 Cryo-SEM images of (l) close-up of the air-water interface revealing the location of the Janus particles. (r) A bubble stabilised by Janus particles on both
interfaces, enclosing a thin water film ... 73
Figure 2.22 Schematic indicating how native antifreeze proteins assemble into
quaternary amphiphilic structures and our bio-mimetic approach using polymeric Janus particles ... 74
Figure 2.23 A range of Janus particles with varying hydrophilic: hydrophilic lobe ratios. Numbers below each image represent volume and surface area % of hydrophobic parts respectively. These particles were used in the splat test assay Scale bars are 200 nm ... 75
Figure 2.24 Results of the splat test assay with mean largest grain size (MLGS) plotted as a function of suspension concentration for a range of hydrophilic:hydrophobic ratios presented in figure 2.26 ... 76
Figure 3.1 (a) seeded dispersion polymerisation of 2-Ethylhexyl methacrylate in the presence of poly(styrene) seed particles and various organic solvents.22(b) seeded dispersion polymerisation of BMA in the presence of poly(styrene) seed particles.23(c)
Seeded dispersion polymerisation of MMA with p(MMA) seeds.24(d) seeded dispersion polymerisation of BMA in the presence of poly(styrene-co-styrene sulfonate) and
dodecane25... 92
Figure 3.2 Optical micrograph of poly(styrene)/poly(butyl acrylate) Janus particles reported by Wang et al.28 ... 94
Figure 3.3 (left) optical micrograph of 2.5 µm diameter poly(styrene) seed particles. (right) Laser scattering analysis of the seed particles in methanol ... 96
Figure 3.4 Optical micrograph of poly(styrene) seed particles (left) and ‘hard-soft’ Janus particles (right). In the right image; the darker sphere represents the more dense
poly(styrene) seed, whereas the lighter part represents the poly(butyl acrylate) lobe ... 97
Figure 3.5 Cryogenic scanning electron micrographs of hard-soft Janus particles. (l) a whole particle, (r) a cross-section through a particle. In both images the larger lobe
represents the poly(styrene) core particle ... 98
IV order kinetic plot taking into account initiator decomposition of the seeded dispersion polymerisations ... 101
Figure 3.7 Optical micrographs of particles during a seeded dispersion polymerisation of BA in the presence of polystyrene seed particles (199 m2/L) ... 102
Figure 3.8 Schematic of the measurements taken to calculate volume of the poly(butyl acrylate lobe) (green) growing off a polystyrene seed particle (red) ... 103
Figure 3.9 Calculated lobe volume based on optical micrographs as a function of monomer conversion during seeded dispersion polymerisations with linear (left) and logarithmic (right) y-axes respectively ... 104
Figure 3.10 Optical micrographs of final seed particle dispersions after 24 hours
polymerisation time for each of the seeded dispersion polymerisations. The seed surface area for each reaction is indicated on the micrographs ... 105
Figure 3.11 (l) Observed lobe volume (expressed as a fraction of final lobe volume) as a function of conversion. Red line represents a linear fit of y = mx for all reactions whereby
m = 1.17. (r) Measured lobe volume fractions normalised against expected lobe volume
as a function of conversion. Black line represents the theoretical fractional growth profile for the reactions based on conversion data ... 106
Figure 3.12 Linear volume as a function of time (left) Logarithmic volume versus
conversion (right) for a seeded dispersion polymerisation at 46 m2/L seed surface area for both lobe size and size of secondary nucleation... 108
Figure 3.13 (l) Optical micrograph of multi-lobe particles overlaid with the angle measured between the centre of the two pBA. (r) Histogram of 75 measured angles
between the pBA cores ... 110
Figure 3.14 Optical micrograph of multi-lobe particles 7 days after synthesis indicating little change in particle morphology ... 111
Figure 3.15 (l) Average volume of pBA lobe for a single lobed particle (blue) and the averaged volume of each lobe of a seed particle possessing two pBA lobes. The red and black each represent the average volume of each lobe on the multi-lobe particle. (r) Optical micrographs indicating the volume difference between lobes on single and multi-lobe particles ... 112
Figure 3.16 Poly(styrene) seed particle diameters measured by optical microscopy as a function of polymer conversion for each of the seeded dispersion polymerisations at varying seed surface area ... 113
Figure 3.17 (l) Size distribution of the sub-micron poly(styrene) seed latex as measured by dynamic light scattering. (r) Conversion and hydrodynamic diameter (DLS) as a function of time for the styrene emulsion polymerisation to synthesise the sub-micron seed latex... 115
V
Figure 3.19 High magnification cryo-SEM images of submicron hard-soft Janus particles ... 117
Figure 3.20 (l) BA monomer conversion as a function of time for a seeded dispersion polymerisation of BA in the presence of submicron poly(styrene) seed particles. (r) Particle size distribution data of the resultant Janus particles after seeded dispersion polymerisation and the poly(styrene) seed particles prior to polymerisation... 118
Figure 3.21 Volume averaged hydrodynamic diameter as a function of conversion for Janus particle samples extracted during the seeded dispersion polymerisation ... 119
Figure 4.1. (a) entropic phase separation to grow dimers, trimers and tetramers.17 (b) & (c) growth of hybrid poly(styrene)-silica colloidal molecules20,21 ... 131
Figure 4.2. (a) Spherical cluster formation by evaporating droplet assembly and sinstering22 (b) Evaporating droplet assembly of a binary colloidal system23 (c)
Geometric confinement of spherical colloids on 2-D circular templates of varying size to render clusters from 1 -6 primary particles25 ... 133
Figure 4.3 Spacefill models of hydrogen bonding in (left) water and (right) acetic acid dimers, illustrating the specificity and directionality of molecular assembly ... 134
Figure 4.4. (a) hydrophilic polystyrene particles with hydrophobic domains assemble into dimers and trimers driven by the ability to reduce unfavourable interfacial tension arising from the exposed hydrophobic domain.26 (b) ‘Lock and Key’ Colloids, using depletion interaction to only allow assembly when the magnitude of interaction is strong enough, i.e. when particles fit snugly into the recess of a larger dimple..27 (c) Chemically anisotropic spherical Janus particles adopt specific geometries when flocculated in salt solutions based on energy minimisation of the polarised hemispheres28 ... 135
Figure 4.5. (a) Using complimentary DNA binding to selectively control assembly31 (b) Janus particles incorporating magnetic ferrofluid in one of the lobes assemble in magnetic fields32 (c) entropic phase separation of a monomer protrusion from a seed particle is a non-stabilised site for assembly into clusters33 (d) Janus particles use surface roughness anisotropy to direct assembly34 ... 137
Figure 4.6 Collated Time lapse laser diffraction measurements of PS microspheres in pure water (left) and aqueous PVP-K90 solution (right). Note the smaller secondary peak arises from a small quantity of undispersed aggregate present from the start of the
measurement ... 141
Figure 4.7 Volume fractions of particles measured at 2 µm diameter during the laser scattering measurements (figure 4.6) as a function of time for particle suspensions in pure water and PVP solution... 141
VI
Figure 4.9 Primary Particle concentration as a function of time for a range of PVP-K90 concentrations in the continuous phase, as measured by turbidity ... 145
Figure 4.10 Energetic interaction potentials of spherical colloids of varying diameter over a range of inter-particle separations with (left) and without (right) the presence of PVP-K90 steric stabiliser ... 148
Figure 4.11 Optical (left) and Cryogenic Scanning Electron (centre) micrographs of 0.5:1 pBA:pSty Janus particles, including a freeze-fractured slice through two coalesced particles (right) The larger, darker spheres are the pSty seed with the smaller, lighter lobes representing the pBA lobe. Scale bars 2 µm, 1 µm and 500 nm respectively ... 148
Figure 4.12 Optical micrograph of a typical Janus particle suspension after PVP removal, whereby desorption of the PVP from the particles has led to irreversible flocculation .. 149
Figure 4.13. Schematic of possible collision arrangements for two Janus particles. Green lobe represents the hard poly(styrene) ... 150
Figure 4.14 (left) High resolution Cryo-SEM images of clusters Np 1 – 5 coupled with the optical micrograph images of clusters in suspension (centre) Respective graphical surface energy minimisation simulation from Surface Evolver, green indicates the ‘hard’ poly(styrene) phase, red indicates the ‘soft’ poly(butyl acrylate) phase. (right) Examples of simple molecules with analogous VSEPR spacefill geometries ... 151
Figure 4.15 Optical micrographs of hard-soft particles used in cluster counting study, with conversion value at time of sample extraction and pBA lobe volume. Seed particle volume is included for reference ... 154
Figure 4.16 Populations of clusters containing 2-5 primary particles for hard soft Janus particles of three different soft lobe volumes ... 155
Figure 4.17 Dry FEG-SEM images of higher order clusters ... 156
Figure 4.18 (Top) Optical microscope image of higher order particle clusters. (Bottom) Cryo FEG-SEM images of higher order clusters ... 157
Figure 4.19 Z-stacked optical microscopy image of single bubbles stabilised by hard-soft Janus particles ... 158
Figure 4.20 Z-stacked optical microscopy image of 5 bubbles of various size in close proximity stabilised by hard-soft Janus particles ... 159
Figure 4.21 Optical micrograph of a large bubble stabilised by Janus particles with clear hexagonal close pack domains ... 159
Figure 4.22 Z-stacked optical micrographs of Janus particle colloidosomes 24 hours after formation ... 160
Figure 5.1 Structural formula of the main component of cocoa butter: triglyceride fat derived from palmitic (red), stearic (green) and oleic (blue) acids ... 172
VII surface tension between the two phases respectively. Θ represents the three phase contact angle ... 175
Figure 5.3 A potential energy profile of a particle as a function of Z position from particle centre. Emin represents the energy minimum at particle position Zmin the most thermodynamically favoured position. E1 and E2 denote the energy required for particle escape into phase 1 and phase 2 respectively ... 177
Figure 5.4 Structural formula of Chitosan. Note the primary amine which provides cationic charge in acidic conditions ... 179
Figure 5.5 FEG-SEM micrographs of HDK-H20 fumed silica particles. Note the
aggregation of primary particles into large clusters ... 183
Figure 5.6 Emulsions prepared with a 1:1 water : oil (w/w), different HDK H20 silica particle concentrations (in wt% with respect to the oil phase). All pictures were taken 24 hours after preparation ... 184
Figure 5.7 Emulsions prepared with a 1:1 water : oil (w/w), different HDK H20 silica particle concentrations (in wt% with respect to the oil phase), with a 1 wt% chitosan solution as water phase (pH of 3.2). All pictures were taken 24 hours after preparation 186
Figure 5.8 Viscosity of emulsions prepared with a constant silica particle concentration and an aqueous phase containing from 0 to 3 wt% chitosan (with respect to the weight of the aqueous phase) ... 187
Figure. 5.9 Shear viscosity as a function of increasing and subsequent decreasing shear rates (l) and shear stress (r) for three cycles. Increasing profiles (Δ), decreasing profiles (○). First cycle (black), second cycle (red), and third cycle (blue) ... 189
Figure. 5.10 Freeze-fractured cryogenic scanning electron micrograph of water-in-cocoa butter dispersions... 190
Figure. 5.11 (A) Cryogenic scanning electron micrographs depicting the surface and (B) cross-section of an emulsion droplet ... 191
Figure. 5.12 A magnified image of the solidified cocoa butter emulsion. In (1) the product was cleaved apart revealing trapped emulsion microstructure, whereas in (2) the product sliced using sharp knife resulting in sheared emulsion droplets and a ‘smooth’ tribological texture ... 191
Figure. 5.13 Images of dark (left), milk (centre) and white (right) chocolate emulsion formulations in which 50 wt% of fat has been replaced with cranberry juice. Images were taken after 14 days storage at 5 °C ... 193
Figure. 5.14DSC traces of the cocoa butter emulsion alongside pure cocoa butter (l) and dark chocolate emulsion alongside pure dark chocolate (r) ... 194
Figure. 5.15DSC traces of the white chocolate emulsion alongside pure white chocolate (l) and milk chocolate emulsion alongside pure milk chocolate (r) ... 195
VIII
Figure 6.1 (Top) Structural formula of agarose biopolymer. (Bottom) Schematic of reversible thermally controlled gel formation8 ... 208
Figure 6.2 Oscillatory rheological profile of complex modulus (G*) as a function of decreasing before increasing temperature indicating a significant thermal hysteresis .... 209
Figure 6.3 Structural formula of PGPR with hydrophilic and hydrophobic section marked in green and red respectively ... 211
Figure 6.4 Hand shaken water in PGPR containing sunflower oil emulsions left standing for 24 hours. Each row represents a fixed PGPR content with respect to oil phase at a range of oil fractions, 0.2 to 0.8 from L to R respectively ... 213
Figure 6.5 2.0 wt% Agar solutions emulsified into sunflower oil at 50 °C before cooling to room temperature. Oil volume fraction of dispersion is varied from 0.5 (L) to 0.9 (R). Note at an oil fraction of 0.5, the system phase inverts and gels ... 214
Figure 6.6 2.0 wt% Agar emulsified into sunflower oil following a two-stage emulsification strategy. A) 25 + 25 vol% agar phase after re-heating to 50 °C to
demonstrate thermal stability of two-stage emulsion. B) 25 + 25 vol% agar phase. C) 30 + 30 vol% agar phase. D) 35 + 35vol% agar phase ... 215
Figure 6.7 2.0 wt% Agar solutions emulsified into sunflower oil at 80 vol% aqueous fraction A) Emulsified at 50 °C, prior to quiescent cooling to room temperature. B) pre-gelled agar phase emulsified into oil phase at room temperature. C) Emulsified at 50 °C then sheared whilst cooling to room temperature. Note only sample C flows ... 216
Figure 6.8 Viscosity as a function of shear rate for 2.0 wt% agar phase in sunflower oil dispersions over a range of aqueous phase fractions. Legend indicates percentage of aqueous agar phase in dispersion ... 217
Figure 6.9 Viscosity as a function of shear stress for 2.0 wt% agar phase in sunflower oil dispersions over a range of aqueous phase fractions. Legend indicates percentage of aqueous agar phase in dispersion ... 218
Figure 6.10 Oscillatory shear strain amplitude sweep at 1 Hz for an 80 vol% agar
microgel dispersion in sunflower oil ... 218
Figure 6.11 Cryo FEG-SEM image of an 80 vol% agar phase in sunflower oil dispersion ... 220
Figure 6.12 High magnification Cryo FEG-SEM image of a slice through an agar
microgel particle from an 80 vol% agar phase in sunflower oil dispersion ... 220
Figure 6.13 Cryo FEG-SEM image of 80 vol% gar phase in cocoa butter dispersion ... 222
Figure. 6.14 High magnification Cryo FEG-SEM image of an agar microgel particle, from an 80 vol% agar phase in sunflower oil dispersion. Note the presence of smaller agar gel particles within ... 223
IX
Figure. 6.16 Photograph of milk, white and dark chocolate (L to R) with 50% w/w agar microgel content with respect to fat content of the chocolate ... 225
Figure. 6.17 Rheological flow profiles of molten chocolate formulations, each fitted by
the Casson equation for (top left) white, (top right) dark and (bottom) milk chocolate .. 227
Figure 6.18 DSC thermographs of 50 vol% agar microgel dispersions in three types of chocolate; (top left) white ,(top right) dark and (bottom) milk ... 229
Figure 6.19 Milk chocolate (L) and Cocoa Butter (R) emulsions containing 40% ethanol as part of the 50% w/w aqueous gelled phase (based on fat content of the chocolate) ... 230
Figure A.1 Schematic indicating intensity fluctuations of backscattered incident laser beam as a function of time for a suspension containing large (left) and small (particles) ... 241
Figure A.2 Schematic of a correlation function depicting a more rapid exponential decay in scattering intensity for smaller particles ... 242
Figure A.3 Negative potential as a function of distance for a particle with an anionic surface charge in aqueous conditions. Zeta potential represents the negative potential at the border of the slipping plane with the bulk solution ... 243
Figure A.4 Viscosity versus shear rate plots demonstrating 3 regimes of material
behaviour whilst under an applied stress ... 246
Figure A.5 Schematics of Viscosity response to an applied shear force in the case of a material with a yield stress or a zero shear viscosity ... 247
Figure A.6 Schematic indicating how viscoelastic behaviour is defined by the latency measured between an applied oscillating stress and its measured strain response. Diving these two components allows the calculation of complex modulus ... 248
Figure A.7 The latency between input stress and measured strain is quantified by phase angle ... 248
Figure A.8 Input stress (red) – measured strain responses (blue) for a purely elastic (left) and purely (viscous) material tested by oscillatory rheology ... 249
Figure A.9 Frequency sweep measurements at fixed amplitude can be used to
characterise one of three main material behaviours, Viscoelastic solid, liquid and gel .. 250
Figure A.10 Schematic indicating the dimensions measured on a pendant droplet to ascertain interfacial tension ... 251
Figure B.1 Schematic of the experimental setup for the Janus particle turbidity
measurements. ... 253
X
Tables
Table 1.1 Classification of colloids by the nature of their dispersed and continuous
phases ... 2
Table 2.1 List of chemicals required to render seed particle latex ... 82
Table 2.2 List of chemicals required for seeded emulsion polymerisation with different m/p ratios ... 82
Table 3.1 Concentrations by mass, number and surface area of the seed particle
quantities used in the seeded dispersion polymerisations... 100
Table 3.2 Percentage of particles with multiple pBA lobes for each seeded dispersion polymerisation ... 109
Table 3.3 List of chemicals required for poly(styrene) seed particle synthesis... 122
Table 3.4 List of reagents used in the kinetic seeded dispersion polymerisation
experiments ... 123
Table 3.5 List of chemicals required for submicron poly(styrene) seed particles by
emulsion polymerisation ... 124
Table 3.6 List of chemicals required for seeded dispersion polymerisations in the
presence of sub-micron poly(styrene) seed particles ... 125
XI
Acknowledgments
Initially, I have to thank those who have shared the rollercoaster ride of the Ph.D. within the BonLab past and present. Namely Rong, Yunhua, Joe, Imperial Rob, Saif, Rob Young, Alan, Catheline, Gabit, Nick, Tom Ruhland, Florence Gayet, but especially my lab partners in crime Adam and Holly.
I could not have possibly completed the research contained within this thesis without the help of various staff throughout the university including Steve York (physics electron microscopy), Marcus, Lee, Kirk and Rob (mechanical and electrical workshops), Roger Thorpe (dept. of engineering) and Neil Reynolds (WMG). Nick Barker I have to thank for the opportunity for the outreach experience I have thoroughly enjoyed. Also noteworthy is Dr. Fox for his inspiring coffee room chats.
I have to thank the friends who have been an integral part of the fun times I have experienced at Warwick over the years, especially the Glendale Warriors whom have had to endure co-habitation with me.
I’m very grateful to my parents; Louise and Martin, and my brother Jack who have
supported me emotionally and financially through my university experience. I just hope that I live up to their expectations as a ‘wise investment’!
XII
Declaration
I hereby declare that this thesis consists of my own work, with the exception of the collaborative work conducted below:
Chapter 2 – Janus particle suspensions for ice crystal tests were made in collaboration
with Dr. Attyah Al-Zhrani. Ice crystal splat testing of aqueous Janus particle suspensions was carried out by Thomas Congdon and Bibiana Yeo.
Chapter 4 – Synthesis and optical microscopy of hard-soft Janus particles used for
self assembly cluster measurements were carried out by Nathan Peck under my supervision.
Chapter 5 and 6 – DSC analyses of chocolate emulsion formulations were conducted
by Adam Morgan
Any work previously published is referenced at the opening page of each chapter. All work contained herein was conducted in the Department of Chemistry, University of Warwick between September 2009 and September 2013. No material contained in this thesis has been previously submitted for a degree at any other institution.
XIII
Abstract
We explore two distinct domains in the field of soft matter. The first three experimental chapters concern the synthesis, characterisation and application of Janus particles fabricated by heterogeneous polymerisation techniques. Initially in Chapter 2 we describe an optimised one pot seeded emulsion polymerisation strategy to render submicron amphiphilic Janus particles exhibiting surface active behaviour which can be tuned by the variation of hydrophilic to hydrophobic lobe volume ratios. These particles have been shown to inhibit ice recrystallisation in aqueous systems. In Chapter 3 we explore the synthesis of hard-soft Janus particles comprising of respective high and low glass transition temperature lobes. Although the rate of polymerisation is unaffected by available seed particle surface area, particles with multiple soft lobes and secondary nucleation occur below a seed surface area threshold. We additionally demonstrate the ability to fabricate sub-micron hard-soft Janus particles. Chapter 4 utilises the particles made in the previous chapter as building blocks to fabricate ‘colloidal molecules’ and
colloidosomes. In the former case, cluster morphology of particles is shown to be governed by surface area minimisation of the central soft domain.
XV
Publication List
Skelhon, T. S., Olsson, P. K. A., Morgan, A. R., and Bon, S. A. F., High internal phase Agar hydrogel dispersions in cocoa butter and chocolate as a route towards reducing fat content. Food and Function, 2013, 4, 1314-1321. *Cover article, Issue 4 p1279*
Skelhon, T. S., Grossiord, N., Morgan, A. R., and Bon, S. A. F., Quiescent water -in-oil Pickering emulsions as a route toward healthier fruit juice infused chocolate confectionery. Journal of Materials Chemistry, 2012, 22, 19289-19295
Morgan, A. R., Dawson, A., Mckenzie, H. S., Franks, H., Skelhon, T. S., Beanland, R., and Bon, S. A. F., Chemotaxis of Catalytic Silica-Manganese Oxide “Matchstick” Particles, Materials Horizons, 2014, DOI:10.1039/C3MH00003F
Ruhland, T. M., Groschel, A. H., Ballard, N., Skelhon, T. S., Walther, A., Muller, A. H. E., and Bon, S. F. A., Influence of Janus Particle Shape on Their Interfacial Behaviour at Liquid-Liquid Interfaces, Langmuir, 2013, 29 (5), 1388-1394
Morgan, A. R., Ballard, N., Rochford, L. A., Nurumbetov, G., Skelhon, T. S., and Bon, S. A. F., Understanding the multiple orientations of isolated superellipsoidal hematite particles at the oil-water interface, Soft Matter, 2013, 9, 487-49
XVI Al-Zhrani, A. S., Skelhon, T. S., Yeo, B., Deller, R. C., Congdon, T., Gibson, M. I., Bon, S. A. F., Anisotropic Particles Inhibit the Recrystallisation of Ice. In preparation
Skelhon, T. S., Peck, N., Olsson, P. K. A., Morgan, A. R., Bon, S. A. F., Synthesis of ‘Hard-Soft’ polymer Janus particles and their assembly into Colloidal Molecules and
XVII
Abbreviations
(Cryo) FEG-SEM (Cryogenic) Field Emission Gun Scanning Electron Microscopy
AFM Atomic force microscopy
AIBN Azobisisobutyronitrile
BA n-Butyl acrylate
DLS Dynamic Light Scattering
DVB Divinylbenzene
EGDMA Ethylene glycol dimethacrylate
FFT Fast Fourier Transform
HEMA Hydroxyethyl methacrylate
LCST Lower critical solution temperature LVER Linear Viscoelastic Region
MLGS Mean Largest Grain Size
NaSS Sodium Styrene Sulfonate
NIPAM N-isopropyl acrylamide
pBA Poly(butyl acrylate)
PGPR Poly(glycerol) poly(ricinoleate)
pSty Poly(styrene)
PVP Poly(vinylpyrrolidone)
TEM Transmission Electron Microscopy Tg Glass transition temperature
XM Fractional monomer conversion
1
Chapter 1
Introduction to Soft Matter
Soft condensed matter and complex fluid are terms to describe materials which exist
neither as a crystalline solid, nor as an ideal liquid, but exhibit behaviour of both extremes, simultaneously. In everyday life, soft matter materials are ubiquitous, and form integral components in building materials (paint), personal care products (toothpaste), food (chocolate) and pharmaceuticals (oral suspensions). The elusive term ‘soft matter’ can be divided into several more focussed categories, including certain polymers, gels, colloids, surfactants and liquid crystals. Whilst these materials seem to possess little in common, they all exhibit similar physical properties which permit them to be classed as one discipline.
2 permit the formation of complex, hierarchical structures and exhibit rich phase behaviour. Non-ideal mechanical behaviour is also a hallmark of complex fluids. A soft matter material response to an applied stress will rarely be either a Newtonian liquid or a Hookean solid. It will instead exhibit complex non-Newtonian and viscoelastic properties, based on interactions occurring on the mesoscale.2
1.1 Colloids
Of the soft matter domains, the field of colloids is perhaps the most significant. A colloid is a dispersion of one material within another, first documented by Thomas Graham in 1694.3,4 Colloids possess a dispersed or discontinuous phase, which consists of finely divided material of approximately 1 nm - 10 µm diameter, in the presence of a surrounding continuous or environment phase. Colloids can be classified by the nature of the continuous and dispersed phases as seen in table 1.1.
Dispersed Phase
Continuous Phase
Gas Liquid Solid
Gas - Liquid Aerosol Solid Aerosol
Liquid Foam Emulsion Sol / suspension
Solid Solid Foam Gel Solid Sol
Table 1.1 Classification of colloids by the nature of their dispersed and continuous phases
3 as the milky sap known as latex, tapped from the rubber tree that has been used for centuries by the natives of South America. Polymer colloids can be found both as solid suspension, and almost as an emulsion. In the former case the particle content has a relatively high glass transition temperature (Tg), for instance poly(styrene) with a Tg of +105 °C. Alternatively, if the polymer Tg is low, for instance poly(butyl acrylate) with a Tg of -54 °C, the particle can be treated as a liquid droplet.
One of the key properties of a colloidal dispersion is the vast surface area resulting from the combined contribution of the dispersed phase. For instance, if 1 kg of poly(styrene) is dispersed in to water as 200 nm diameter spheres, the total interfacial area is 28530 m2. Therefore, the stability of this magnitude of interface is one of the most pertinent issues addressed in colloid science.
1.2 Stability of colloids
Colloidal particles are divided into two categories, lyophilic (thermodynamically stable)
and lyophobic (thermodynamically unstable). Often the continuous phase is aqueous, and
4 Liquid droplet dispersions within a liquid continuous phase, i.e. emulsions, are susceptible to similar effects. However, aggregation of droplets ultimately results in irreversible coalescence, a fate which can also be ascribed to ‘soft’ deformable particles.
Additionally, Ostwald ripening can occur, whereby smaller droplets (with a higher Laplace pressure) are observed to shrink and disappear, in favour of larger droplets.5 This is caused by the limited dissolution of the dispersed phase into the continuous phase, and therefore transport into the larger droplet with reduced surface area to volume ratio.
Aggregative effects are a result of the Brownian motion, causing particles or droplets of the dispersed phase to collide, which occurs frequently. Although Ostwald ripening does not involve the collision of droplets, the Laplace pressure is proportional to the interfacial tension of the droplet. Therefore colloidal stability depends on how the particles interact upon close proximity (and for the case of Ostwald ripening, the magnitude of the droplet surface tension). If a repulsive force exists, the particles repel each other, forming a kinetically stable dispersion. The potential energy of which, as a function of separation for spherical particles was described by Hamaker,6 depicted in equation 1.
(1)
5 takes into account the self attraction of the continuous (liquid) phase. A repulsive force to counteract this attraction and therefore provide colloidal stability can be applied in two primary ways.
1.2.1 Electrostatic stabilisation
In an aqueous or polar continuous phase, static repulsions arising from surface charges present on the particle surface provide sufficient resistance to aggregation. The surface charges induce the formation of an electrical double layer, a local increase in counterions around the particle which consists of an inner Stern layer where the counter ions are tightly bound to the surface and an outer more diffuse layer, bounded by the slipping
plane. An expression for the electric potential (VR) arising from the double layer can be
expressed as in equation 2 as a function of surface electric potential Vs, interparticle distance from surface H and characteristic thickness of the diffuse layer (Debye length), κ.
(2)
The hydrodynamic radius of a particle includes this layer, and its stability can be measured by dynamic light scattering and electrophoretic mobility respectively, as described in Appendix A.
6 van der Waals and Coulombic forces at play between particles with overlapping double layers. Upon interaction of the double layers, a locally higher concentration of solute ions exist, thereby increasing the free energy of the system. In order to balance the osmotic pressure arising from this electrochemical potential, solvent molecules diffuse to this area to re-equilibrate, therefore driving particles apart. Therefore combining the van der Waals attraction potential (VA) and Coulombic repulsive potential (VR) as equation 3 gives an expression for the total potential (Vt).
[image:31.612.238.428.309.482.2](3)
Figure 1.1 Schematic of repulsive (VR), attractive (VA) and combined total (Vt)
potentials arising from the respective Columbic and van der Waals interactions between two negatively charged particles in water over interparticle separation (H)
The total potential can be plotted as a function of spherical particle separation,
7 intermediate (electrical double layer) distances, thereby providing colloidal stability in the latter case.
1.2.2 Steric stabilisation
Van der Waarden in 1950 first observed the stabilisation of carbon black particles by long chain aliphatics in a low dielectric solvent.10 Almost 20 years later, Napper,11–15 fully quantified the effect of steric stabilisation involving the adsorption of long chain non-ionic polymers onto a particle surface. Steric stabilisers can be referred to as protective colloids and usually possess an affinity to the continuous phase. The mechanism of repulsion arises from two factors: (1) the entropic compression of the polymer chains upon particle-particle contact and (2) the increase in osmotic pressure arising from the locally high concentration of polymer chains between particles. Osmotic pressure repulsion and entropic chain repulsion are expressed in equations 4 and 5 respectively.
(4)
(5)
Where V, , , , ρ represent molar volume, effective volume fraction of polymer,
8 The interaction parameter can be estimated by use of the Hildebrand or Hansen solubility parameters δs and δp as seen in equation 6.
(6)
In this expression Vseg, R and T represent actual volume of a polymer segment, universal gas constant and temperature respectively. The Hansen solubility parameters predict the mutual miscibilities of one material within another based on molecular interactions.
Steric stabilisation is effective both in non-aqueous and aqueous systems, or where ionic strength and pH of the continuous phase may suppress electrostatic double layer (i.e. negligible zeta potential). It is commonly used in industrial processes as an effective anti-caking or sedimentation agent which can improve film formation properties and provides the primary stabilisation mechanism in dispersion polymerisation systems.
Electrostatic and steric stabilisation can be used in conjunction as a hybrid stabilisation system, either in the form of a charged particle surface possessing non-ionic polymer hairs or the use of ionic polyelectrolyte polymer chains.
1.3 Heterogeneous polymerisation techniques
9 homogeneous systems owing to the compartmentalisation effects between phases and kinetics of polymerisation, particle nucleation and growth.
Figure 1.2 The particle size ranges possible from common heterogeneous polymerisation techniques
The five main classes of heterogeneous polymerisation are emulsion, dispersion, mini-emulsion, precipitation and suspension. The particle size range accessible by each technique is pictured in figure 1.2 above. A comprehensive description is ascribed to techniques deployed in this thesis with a brief outline given to other techniques.
1.3.1 Emulsion polymerisation
Of the heterogeneous polymerisation systems available, emulsion polymerisation is the most studied and exploited industrially. It is a highly versatile technique able to synthesise particles of between 10-700 nm diameter. One of the most attractive attributes of emulsion polymerisation is ability to use water as the continuous phase for a wide range of monomer systems.
10 emulsifier, if used. Thermal or redox initiation is generally used to start an emulsion polymerisation; however more exotic methods such as electromagnetic16 and ultrasonic radiation17 have been reported. Some monomers, known as surfmers possess stabilisation qualities which are grafted into the polymer chains, and present on the particle surface providing colloidal stability.
The progression of an emulsion polymerisation can be divided into 3 distinct stages. During Interval I, the reaction mixture is continually agitated to generate monomer droplets and ensure monomer saturation of the continuous phase. Upon initiation, the limited concentration of monomer dissolved in the continuous phase begin to propagate using radicals generated to form continuous phase soluble oligoradicals. Initially, particle formation was believed to occur following a micellar nucleation pathway described by Smith and Ewart.18 According to this theory, micelles present in the continuous phase resulting from being above the critical micellar concentration (CMC) of surfactant stabilises monomer. The entry of an oligoradical into a micelle forms a new particle owing to the rapid polymerisation of monomers within the micelle. Oligoradical entry into the monomer droplets is very unlikely due to their large size and therefore low surface area of monomer droplet available for entry. Following the Smith-Ewart theory,
Interval I ends when the concentration of surfactant drops below the CMC, stopping the
11 However, it was soon discovered that in other monomer systems, the surfactant concentration had little overall effect on particle number and that stable particles could easily be formed without surfactant entirely.19 This ultimately led to the alternative homogenous nucleation model20–24 developed by Hansen, Ugelstad, Fitch and Tsai (HUFT theory) which describe the growth of oligomeric radicals in the continuous phase until a critical chain length solubility threshold Jcrit, above which the juvenile chain collapses into a primary particle. Depending on the stability of these particles and the availability of emulsifying species, the primary particles coagulate until the particle surface is sufficiently stabilised. Interval I ends in this case when no new particles form. These events are summarised schematically in figure 1.3
12
Interval II is defined by a constant polymerisation rate. The monomer consumed within
the growing particles is replenished by diffusion from the monomer droplets, through the continuous phase and into the growing particles. At this stage, the particles can accommodate only one radical. The compartmentalised radicals cannot react with radicals in other particles, leading to an elevated polymerisation rate compared with bulk and solution polymerisations. Entry of a second radical into the particle terminates the polymerisation within the particle, only to be re-started upon the entry of a further third radical. As such, a growing particle has an average of 0.5 radicals during Interval II; however, this number can be lower due to radical exit into the continuous phase or higher in the case of large or high viscosity particles. This is known as zero-one kinetics and was quantitatively theorised by Smith and Ewart.18 It is worth noting that a deviation from
zero-one kinetics can occur with larger particles (greater than 60 nm for styrene). Due to
an increased size, the particle can accommodate more than one propagating radical without termination, leading to pseudo-bulk kinetics as seen in Interval III.
When the monomer droplets have been exhausted, the polymerisation enters Interval III and the rate of polymerisation slows due to the decreasing concentration of monomer in the particles. At this point, monomer content in the continuous phase is also depleted and leads to very high conversions in emulsion polymerisations. In some cases, the increased viscosity due to lack of monomer inside the particles can permit more than one radical
(pseudo-bulk). As such, the number average radicals per particle increases leading to a
13 1.3.2 Dispersion polymerisation
Dispersion polymerisation provides a highly convenient and reliable method to make polymeric particles between 0.1 - 15 µm diameter. Micron sized particles are utilised in a variety of commercial applications including column packing materials, toners, instrument calibration standards, components in LCD displays and biomedical assays.27– 29
Prior to the widespread application of dispersion polymerisation; first developed in the 1960’s by ICI,30
the synthesis of micron sized particles was troublesome owing to the intermediate size range lying between particle sizes readily obtained by emulsion (10 - 700 nm) and suspension (50 - 1000 µm) polymerisation. Seeded emulsion polymerisation,31 two stage swelling systems32 and the dynamic swelling method33 have successfully been developed as alternative routes to fabricate monodisperse micron sized particles.
Typically, a dispersed polymerisation system begins as a homogeneous mixture of monomer, solvent, steric stabiliser and initiator.34 The solvent is often a non-aqueous solvent, such as methanol or ethanol. The monomer employed is soluble in the solvent, but upon polymerisation above a critical chain length, the oligomer becomes insoluble in the reaction medium and collapses into a primary particle.
14 particles thereby providing a steric barrier against coagulation. The most common stabilisers deployed for conventional dispersion polymerisation are poly(vinyl pyrrolidone), hydroxylpropylcellulose (and related cellulose esters), poly(acrylic acid), poly(methacrylic acid) and poly(vinyl alcohol).27,35,36 However, as the polymeric stabiliser presents on the outer surface of the particle, functionality can be imparted to the particle dispersions through the stabiliser. As a result, Tseng et al. used various co-stabilisers to manufacture particles with hydroxyl, carboxyl, amide and silane surface functionalities.37
Until fairly recently, successful crosslinking in dispersion polymerisations has been difficult to control. Crosslinking agents such as divinylbenzene cannot be added in batch to styrenic polymerisations above 0.6 wt% as this invariably causes coagulation due to the high sensitive nature of the nucleation stage in dispersive polymerisation systems.37 However, recent reports of using EGDMA, seeded dispersion or semi-batch methods incorporating co-monomers after the nucleation stage have allowed crosslinking.38–40
Mechanism of dispersion polymerisation
15 Prior to initiation, the components of the polymerisation form a homogenous solution. After initiation, polymer chains grow in solution until a critical length at the threshold of their solubility (molecular weight of the polymer is directly proportional to solubility). These chains collapse into unstable primary particles which rapidly coalesce to a point at which they become sterically stabilised with sufficient polymeric stabiliser chains covering the particle surface. This is referred to as ‘critical point’. Beyond this, no further
particles develop. Any nuclei or primary particles formed in the solvent phase after critical point are captured by the particles. Polymerisation proceeds inside the particles until monomer source is exhausted. This process is depicted in figure 1.4.
Figure 1.4 A schematic model for the particle nucleation and growth of sterically stabilised particles in dispersion polymerisation. Reproduced from Kawaguchi43
16
Figure 1.5 Schematic representation of mechanisms involved in free radical dispersion polymerisation
Control over particle properties
17 1.3.3 Suspension polymerisation
Conceptually the simplest heterogeneous polymerisation, whereby the monomer is insoluble in the continuous phase and the initiator is soluble in the monomer. The reaction mixture is agitated to form monomer droplets, stabilised by the presence of a surfactant to restrict coalescence. Polymerisation occurs within the droplets leading to a relative polydisperse size distribution similar to the monomer emulsion. Typical size range 2 µm – 1 mm diameter
1.3.4 Precipitation polymerisation
Similar to dispersion polymerisation by the fact that the initial reaction mixture is homogeneous, however, particles do not swell with monomer. This is usually due to the high degree of crosslinking or monomer-polymer incompatibility as in the cases of polymerisation of divinylbenzene and acrylonitrile respectively. Particle growth is attributed to the precipitation of oligomeric chains onto the particle surface, often impairing a rough topology to the particles. Typical size range: 10 nm – 1000 nm diameter.
1.3.5 Miniemulsion polymerisation
18 during initiation, leading to polymerisation within the droplets. Typical size range 10 nm - 500 nm diameter.
Two types of heterogeneous polymerisations that generate polymer colloids are used extensively in this thesis to manufacture a specific class of particles so named Janus particles. An introduction to the field of ‘Janus particles’ and the wide range of synthetic
techniques used to manufacture them is given below. A more comprehensive introduction to particular synthetic routes and applications of Janus particles is explored in the relevant chapter.
1.4 Janus particles
19 1.4.1 Toposelective surface modification
[image:44.612.236.413.268.427.2]One of the most simple and intuitive methods to fabricate Janus particles involves the partial surface modification of one hemisphere of a spherical colloid, without altering the other. This has been demonstrated effectively by several routes. In particular by embedding in a film,57 gel trapping58 and embedding in a photo resist layer59 prior to chemical treatment of the unprotected hemisphere.
Figure 1.6 Schematic depicting the variety of different methods to manufacture Janus particles by toposelective surface modification. (a) embedding in a film and treating exposed side, (b) directional flux of material, (c) microcontact printing, (d)
partial contact with reactive media56
20 provides route to manufacturing particles by toposelective surface modification in bulk quantities.
1.4.2 Template directed assembly
A different approach involves the assembly of colloidal precursor particles using the external influence of a template. By using lithography, 1-D and 2-D dimensional templates can define the morphology of the assembled cluster through geometric confinement before annealing the particles together.64 Examples of which are displayed in figure 1.7(a).
Figure 1.7 (a) Use of templates to geometrically confine particles of different size and (b) assembly of gold nanoparticles onto silica particles by deposition through a
microporous membrane to render Janus particles
Microporous membranes have also been used as templates to attach single or chains of gold nanoparticles onto aminated silica particles, rendering a ‘snowman’ or ‘tadpole’
21 1.4.3 Controlled surface nucleation
The controlled growth of a particle nucleated from the surface of a seed particle to render ‘snowman’, ‘acorn’ and ‘dumbbell’ shaped particles has been achieved by using
22 1.4.4 Microfluidics
Microfluidic devices provide a powerful technique to manufacture Janus particles on the micrometre scale. Spherical chemically anisotropic Janus particles can be made through jetting two monomers into a co-flow device before post-polymerisation as seen in figure 1.8(a). Varying flow rates changes respective hemispherical ratio and can form ternary particles.73 Using a co-flow technique, many variations of Janus particles have been demonstrated including magnetic,74 hydrophilic-hydrophobic via double emulsion75 and hydrogel-colloidal particle aggregate hybrids.76 Although generally confined to the micrometre scale, biphasic electrified jetting has also been used to obtain Janus droplets of nanoscale dimensions.77
Figure 1.8 (a) Microfluidic co-flow jetting device forming hemispherical Janus monomer droplets which are polymerised by a UV source.73 (b) Quadruple co-flow
device using a mask and UV source to pattern highly complex Janus particles for medical diagnostics52
23 microfluidics do suffer from high scalability issues, limiting its use commercially to high-end biomedical screening and drug delivery.
1.4.5 Phase separation phenomena
A final method to render Janus particles is through phase separation, the formation of a secondary entity from a ‘seed’ particle. This has been achieved in both inorganic and polymeric systems. Core-shell inorganic particles have been demonstrated to phase separate as a result of a chemical reaction with one of the components. Silver particles with a silica shell lead to the formation of secondary silver lobe in the presence of molecular iodine, a strong oxidising agent (figure 1.9).78 Metastable FePt core CdS shell particles were shown to phase separate upon heating due to the incompatibility of the FePt and CdS lattice.79
Figure 1.9 Phase separation of a metastable FePt core from a CdS shell upon heating. An example of synthesising Janus particles from inorganic phase
separation78
24 synthetic route towards Janus particle synthesis is attractive owing to the ability to conduct reactions in bulk, using relatively inexpensive and simple experimental techniques.
1.5 Chocolate: from a colloidal perspective
In the latter part of this thesis, we investigate the replacement of fat content in chocolate with water by use of Pickering stabilised emulsions (chapter 5) and hydrogel dispersions (chapter 6); therefore a background of chocolate formulation and properties from a colloidal perspective is given below.
Chocolate is one of the many real-life examples of food colloids which, like most colloidal systems rely on the interplay of forces at the mesoscale to produce the desired
macroscopic eating qualities it possesses. Chocolate is a complex material, which when
molten can be described as a multiphase fluid dispersion of solid non-fat particles comprising mainly of sugar crystals and cocoa solids in a fat continuous phase. The fat phase is generally a mixture of cocoa butter and milk fats. The composition ratio of these major components varies between formulations, whereby white chocolate contains no cocoa solids and a large quantity of cocoa and milk fats, whereas dark chocolate can contain over 70% cocoa solids (by weight) and little fat. Aside from taste, the major ‘eating quality’ of chocolate arises from its texture upon consumption, a desirable
macroscopic behaviour that the consumer benefits from. In addition there are a wide
25 liquid and solid centres. Therefore a variety of manufacturing approaches are employed, of which many will require the flowability of chocolate component of the product to be tuned to allow practical manufacture. Both consumption texture and flow of chocolate during processing are physical properties, governed by colloidal interactions.
1.5.1 Rheology of chocolate
The flow behaviour of molten chocolate is of high importance for chocolate manufacturers due to the reasons given above. Viscosity alone is insufficient to describe the flow characteristics of chocolate, due to its more complex rheological properties. Instead, it can be described as a pseudoplastic fluid, whereby a certain shear force is required to initiate flow, so named yield stress. Once flowing, the chocolate then adopts a non-Newtonian flow profile where viscosity is proportional to applied shear force, so named plastic viscosity. These two components are combined in the form of the Casson equation,82 used widely in industry to characterise the rheology of chocolate. This model is described in depth in chapter 6, part 3.9. The effect of yield stress is important in terms of shape retention of the formulation.
Figure 1.10 (left) misshapen enrobed chocolate products with ‘feet’ resulting from insufficient yield stress. (right) Effect of yield stress on coating chocolate biscuits.
26 As shown in figure 1.10; a high yield stress is required for products with decorative markings, and a low yield stress is required for thin coatings of chocolate over biscuits. Plastic viscosity is an important factor in the thickness of chocolate coatings, whereby a lower viscosity results in thinner coatings. In aerated products, viscosity affects the bubble size within the chocolate matrix (figure 1.11). Furthermore, higher viscosity chocolate requires increased pumping costs.
Figure 1.11 Effect of plastic viscosity of chocolate on bubble size in aerated products83
27
Figure 1.12 Influence of particle size distribution on Casson plastic viscosity and yield stress of chocolate. (1) 30% fat; (2) 32% fat84
This effect arises from the increased surface area of solid particulate as a result of the milling. The additional surface area requires more coating by the fat component of the chocolate, bringing particles closer together, eventually forming a loose network of solid particles. A greater force is needed to break up this network and induce flow, hence a greater yield value. Therefore while smaller particle distributions give an enhanced mouthfeel sensation, an undesired increase in yield stress may arise. This can be counteracted by the addition of more fat.
28
Figure 1.13 Influence of fat content on Casson plastic viscosity and yield value of chocolate. Fine (1) and coarse (2) particulate size distributions84
The use of emulsifiers as additives to chocolate formulations is commonplace in the confectionery industry. Emulsifiers are used essentially as lubricants for the solid particulates within the liquid fat matrix. Soy bean lecithin and polyglycerol