RESEARCH ARTICLE
Comparing thermal performance curves across traits: how
consistent are they?
Vanessa Kellermann1,*, Steven L. Chown1, Mads Fristrup Schou2, Ian Aitkenhead1,
Charlene Janion-Scheepers1,3, Allannah Clemson1, Marina Telonis Scott4and Carla M. Sgrò1
ABSTRACT
Thermal performance curves (TPCs) are intended to approximate the relationship between temperature and fitness, and are commonly integrated into species distributional models for understanding climate change responses. However, TPCs may vary across traits because selection and environmental sensitivity ( plasticity) differ across traits or because the timing and duration of the temperature exposure, here termed time scale, may alter trait variation. Yet, the extent to which TPCs vary temporally and across traits is rarely considered in assessments of climate change responses. Using a common garden approach, we estimated TPCs for standard metabolic rate (SMR), and activity in Drosophila melanogaster at three test temperatures (16, 25 and 30°C), using flies from each of six developmental temperatures (16, 18, 20, 25, 28 and 30°C). We examined the effects of time scale of temperature exposure (minutes/ hours versus days/weeks) in altering TPC shape and position, and commonly used descriptors of the TPC: thermal optimum (Topt), thermal limits (TminandTmax) and thermal breadth (Tbr). In addition, we collated previously published estimates of TPCs for fecundity and egg-to-adult viability in D. melanogaster. We found that the descriptors of the TPCs varied across traits (egg-to-adult viability, SMR, activity and fecundity), but variation in TPCs within these traits was small across studies when measured at the same time scales. The time scale at which traits were measured contributed to greater variation in TPCs than the observed variance across traits, although the relative importance of time scale differed depending on the trait (activity versus fecundity). Variation in the TPC across traits and time scales suggests that TPCs using single traits may not be an accurate predictor of fitness and thermal adaptation across environments. KEY WORDS:Topt, Metabolic rate, Activity, Fecundity, Egg-to-adult
viability, Plasticity
INTRODUCTION
Climate change is characterised by increasing mean temperatures and by an increase in the frequency and severity of extreme events (Easterling et al., 2000; Ummenhofer and Meehl, 2017). Surviving both rising mean temperatures and greater extremes will depend critically on the ability of organisms to maintain physiological processes by tracking their environment via phenotypic plasticity.
The importance of plasticity in climate change responses will depend on several factors: whether induced changes in the phenotype are adaptive, the speed of climate change and the degree to which behavioural responses will reduce the need for plastic responses and selection on key traits (Caillon et al., 2014; Chevin et al., 2010; Huey et al., 2012; Kearney et al., 2009; Seebacher and Murray, 2007). Understanding how plasticity might impact performance in response to environmental change is central for developing a mechanistic framework for predicting species responses to climate change. A commonly used framework for doing so is the thermal performance curve (TPC) (Deutsch et al., 2008; Huey et al., 2009; Kingsolver, 2009; Overgaard et al., 2014; Vasseur et al., 2014).
The TPC describes the relationship between a trait and body temperature (Tb) (Angilletta, 2009). TPCs take on a common shape
in ectotherms (Fig. S1) (Gilchrist, 1995; Huey and Stevenson, 1979)–an increasing phase reflecting biological rate processes and a declining phase describing the stressful effects of temperature on overall performance, the mechanisms of which remain uncertain (Kingsolver, 2009; Schulte et al., 2011). A number of elements/ descriptors of the TPC are used to compare TPCs within and between species (Huey and Stevenson, 1979). These descriptors include maximum performance (Pmax/Umax), optimum temperature
(Topt), performance breadth (Tbr) and thermal limits (TminandTmax).
Toptis the temperature of peak fitness or trait value;Tbris calculated
as the temperature range where performance is above an arbitrary threshold (i.e. 80–90%) and describes thermal sensitivity; and thermal limits are the temperature at which fitness is 0 and are defined byTminandTmax(Angilletta, 2009). The shape and position
of the TPCs may change over time via evolution, or more rapidly through acclimation (Angilletta, 2009). These changes may include a horizontal shift with resultant changes inToptand thermal limits, a
vertical shift with an increase or reduction in overall fitness (overall performance) and a width shift altering the viable thermal range, captured as performance breadth (Fig. S1) (Angilletta, 2009; Izem and Kingsolver, 2005; Sinclair et al., 2012).
TPCs are increasingly being integrated into models for understanding species responses to climate change (Deutsch et al., 2008; Hoffmann and Sgrò, 2011; Levy et al., 2015; Overgaard et al., 2014; Sinclair et al., 2016; Vasseur et al., 2014); however, such approaches make several assumptions that may contribute to uncertainty in the TPC and subsequent predictions of risk (Sinclair et al., 2016). In particular, studies that use single traits to estimate TPCs assume that traits do not vary in their thermal sensitivity, such that single-trait TPCs provide accurate predicators of thermal performance overall. Yet, work on snakes, caterpillars andDrosophila shows that different traits and even different life-stages can vary in their thermal sensitivity, producing different TPCs (David et al., 2005; Kingsolver and Woods, 1997; Stevenson et al., 1985; Woods and Harrison, 2002). An underlying assumption
Received 7 October 2018; Accepted 8 May 2019
1School of Biological Sciences, Monash University, Melbourne, VIC 3800, Australia. 2Department of Biology, Lund University, SE-223 62 Lund, Sweden.3Iziko
South African Museum, Cape Town 8001m, South Africa.4School of Life and
Environmental Sciences, Deakin University, Geelong, VIC 3220, Australia.
*Author for correspondence ([email protected])
V.K., 0000-0002-9859-9642; S.L.C., 6069-5105; M.F.S., 0000-0001-5521-5269; C.J.-S., 0000-0001-5942-7912
Journal
of
Experimental
of TPCs is that the thermal sensitivity of the trait in question approximates the thermal sensitivity of fitness (Huey and Berrigan, 2001). However, the direct association between commonly measured traits and clearly defined fitness measurements, such as
RO and r (intrinsic rate of increase and net reproductive rate,
respectively), is always assumed rather than quantified (Clusella-Trullas et al., 2010; Huey and Berrigan, 2001; Huey et al., 2012; Sinclair et al., 2016, 2012). More tractable traits are often favoured over direct estimates of fitness, because r and ROcan be labour
intensive to measure and difficult to quantify across a range of temperatures (Huey et al., 2012). Although r and RO are more
representative of fitness, these different measures can also have different TPCs (Huey and Berrigan, 2001). Moreover, commonly used traits in assessments of TPCs are often taxon specific, including running speed in reptiles (Hertz et al., 1983; Miles, 2004; Phillips et al., 2014) and viability, fecundity and development time for insects (Clemson et al., 2016; Foray et al., 2011; Klepsatel et al., 2013). These traits may represent different components of fitness.
Another source of variation in TPCs is that different traits inherently capture effects of temperature at different stages of development. For instance, many studies of TPCs focus on the short-term effects of temperature exposure (minutes to hours) on adults, typically assessing responses to hardening and adult acclimation treatments on traits such as rate of locomotion and metabolism (Deere and Chown, 2006; Logan et al., 2014; Overgaard et al., 2014). In contrast, traits such as development time and growth rate, which are measured across life-stages, typically involve longer time scales of exposure (days to months) and may reflect the combined effects of developmental and adult acclimation (Kingsolver and Woods, 1997; Klepsatel et al., 2013). The timing (life-stage) and duration (hardening versus developmental acclimation) of the temperature exposure may have profound effects on trait variation and thermal sensitivity. For example, in Manduca sexta, TPCs differed depending on whether growth rates were measured in the first 24 h (short time scale) or as the duration of the larval period (long time scale) (Kingsolver and Woods, 1997). Other studies assess thermal performance by measuring acute thermal tolerance, i.e. estimates of critical thermal minimum and maximum (CTmin and CTmax)
calculated from survival or righting of response assays, whileTopt
can be estimated from thermal preference assays (Clusella-Trullas et al., 2011; Huey et al., 2009; Kingsolver and Buckley, 2017). Whether estimates of thermal tolerance are useful proxies for full TPCs remains unclear (Haupt et al., 2017; Huey et al., 2012; Overgaard et al., 2014), but studies inDrosophilasuggest this might not be the case (Overgaard et al., 2014).
An added layer of complexity is the effect of previous thermal history on estimates of TPCs. Performance is a product not only of the current environment but also of previously experienced environments (Kellermann et al., 2017; Kingsolver et al., 2006; Kingsolver and Buckley, 2017; Tronick and Hunter, 2016). This means that TPCs from wild-caught individuals will largely be a product of their thermal history, rather than a reflection of responses to current conditions. That is, thermal performance of individuals from the field will be influenced not only by the temperatures they experience but also by the thermal regimes of their parents. Maternal and paternal effects are widely known to influence thermal performance inDrosophila(Gilchrist and Huey, 2001).
In the current study, we aimed to determine the extent to which TPCs depend on the time scale of exposure and traits measured to gain a better understanding of the uncertainty that surrounds predictions of risk when those predictions are based on TPCs. We examined whether different traits measured at different time scales
of temperature exposure produce comparable TPCs. Using a single population ofD. melanogaster, we estimated thermal performance over long time scales (after development at six temperatures: 16, 18, 20, 25, 28 and 30°C) and short time scales (adult test environment consisting of three temperatures: 16, 25 and 30°C) of exposure for metabolic rate and activity. To further explore how traits vary in their thermal response, we also compiled previously published estimates of thermal performance (viability and fecundity) in
D. melanogaster. All traits were assessed using a common garden design, therefore controlling for the effects of thermal history on the estimated TPCs.
MATERIALS AND METHODS Experimental populations
Thirty field inseminatedDrosophila melanogasterMeigen females were collected from Melbourne, Australia (37.8136°S, 144.9631°E) in 2014, using banana baits, and were maintained in the laboratory as separate iso-female lines for two generations. A mass-bred population was then established by pooling 10 virgin females and males from each iso-female line (totalling 600 flies per population), split into two 250 ml bottles containing potato–dextrose–agar medium. For each successive generation, each mass-bred population was maintained at 25°C under a 12 h:12 h light:dark cycle at a census population size of approximately 1000 individuals across three 250 ml bottles containing potato–dextrose–agar medium. Flies were placed onto fresh food every 2 days to minimise larval crowding, with emerging adults for consecutive generations taken from parental flies that were between 3 and 7 days old. Standard metabolic rate (SMR) and activity were estimated following 7–9 generations of mass breeding.
Developmental acclimation
Developmental acclimation effects on SMR and activity were examined by developing eggs to adulthood under six different constant temperature regimes: 16, 18, 20, 25, 28 and 30°C. Developmental density was controlled by picking 40 eggs into 20 vials per temperature. As developmental time varies across different thermal regimes (development time for the thermal regimes in days: 16°C: 20 days, 18°C: 16 days, 22°C: 11 days, 25°C: 9 days, 28/30°C: 8 days), egg picking was staggered so that adult flies would eclose from the different temperature regimes on the same day. Flies were collected over a 2 day period and the sexes separated using CO2anaesthesia 2–3 days post-eclosion. Flies were then given
2 days to recover post-CO2exposure (MacMillan et al., 2017), and
were 5–8 days of age at the time of assessment of SMR and activity.
Test temperature
We compared how a short temperature exposure at the adult life stage may influence the estimation of descriptors of the TPC for SMR and activity as opposed to long temperature exposure throughout development. We assayed the SMR and activity of adult flies at two extreme and one benign test temperature (16, 25 and 30°C). These temperatures were chosen such that they overlapped with the range of temperatures used during development. Prior to estimation of SMR and activity, flies were acclimated at the respective test temperatures for 30 min to allow them to settle and to obtain a more accurate estimation of SMR (Messamah et al., 2017).
SMR
Given it reflects the physiological and biochemical performance underpinning key traits, SMR is one of several relevant components of thermal adaptation. SMR was estimated on female flies only. For each test temperature, two rounds of assessment were performed
Journal
of
Experimental
across 3 days. Consequently, for each test temperature, two rounds of egg picking (1 week apart) were performed to minimise age differences of the focal flies (Lane et al., 2014; Terblanche et al., 2004). On each of the 3 days, two runs were performed in the morning and the afternoon (time of experiment in analyses), always at the same time to limit the effects of circadian rhythm on estimates of SMR. We utilised a blocked experimental design with developmental acclimation equally represented across all blocks (two runs per day across 3 days). For each run, 4–5 replicate individuals from each developmental temperature were assessed with a total of 52–59 individuals assessed per developmental temperature. Because of constraints in changing the temperature, test temperature could not be randomised across the three blocks, thus each block represents a different test temperature; as such, we were unable to examine an interaction between developmental and test temperature using the current design. Throughout the estimation of SMR, the activity of flies was estimated using theDrosophila
Activity Monitor (DAM2, TriKinetics, Waltham, MA, USA) system, described in detail below.
Respirometry set-up for measuring SMR
Carbon dioxide production (V̇CO2) was measured as a proxy for
resting metabolic rate. This was done using four LI-COR 7000 infrared CO2/H2O gas analysers (LICOR, Lincoln, NB, USA), each
attached to a Sable Systems International (SSI, Las Vegas, NV, USA) multiplexer system.
Two identical set-ups were created, each accommodating two LI-COR 7000 analysers. For each set-up, compressed air was directed through Bev-A-Line tubing to three scrubber columns which scrubbed the airstream of CO2and water vapour, ensuring a
dry, CO2-free airflow. The airstream was then split using a PVC
T-split and the flow rate set to 25 ml min−1using a Sierra 840 series
mass flow valve controlled by an MFC-2 (SSI) mass flow controller, which was then directed to the LI-COR 7000, where an initial CO2
measurement was taken. It was then directed into an MUX2 intelligent multiplexer (SSI), which housed the animals, and then back to the LI-COR 7000, where a second CO2reading was taken;
the difference between these two measurements was taken as the
V̇CO2reading.
Each MUX2 housed eight, 1 ml chambers (Trikinetics). Seven chambers contained a single D. melanogaster while the eighth chamber was empty and served as a baseline to account for machine drift throughout the experiment. Each of the eight chambers was placed into a DAM2 to allow for the simultaneous estimation of activity during the experiment. The MUX2 was interfaced with a computer using a UI-2 universal interface (SSI), and was programmed to sequentially measure each chamber using the software Expedata (SSI). Each chamber was measured 3 times for 5 min, with a 2 min pause period between every measurement to allow time for the CO2 readings to stabilise. To reduce potential
detrimental effects of desiccation, the chambers were flushed with a humidified air flow (above 90% relative humidity) between measurements. This was achieved using a second compressed gas flow, which was again scrubbed of CO2and H2O vapour and directed
to a Sierra 840 series mass flow valve controlled by an MFC-2 mass flow controller, setting the flow to 25 ml min−1. This air flow was
then bubbled through a weak sodium hydroxide solution and directed to the flush input of the MUX2.
The mass of each individual was recorded at the end of each trial using a Metter-Toledo XP2U microbalance (Metter Toledo, Greifensee, Switzerland). Mass was recorded in milligrams to the nearest 0.1 µg. The experiments were performed in controlled
temperature rooms set at 16, 25 and 30°C and the temperature monitored via a type-K thermocouple (Omega Engineering Inc., Stamford, CT, USA) attached to a TC-2000 thermocouple meter (SSI).
Data extraction for SMR
Data were extracted using Expedata and baseline corrected. SMR was estimated by inserting markers over the lowest 30 s of each of the three 5 minV̇CO2recordings, and the values extracted using a macro.
The mean of these values served as the measure ofV̇CO2for each
individual. At each marker (as above) the activity of the individuals was extracted from the DAM2 recordings and averaged. These data served as a measure of metabolic activity in further analysis.
Locomotor activity
Activity was measured in two separate experiments. Firstly, it was estimated simultaneously with SMR measurements (described above) and used to account for activity effects in estimates of SMR. In a separate experiment, activity was estimated across the same developmental and test temperatures as described for SMR but was done so in a randomised design such that all developmental and test temperatures were tested in the same runs. Activity in this second experiment was estimated on 10 female flies per developmental and assay temperature, using the DAM2 system. Each monitor can record the activity of 25 chambers (5 mm diameter×45 mm length), where activity is recorded as the number of times a fly crosses a laser beam at the centre of the chamber. We used locomotor activity as a measure of performance as it has been linked to fitness inDrosophila melanogasterbut is also thought to be linked to reproductive success, dispersal and predator avoidance, and is strongly correlated with walking speed (Burnet et al., 1988; Gilchrist, 1996; Latimer et al., 2011; Long and Rice, 2007; Roberts et al., 2003). Activity was estimated across 2 days with two runs performed at 09:00 h and 13:00 h each day. At each assay temperature, for each run, five replicates per developmental temperature were assessed using two DAM2 activity monitors with replicates randomly assigned to each position within the DAM2 monitor.
Published data
We searched the ISI Web of Science database to compare previously published estimates of TPCs inD. melanogasterwith the current dataset. We used the search terms ‘thermal performance curve(s)+Drosophila’and‘thermal performance+Drosophila’. We only included studies where performance was estimated in more than three different acclimation treatments and where thermal history was controlled. We found eight published studies matching our criteria (Clemson et al., 2016; Cohet et al., 1980; Condon et al., 2014; Cooper et al., 2010; Klepsatel et al., 2013; Overgaard et al., 2014; Petavy et al., 2001; Schou et al., 2017). Of these, we were able to obtain the raw data for six studies (Clemson et al., 2016; Condon et al., 2014; Cooper et al., 2010; Klepsatel et al., 2013; Overgaard et al., 2014; Schou et al., 2017), while for two studies (Cohet et al., 1980; Petavy et al., 2001) data were extracted from figures with the program ImageJ. Through this program you can define thex- and
y-axis of a scanned figure, which then allows the estimation of figure values. This involved scanning the image and defining the
x- andy-axis. When egg-to-adult viability had been obtained as a percentage, we transformed the data into proportions using the number of eggs collected in the given study. Three studies examined TPCs in fecundity (Condon et al., 2014; Cooper et al., 2010; Klepsatel et al., 2013), another three examined TPCs in egg-to-adult
Journal
of
Experimental
viability (Cohet et al., 1980; Petavy et al., 2001; Schou et al., 2017), and two studies examined TPCs in both fecundity and egg-to-adult viability (Clemson et al., 2016; Overgaard et al., 2014). All experiments were performed on wild-caught strains that had been in the laboratory between 6 months and 4 years. Petavy et al. (2001) and Schou et al. (2017) were reared at 20°C; for all other studies, flies were reared at 25°C.
Studies examining TPCs for fecundity can examine the combined effects of developmental and adult acclimation (individuals developed and reared under the same temperatures: long time scales) or can focus on the effects of adult acclimation (individuals developed at a single temperature with fecundity estimated across a range of test temperatures: short time scales). Of the five studies that examined fecundity, two examined the effects of temperature across long time scales (Clemson et al., 2016; Klepsatel et al., 2013), while three examined effects across short time scales (Condon et al., 2014; Cooper et al., 2010; Overgaard et al., 2014). A broader thermal range (11–36°C) was investigated in the published studies, except for that of Clemson et al. (2016), who investigated the same thermal range as the current study (16–30°C). For the Condon et al. (2014) dataset, only results from the lines exposed to selection at a constant 25°C, and from flies measured after development at 25°C were examined. For the Cooper et al. (2010) dataset, only results from lines measured across all temperatures including 36°C were examined (12 of 30 lines; the remaining 18 lines were not assessed at 36°C).
Analyses
TPCs of SMR and activity
We examined the role of developmental and test temperatures on metabolic rate (SMR) using general linear mixed models with the R-package (v.3.3.2) lme4 v.1.1-15 (Bates et al., 2015; https://cran.r-project.org/web/packages/lme4/index.html). Because test temperature was not randomised across blocks, separate general linear mixed models were created for each test temperature (16, 25 and 30°C). The full models included the fixed effects of developmental temperature, activity and mass and all possible interactions among the three. The effect of developmental temperature was modelled as a quadratic as it was assumed to span both sides ofTopt, and scaled (mean=0 and s.d.=1) to avoid
non-independence of the temperature and temperature-squared. Activity and mass were also scaled. Effects of the time of the experiment and experimental block were accounted for by including time as a random effect in the models. The experimental set-up for activity, estimated independently from SMR, was fully randomised, allowing for the construction of a single model including all test temperatures. As activity is count data, it was modelled using a generalised linear model (GLM) with a Poisson distribution and log link. Because of over-dispersion in the model, the standard errors were corrected using a quasi-GLM (Zuur et al., 2009). The full model for activity included developmental temperature (scaled) as a quadratic fixed effect, test temperature (scaled) as a linear fixed effect, as well as the interactions between the two fixed effects.
For both activity and metabolic rate, the full models (see above) were validated by a model comparison against the null model, containing only the random effects. As the full models were significant for both activity and metabolic rate, we proceeded to identify the minimal adequate model (Crawley, 2013). P-values were obtained by comparing the full model with a reduced model in which the highest order interaction term had been omitted. If a term was non-significant, it was omitted from the full model, which was then further reduced to evaluate the significance of another term and
so forth. Model comparisons for activity were done usingF-tests because of the use of a quasi-GLM, whereas for metabolism we used likelihood ratio tests. Visual inspection of model diagnostic plots showed that the assumptions of parametric analyses were fulfilled in all models.
TPCs of published data
To make the analyses for the published datasets comparable to the above analysis, we used the same analytical framework. For all studies, we initially modelled temperature (scaled) as a quadratic effect, but visual inspection revealed a poor fit of the model for the fecundity data, except for those of Overgaard et al. (2014), and we therefore used a cubic smoothing spline (Wood, 2004). These models were then used to infer descriptors of the TPCs (see below). For model fits, see Fig. S2.
For each published study, slightly different analytical methods were used that best fitted each dataset. Fecundity data from Overgaard et al. (2014), Cooper et al. (2010), Klepsatel et al. (2013) and Clemson et al. (2016) were modelled with a generalised additive model (gam) using a cubic smoothing spline to model the effect of temperature. The Condon et al. (2014) fecundity dataset was modelled using a gam with a negative binomial distribution and cubic smoothing spline to model the effect of temperature. For Condon et al. (2014), Cooper et al. (2010) and Klepsatel et al. (2013), the variation across temperature between different replicate lines was modelled as random intercepts and slopes. All models including a smoothing spline were constructed using the R-package ‘MGVC’v.1.8-23 (Wood, 2004), and with the number of knots set to the number of assessed temperatures and smoothing optimisation by REML.
Egg-to-adult viability (Clemson et al., 2016) was modelled using a logistic regression with developmental temperature as a quadratic effect, a typically observed shape for viability (Cohet and David, 1978). No over-dispersion was detected in the model. However, in the egg-to-adult viability data from Schou et al. (2017), Cohet et al. (1980), Overgaard et al. (2014) and Petavy et al. (2001), over-dispersion was detected when modelled with a logistic regression, with developmental temperature as a quadratic effect; consequently, we added an observation level random effect. The Cohet et al. (1980) egg-to-adult viability data contained different populations and we therefore included random slopes and intercepts for the replicate populations to account for any population-level differences in trait responses.
Descriptors of TPCs
Optimum temperature (Topt), thermal tolerance (TminandTmax) and
thermal breadth (Tbr) were extracted from the models described
above. Because we compared TPCs across studies that used very different methods, we did not attempt to compare maximal performance (Pmax/Umax), which is likely to be highly confounded
by experimental protocol and rearing conditions.Tbrwas calculated
as the temperature range where performance was above an 80% threshold (Huey et al., 2012; Huey and Stevenson, 1979).Tbrhas
classically been used as a measure of specialisation, i.e. a narrowTbr
is indicative of a specialist phenotype while a broadTbrsuggests a
generalist phenotype (Angilletta, 2009), and as suchTbrcan be used
as a measure of the flatness of the TPC. As activity and viability represent count data, the correct model choice (see above) results in the model fit approaching zero via an asymptote. This gives an estimation ofTmin andTmaxat zero a limited biological meaning;
consequently, we calculated Tminand Tmaxas the temperatures at
which performance was 5% of maximum performance (see Fig. S1);
Journal
of
Experimental
to make it comparable across traits, we did this for all traits. To estimate confidence in the TPC descriptors and to be able to compare the descriptors across traits and studies, we generated 95% confidence intervals (CIs) via non-parametric/parametric bootstrapping, essentially generating 10,000 curves and estimating the descriptors from each curve. Because several types of models were implemented (described above), it was necessary to use different bootstrapping approaches. For datasets where cubic spline models and quasi-Poisson models were the most appropriate models, we used non-parametric bootstrap (n=10,000) to estimate 95% CI. When multiple independent populations/lines were present in the model, a descriptor was estimated for each population/line and then averaged across populations/line in every sampling round of the non-parametric bootstrap; 95% CIs were then estimated from these averages. For datasets utilising linear models, parametric bootstraps (n=10,000) of the minimal adequate models using the function boot in the R-package boot v.1.3-20 were employed (https://cran.r-project.org/package=boot). For datasets modelled with linear mixed models, we estimated the 95% CI by parametric bootstraps (n=10,000) of the minimal adequate models using the function bootMer in lme4 (Bates et al., 2015). The random effects were also bootstrapped (use.u=FALSE). As the effect of developmental temperature on SMR was dependent on mass and activity, we report descriptor estimates and CIs at the median mass and activity. Because the developmental thermal regimes investigated did not encompass the entire performance curve for some traits (SMR in the current study and two published studies of viability: Clemson et al., 2016; Schou et al., 2017), we were unable to estimate with confidenceTmin and Tmaxfor these traits; therefore, we refrained
from including these in our comparisons.
For activity, measured independently from SMR, there was no interaction between test temperature and developmental temperature and thus different test temperatures produced comparable developmental temperature TPCs; as such, tests temperatures were combined to give one value forTopt,Tmin,TmaxandTbr.
RESULTS Metabolic rate
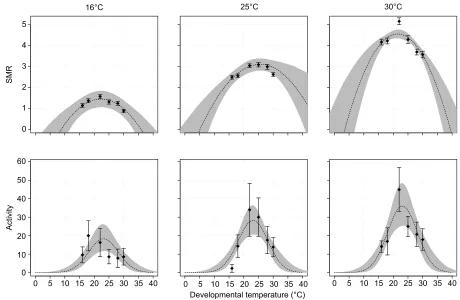
The effect of developmental temperature on metabolic rate was fairly consistent and significant across the three test temperatures; metabolic rate was reduced at the cooler and hotter developmental temperatures (Table 1, Fig. 1). Increasing test temperature (16, 25, 30°C) increased metabolic rate, with test temperature having larger effects on metabolic rate than developmental temperature (Fig. 1).ToptandTbr
were higher at a test temperature of 25°C than at test temperatures of 16 and 30°C, but significantly so only for Topt (see 95% CI in
Table S1). The experimental design did not allow examination of the interaction between test and developmental temperature because test temperature was not randomised across all blocks.
[image:5.612.45.585.414.708.2]For all three test temperatures, body mass had a significant effect on SMR (Table 1), such that larger flies tended to have a higher SMR. The effect of activity on SMR was significant for the 16°C test temperature, with more active flies showing a higher SMR. Activity did not have a significant effect on SMR at the test temperature of 25°C, but at 30°C there was a negative effect of activity on SMR via a significant interaction with body mass. Body mass tended to be larger at the cooler developmental temperatures and decreased with increasing developmental temperature, while activity was lower at the coldest and hottest temperatures. A significant body mass×temperature interaction was also detected
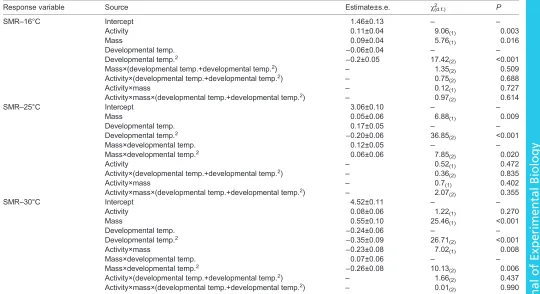
Table 1. Generalised linear (mixed) models examining the effects of developmental temperature on standard metabolic rate (SMR)
Response variable Source Estimate±s.e. χ2
(d.f.) P
SMR–16°C Intercept 1.46±0.13 – –
Activity 0.11±0.04 9.06(1) 0.003
Mass 0.09±0.04 5.76(1) 0.016
Developmental temp. −0.06±0.04 – –
Developmental temp.2 −0.2±0.05 17.42
(2) <0.001
Mass×(developmental temp.+developmental temp.2) – 1.35
(2) 0.509
Activity×(developmental temp.+developmental temp.2) – 0.75
(2) 0.688
Activity×mass – 0.12(1) 0.727
Activity×mass×(developmental temp.+developmental temp.2) – 0.97
(2) 0.614
SMR–25°C Intercept 3.06±0.10 – –
Mass 0.05±0.06 6.88(1) 0.009
Developmental temp. 0.17±0.05 – –
Developmental temp.2 −0.20±0.06 36.85
(2) <0.001
Mass×developmental temp. 0.12±0.05 – –
Mass×developmental temp.2 0.06±0.06 7.85
(2) 0.020
Activity – 0.52(1) 0.472
Activity×(developmental temp.+developmental temp.2) – 0.36
(2) 0.835
Activity×mass – 0.7(1) 0.402
Activity×mass×(developmental temp.+developmental temp.2) – 2.07
(2) 0.355
SMR–30°C Intercept 4.52±0.11 – –
Activity 0.08±0.06 1.22(1) 0.270
Mass 0.55±0.10 25.46(1) <0.001
Developmental temp. −0.24±0.06 – –
Developmental temp.2 −0.35±0.09 26.71
(2) <0.001
Activity×mass −0.23±0.08 7.02(1) 0.008
Mass×developmental temp. 0.07±0.06 – –
Mass×developmental temp.2 −0.26±0.08 10.13
(2) 0.006
Activity×(developmental temp.+developmental temp.2) – 1.66
(2) 0.437
Activity×mass×(developmental temp.+developmental temp.2) – 0.01
(2) 0.990
Model comparisons were done with likelihood ratio tests. Developmental temperature, mass and activity were scaled (mean=0, s.d.=1) before model fitting. Effect sizes from the minimal adequate model of each response trait are reported.P-values for main effects involved in significant interactions were obtained by
disregarding the interaction, while reported estimates of these main effects are from the minimal adequate model.
Journal
of
Experimental
when metabolic rate was measured at test temperatures of 25 and 30°C. Because estimates of wet mass were calculated after estimation of metabolic rate was completed, flies at the test temperature of 30°C were likely to have lost more water (and therefore have reduced wet mass) than flies at other test temperatures, and this is likely to have driven the size×temperature interaction observed at this temperature.
Activity
Developmental temperature had a significant effect on activity, assessed independently from SMR, with activity displaying a classic TPC shape: increasing activity with increasing temperature at low temperatures and declining activity at hotter temperatures (Table 2, Fig. 1). Developmental temperature tended to have a larger effect on activity than test temperature, with absolute differences in activity across the developmental temperatures ranging from 29.55 to 55.15 (activity measured as the number of times a fly crosses a laser beam at the centre of the chamber, averaged over 3 h).
While activity significantly increased with test temperature, we found no significant interaction between test temperature and developmental temperature. Thus, while activity increased with test temperature, reflected in a vertical shift in the TPC, the width (i.e. breadth) and horizontal position of the curve did not change. Because the shape of the developmental temperature TPC did not change across test temperatures, further dissection of the activity TPC descriptors was performed on a single curve, combining test temperatures.
TPCs:Topt, thermal limits (TminandTmax) andTbr
Topt
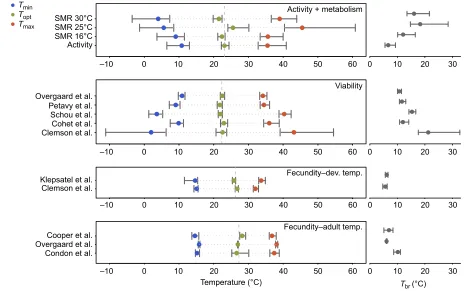
Across all traits and studies, thermal optima (Topt) differed by up to
6.7°C, ranging from 21.47 to 28.21°C (Fig. 2; Table S1). Within viability and fecundity, irrespective of the timing of the temperature exposure (short versus long time scales),Toptvaried between 1.1
and 2.4°C across studies. In contrast,Toptfor SMR varied by up to
4°C across test temperatures (short time scale). The highest values of
Toptwere found for fecundity (28.21°C), which was significantly
higher thanToptfor egg-to-adult viability (Table S1: 95% CIs did
not overlap). Developmental TPCs for SMR estimated at test temperatures 16 and 30°C produced qualitatively similar estimates ofTopt, while significantly higher estimates ofToptwere found for
TPCs tested at 25°C (95% CIs did not overlap) (Table S1).
Thermal tolerance:TminandTmax
Across the different traits and studies, excluding traits with broad 95% CIs, thermal tolerance varied between 6.13 and 6.84°C forTmin
andTmax, respectively (Table S1). Estimates ofTminandTmaxwere
similar across studies for viability and for fecundity but only when looking within the same timing of the temperature exposure
SMR
16°C 25°C 30°C
5
4
3
2
1
0
Developmental temperature (°C) 60
50
40
30
20
10
0
Activity
[image:6.612.75.535.56.356.2]0 5 10 15 20 25 30 35 40 0 5 10 15 20 25 30 35 40 0 5 10 15 20 25 30 35 40
Fig. 1. Thermal performance curves (TPCs) for standard metabolic rate (SMR) and activity of flies developed at six temperatures (16–30°C).SMR and activity (counts of flies crossing a beam) were estimated at three test temperatures (16, 25 and 30°C). Data points reflect the mean SMR (n=52–59) and activity (n=10), with error bars showing one standard error. The grey shading reflects the 95% confidence intervals of the fitted curve. The extrapolation to extreme developmental temperatures is not for inference but to visualise the uncertainty of estimates of, for example, thermal limits (TminandTmax).
Table 2. Generalised linear (mixed) models examining the effects of test temperature and developmental temperature on activity
Source Estimate±s.e. F(d.f.) P
Intercept 3.28±0.14 – –
Test temp. 0.28±0.10 8.43(1,177) <0.001
Developmental temp. 0.00±0.11 – –
Developmental temp.2 −0.50±0.13 7.73
(2,178) <0.001
Test temp.×(developmental
temp.+developmental temp.2) –
1.12(2,176) 0.327
Developmental temperature and test temperature were scaled (mean=0, s.d.=1) before model fitting. Effect sizes from the minimal adequate model of
each response trait are reported.
Journal
of
Experimental
[image:6.612.48.302.634.706.2]treatments (short versus long time scales). Fecundity produced higher estimates ofTminthan did viability and activity but the 95%
CIs overlapped when comparing trait groups (fecundity, activity and viability); having said that, 95% CIs did not overlap for some studies (Table S1). No significant differences inTmaxwere found
between fecundity, activity and viability. However, the time scale at which fecundity was estimated produced qualitatively different estimates of Tmax (Fig. 2; Table S1). Measurements of the TPC
based on flies developed and acclimated at the same temperature (Clemson et al., 2016; Klepsatel et al., 2013) produced significantly lower estimates ofTmaxthan measurements of fecundity based on
adult acclimation alone (Condon et al., 2014; Cooper et al., 2010; Overgaard et al., 2014) (Table S1).
Tbr
Across traits and studies, the average Tbr was ∼12°C ranging
from 5.60°C (fecundity) to 20.70°C (viability). Similar to the other descriptors, estimates of Tbr were more consistent within
traits across studies than between traits (Table S1; Fig. 2). In general, TPCs for fecundity were narrower than other traits, with the 95% CI for Tbr not overlapping any other trait except
activity. Viability showed the widest Tbr and hence the flattest
TPCs of all the traits, indicating that viability does not vary much across temperature.
DISCUSSION
TPCs are increasingly being used to bring a mechanistic approach to understanding species responses to climate change (Deutsch et al.,
2008; Huey et al., 2009, 2012; Levy et al., 2015; Overgaard et al., 2014; Vasseur et al., 2014). The strength of the predictions from this approach will depend on the accuracy of the TPC descriptors used to parametrise the models. However, the relationship between performance and temperature may depend on the trait measured and the time scale at which measurements occur (minutes/hours versus days/months) (Kingsolver et al., 2015). Many traits are estimated at fewer than four temperatures and the degree to which reliable estimates ofTopt,Tbrand thermal limits (Tmax/Tmin)
can be made when obtained over so few temperatures is also unclear (Kingsolver et al., 2013; Murren et al., 2014). Using
D. melanogaster, we examined TPCs for metabolic rate and activity, and collated previously published data on TPCs for fitness-related traits: fecundity and egg-to-adult viability. We show that variation in the descriptors of the TPC (Topt,Tmin,TmaxandTbr) tend to be more
consistent for the same trait across studies than between traits. We also show that the time scale at which traits are measured (short versus long time scales of exposure) can have large effects on estimates of Tmax and Tbr, descriptors often used in models of
climate change responses.
TPCs varied across the traits examined and the time scales at which the traits were measured. Across all traits, the descriptors of the TPC varied considerably, with a tendency for fecundity to produce higher estimates ofToptthan the other traits. Within traits,
measured at the same time scale, all descriptors varied less, suggesting a high level of repeatability of the TPC within traits across studies. Variation in the descriptors and shape of the TPCs could be suggestive of different types of selection acting on the Tmin
Topt
Tmax
Activity + metabolism
Viability
Fecundity–dev. temp.
Fecundity–adult temp. SMR 30°C
SMR 25°C SMR 16°C Activity
Overgaard et al. Petavy et al. Schou et al. Cohet et al. Clemson et al.
Clemson et al. Klepsatel et al.
Cooper et al. Overgaard et al. Condon et al.
Temperature (°C)
–10 0 10 20 30 40 50 60 0 10 20 30
–10 0 10 20 30 40 50 60 0 10 20 30
–10 0 10 20 30 40 50 60 0 10 20 30
–10 0 10 20 30 40 50 60 0 10 20 30
[image:7.612.70.534.58.349.2]Tbr (°C)
Fig. 2. Thermal limits, thermal optimum and thermal breadth.Estimation of thermal limits (Tmin,Tmax), optimum (Topt) and breadth (Tbr) and their 95%
confidence intervals from TPCs for SMR (metabolism) and activity of flies developed at six temperatures and tested at three. Estimates of TPCs for
previously published data for egg-to-adult viability (development) and fecundity are also shown. TPCs for fecundity were estimated either following development at a range of temperatures (long time scales) or for adults exposed to a range of temperatures (short time scales). Data were obtained from the following studies: Overgaard et al. (2014), Petavy et al. (2001), Schou et al. (2017), Cohet et al. (1980), Clemson et al. (2016), Klepsatel et al. (2013), Cooper et al. (2010) and Condon et al. (2014).
Journal
of
Experimental
different traits to produce narrow and wider TPCs. Of the traits examined, viability and metabolic rate produced broad TPCs suggestive of stabilising selection reducing trait variation to produce stable phenotypes across environments (Falconer and Mackay, 1997; Stearns et al., 1995). But differences in the shape and width of TPCs could also occur for mechanistic reasons. For example, wider TPCs for metabolic rate could represent differences in the cost of maintaining biological functions across different temperatures (Clarke, 1993). Yet, the similarity between the descriptors and the shape of the TPC for metabolic rate with other traits may also suggest that metabolic rate is under selection. Variation in TPCs across traits and time scales, particularly for fecundity, is suggestive of labile TPCs, although low within-trait variation could also be indicative of constraints.
Consistent with the idea that the time scale at which traits are measured will impact the shape of the TPC (Kingsolver and Buckley, 2017; Kingsolver and Woods, 2016), we found fecundity measured at longer time scales (developmental acclimation) produced broader curves and significantly lower estimates ofTmax
than fecundity measured at shorter time scales (adult acclimation). In addition, the TPC of metabolic rate measured at 25°C (short time scale) produced a significantly higher estimate ofToptthan the TPC
of metabolic rate estimated at a test temperature 16 or 30°C. Not all traits were as sensitive to changes in test temperature as metabolic rate; while increasing test temperature (short-time scale) increased activity, there was no effect of test temperature on the actual shape and descriptors of the TPC for this trait. Differences in trait sensitivity to temperature changes are likely to reflect the underlying mechanisms and the speed at which a plastic response is induced (Schulte et al., 2011; Sgrò et al., 2016); inDrosophila, the induction of the heat shock response occurs within a matter of minutes (Telonis-Scott et al., 2013), while cold acclimation can take weeks and is highly dependent on temperature and the number of exposures (Marshall and Sinclair, 2012; Rako and Hoffmann, 2006; Slotsbo et al., 2016). Different traits also capture the effects of temperature exposure at different stages of development. Intrinsic rate of increase, for example, captures the effects of temperature across all life-stages, while traits such as viability, fecundity or running speed capture different aspects of developmental and adult responses to temperature. Thus, the trait-dependent nature of the effects of exposure will affect the TPCs and the conclusions that can be drawn. The relevance of the descriptors of the TPCs, as predictors of climate change responses, measured at short- or long-time scales (adult versus developmental acclimation) may depend on how the effects of changes in the mean temperature and variation in climate will shape species fitness. Rapid responses, reflected in the ability of the TPC to change in response to short time scales of exposure, may be more important for coping with rapid temperature fluctuations. However, the relative importance of a rapid response may also depend on the frequency and duration of climate fluctuations (Hochachka and Somero, 2004). If fluctuations are relatively rare, then rapid responses may not be under strong selection, particularly if these responses are costly (Gabriel, 2006). Climatic fluctuations will vary across environments (Kingsolver and Buckely, 2017), meaning that rapid responses may be more important for species that experience regular climate fluctuations, such as species occupying mid-latitudes. For these species, rapid responses and TPCs measured over short time scales of exposure (hardening/adult acclimation) may capture the critical responses for responding to climate change. However, for low-latitude species that experience relatively stable environments, TPCs measured over long time scales of exposure (developmental acclimation) may be more
important. It is also likely that responses to climate change will be dictated by a combination of responding to short and long time scales of exposure (hardening, adult and developmental acclimation) and the relative importance of these different components of plasticity will depend on the daily average temperatures and the frequency and duration of climatic fluctuations (Dillon et al., 2016; Marshall and Sinclair, 2012).
The ability to accurately estimate TPC descriptors will in part depend on the number and breadth of temperatures examined. Despite the use of six temperatures in the current study to examine TPCs, they did not span the full viable temperature range of
Drosophilaand resulted in large CIs for estimates ofTminandTmax
for SMR, although our confidence inToptwas high. This highlights
the difficulty with obtaining accurate descriptors of TPCs, where the number and choice of temperature range will often trade-off with confidence in different descriptors of the TPC (Huey et al., 2012). In addition, a common problem with the estimation of TPCs is that model choice can have a large impact on estimation of the descriptors (Angilletta, 2006). In the current study, we chose to re-analyse all the data without consideration of how previous studies had analysed their data or the models they had used. Despite likely differences in these methods, we found that our estimates ofTopt
(the most common descriptor) did not differ significantly from those reported (Clemson et al., 2016; Cohet et al., 1980; Klepsatel et al., 2013). Note that most of the studies did not explicitly measure the descriptors of the TPC, despite their discussions often centring on the TPC framework (Condon et al., 2014; Cooper et al., 2010; Overgaard et al., 2014; Petavy et al., 2001; Schou et al., 2017).
Here, we have attempted to capture some of the sources of uncertainty in TPCs within a species. There are, however, other factors that will contribute to variation in the TPC that are seldom captured. In particular, TPCs are mostly measured under constant temperature conditions, yet populations and species rarely experience stable temperatures in nature, and fluctuating temperatures have the potential to change many aspects of the TPC (Colinet et al., 2015; Kingsolver et al., 2004; Niehaus et al., 2012). Whether fluctuating temperatures will have a large impact on the shape or position of the TPC is not that clear. Klepsatel et al. (2013) produced similar estimates for fecundityToptto those of the
current study using ecologically realistic fluctuating thermal regimes. Plasticity for heat resistance (measured as acute dynamic
Tmax, notTmaxfrom a TPC) also did not differ when measured on
flies developed under fluctuating versus constant environments (van Heerwaarden et al., 2016). However, constant-temperature TPCs were poor predictors of fitness in marsh frogs, suggesting the need to incorporate fluctuating temperatures into estimates of the TPC (Niehaus et al., 2012). Previous thermal history (the environments experienced by individuals which may be unknown if individuals are collected from the field prior to assessments) may also drive variation in the TPC. Specifically, developmental temperatures can affect all aspects of fitness and thermal tolerance (Chown and Terblanche, 2007; Kingsolver et al., 2015; van Heerwaarden et al., 2016) and their effects are unlikely to be reversed by extended periods of laboratory acclimation (Kellermann et al., 2017). The extent to which TPCs vary across populations also remains poorly understood, although Klepsatel et al. (2013) found little variation in
Toptacross broadly distributedDrosophilapopulations, suggesting
there may be little inter-population variation in TPCs. Finally, biotic interactions, such as predation and competition, will also contribute to variation in the TPC (Davis et al., 1998; Luhring and DeLong, 2016). However, the degree to which biotic interactions will alter thermal preferences in nature remains poorly understood.
Journal
of
Experimental
TPCs have their advantages but also their disadvantages (Kingsolver and Buckley, 2017; Sinclair et al., 2016); their ease of use and interpretation means they have been employed in many streams of ecology and evolution and we can draw from historical datasets to examine variation in the TPC across species and environments (Deutsch et al., 2008). Other estimates of performance, such as acute thermal tolerance, may have the potential to provide better descriptors for thermal adaptation and species response to climate change (Overgaard et al., 2014). However, they are also unlikely to be a practical solution for many species where lethal assays of thermal limits are not feasible. Future studies should focus on the explicit consideration of the time scale of exposure, how different traits inherently reflect different time scales of exposure, i.e. viability versus activity, and how different traits will generate different TPCs. These sources of variation in the TPC will ultimately influence any predictions of species responses to climate change based on TPCs. Consideration of which traits are likely to be most important with respect to the time scale of environmental change itself, i.e. average temperatures versus extreme events, may be necessary for producing relevant predictors of species responses to climate change.
Acknowledgements
We are grateful to Fiona Beasley for technical assistance, and to the reviewers for their comments, which improved the manuscript.
Competing interests
The authors declare no competing or financial interests.
Author contributions
Conceptualization: V.K., S.L.C., C.J., C.M.S.; Methodology: V.K., S.L.C., I.A., C.J., A.C., M.T., C.M.S.; Software: S.L.C., M.S.; Validation: I.A., C.J.; Formal analysis: V.K., M.S.; Investigation: V.K., C.J.; Resources: S.L.C., M.T., C.M.S.; Data curation: V.K., S.L.C., I.A., C.J., A.C.; Writing - original draft: V.K., C.M.S.; Writing - review & editing: V.K., S.L.C., M.S., I.A., C.J., A.C., M.T., C.M.S.; Project administration: V.K.; Funding acquisition: V.K., S.L.C., C.M.S.
Funding
We thank Monash University and the Australian Research Council for financial support via their Discovery, Fellowship and Linkage schemes, and the Science and Industry Endowment Fund for support to C.M.S.
Data availability
Data have been deposited in the Dryad Digital Repository (Kellermann et al., 2019): doi:10.5061/dryad.9pc85c0.
Supplementary information
Supplementary information available online at
http://jeb.biologists.org/lookup/doi/10.1242/jeb.193433.supplemental
References
Angilletta, M. J.(2006). Estimating and comparing thermal performance curves.
J. Therm. Biol.31, 541-545. doi:10.1016/j.jtherbio.2006.06.002
Angilletta, M. J. (2009). Thermal Adaptation: A Theoretical and Empirical Synthesis. Oxford: Oxford University Press.
Bates, D., Mächler, M., Bolker, B. M. and Walker, S. C.(2015). Fitting linear mixed-effects models using lme4.J. Stat. Softw.67, 1-48. doi:10.18637/jss.v067.i01
Burnet, B., Burnet, L., Connolly, K. and Williamson, N.(1988). A genetic analysis of locomotor activity inDrosophila melanogaster.Heredity61, 111-119. doi:10. 1038/hdy.1988.96
Caillon, R., Suppo, C., Casas, J., Woods, H. A. and Pincebourde, S.(2014). Warming decreases thermal heterogeneity of leaf surfaces: implications for behavioural thermoregulation by arthropods.Funct. Ecol.28, 1449-1458. doi:10. 1111/1365-2435.12288
Chevin, L.-M., Lande, R. and Mace, G. M.(2010). Adaptation, plasticity, and extinction in a changing environment: towards a predictive theory.PLoS Biol.8, e1000357. doi:10.1371/journal.pbio.1000357
Chown, S. L. and Terblanche, J. S.(2007). Physiological diversity in insects: ecological and evolutionary contexts. InAdvances in Insect Physiology, Vol. 33 (ed. S. Simpson), pp. 50-152. London: Academic Press Ltd.
Clarke, A. (1993). Seasonal acclimatization and latitudinal compensation in metabolism: do they exist?Funct. Ecol.7, 139-149. doi:10.2307/2389880
Clemson, A. S., Sgro, C. M. and Telonis-Scott, M.(2016). Thermal plasticity in
D. melanogasterfrom eastern Australia: quantitative traits to transcripts.J. Evol. Biol.29, 2447-2463. doi:10.1111/jeb.12969
Clusella-Trullas, S., Terblanche, J. S. and Chown, S. L.(2010). Phenotypic plasticity of locomotion performance in the seed harvesterMessor capensis
(Formicidae).Physiol. Biochem. Zool.83, 519-530. doi:10.1086/651387
Clusella-Trullas, S., Blackburn, T. M. and Chown, S. L.(2011). Climatic predictors of temperature performance curve parameters in ectotherms imply complex responses to climate change.Am. Nat.177, 738-751. doi:10.1086/660021
Cohet, Y. and David, J. R.(1978). Control of the adult reproductive potential by preimaginal thermal conditions.Oecologia36, 295-306. doi:10.1007/BF00348055
Cohet, Y., Vouidibio, J. and David, J. R.(1980). Thermal tolerance and geographic distribution: a comparison of cosmopolitan and tropical endemicDrosophila
species.J. Therm. Biol.5, 69-74. doi:10.1016/0306-4565(80)90002-9
Colinet, H., Sinclair, B. J., Vernon, P. and Renault, D.(2015). Insects in fluctuating thermal environments.Ann. Rev. Entomol.60, 123-140. doi:10.1146/annurev-ento-010814-021017
Condon, C., Cooper, B. S., Yeaman, S. and Angilletta, M. J.(2014). Temporal variation favors the evolution of generalists in experimental populations of
Drosophila melanogaster.Evolution68, 720-728. doi:10.1111/evo.12296
Cooper, B. S., Czarnoleski, M. and Angilletta, M. J.(2010). Acclimation of thermal physiology in natural populations ofDrosophila melanogaster: a test of an optimality model.J. Evol. Biol.23, 2346-2355. doi:10.1111/j.1420-9101.2010.02095.x
Crawley, M. J.(2013).The R book Chichester. Wiley & Sons.
David, J. R., Gibert, P., Legout, H., Pétavy, G., Capy, P. and Moreteau, B.(2005). Isofemale lines inDrosophila: an empirical approach to quantitative trait analysis in natural populations.Heredity94, 3-12. doi:10.1038/sj.hdy.6800562
Davis, A. J., Jenkinson, L. S., Lawton, J. H., Shorrocks, B. and Wood, S.(1998). Making mistakes when predicting shifts in species range in response to global warming.Nature391, 783-786. doi:10.1038/35842
Deere, J. A. and Chown, S. L.(2006). Testing the beneficial acclimation hypothesis and its alternatives for locomotor performance.Am. Nat.168, 630-644. doi:10. 1086/508026
Deutsch, C. A., Tewksbury, J. J., Huey, R. B., Sheldon, K. S., Ghalambor, C. K., Haak, D. C. and Martin, P. R.(2008). Impacts of climate warming on terrestrial ectotherms across latitude.Proc. Natl. Acad. Sci. USA105, 6668-6672. doi:10. 1073/pnas.0709472105
Dillon, M. E., Woods, H. A., Wang, G., Fey, S. B., Vasseur, D. A., Telemeco, R. S., Marshall, K. and Pincebourde, S.(2016). Life in the frequency domain: the biological impacts of changes in climate variability at multiple time scales.Integr. Comp. Biol.56, 14-30. doi:10.1093/icb/icw024
Easterling, D. R., Meehl, G. A., Parmesan, C., Changnon, S. A., Karl, T. R. and Mearns, L. O.(2000). Climate extremes: observations, modeling, and impacts.
Science289, 2068-2074. doi:10.1126/science.289.5487.2068
Falconer, D. S. and Mackay, T. F. C.(1997).Introduction to Quantitative Genetics. UK: Longman Press.
Foray, V., Gibert, P. and Desouhant, E.(2011). Differential thermal performance curves in response to different habitats in the parasitoidVenturia canescens.
Naturwissenschaften98, 683-691. doi:10.1007/s00114-011-0818-8
Gabriel, W.(2006). Selective advantage of irreversible and reversible phenotypic plasticity.Archiv Fur Hydrobiol.167, 1-20. doi:10.1127/0003-9136/2006/0167-0001
Gilchrist, G. W.(1995). Specialists and generalists in changing environments 1. Fitness landscapes of thermal sensitivity.Am. Nat.146, 252-270. doi:10.1086/ 285797
Gilchrist, G. W.(1996). A quantitative genetic analysis of thermal sensitivity in the locomotor performance curve ofAphidius ervi.Evolution50, 1560-1572. doi:10. 1111/j.1558-5646.1996.tb03928.x
Gilchrist, G. W. and Huey, R. B.(2001). Parental and developmental temperature effects on the thermal dependence of fitness inDrosophila melanogaster.
Evolution55, 209-214. doi:10.1111/j.0014-3820.2001.tb01287.x
Haupt, T. M., Sinclair, B. J. and Chown, S. L.(2017). Thermal preference and performance in a sub-Antarctic caterpillar: a test of the coadaptation hypothesis and its alternatives.J. Insect Physiol.98, 108-116. doi:10.1016/j.jinsphys.2016. 12.006
Hertz, P. E., Huey, R. B. and Nevo, E.(1983). Homage to Santa Anita: thermal sensitivity of sprint speed inAgamidlizards.Evolution37, 1075-1084. doi:10. 1111/j.1558-5646.1983.tb05634.x
Hochachka, P. W. and Somero, G. N.(2004).Biochemical Adaptation: Mechanisms and Process in Physiological Evolution. Oxford, New York: Oxford University Press.
Hoffmann, A. A. and Sgro, C. M.(2011). Climate change and evolutionary adaptation.Nature470, 479-485. doi:10.1038/nature09670
Huey, R. B. and Berrigan, D.(2001). Temperature, demography, and ectotherm fitness.Am. Nat.158, 204-210. doi:10.1086/321314
Huey, R. B. and Stevenson, R. D.(1979). Integrating thermal physiology and ecology of ecotherms: a discussion of approaches.Am. Zool.19, 357-366. doi:10. 1093/icb/19.1.357
Huey, R. B., Deutsch, C. A., Tewksbury, J. J., Vitt, L. J., Hertz, P. E., Álvarez Perez, H. J. and Garland, T., Jr.(2009). Why tropical forest lizards are vulnerable to climate warming.Proc. R. Soc. B Biol. Sci.276, 1939-1948. doi:10.1098/rspb.
2008.1957
Journal
of
Experimental
Huey, R. B., Kearney, M. R., Krockenberger, A., Holtum, J. A. M., Jess, M. and Williams, S. E.(2012). Predicting organismal vulnerability to climate warming: roles of behaviour, physiology and adaptation.Philos. Trans. R. Soc. B Biol. Sci.
367, 1665-1679. doi:10.1098/rstb.2012.0005
Izem, R. and Kingsolver, J. G.(2005). Variation in continuous reaction norms: quantifying directions of biological interest.Am. Nat.166, 277-289. doi:10.1086/ 431314
Kearney, M., Shine, R. and Porter, W. P.(2009). The potential for behavioral thermoregulation to buffer“cold-blooded”animals against climate warming.Proc. Natl. Acad. Sci. USA106, 3835-3840. doi:10.1073/pnas.0808913106
Kellermann, V., Chown, S. L., Schou, M. F., Aitkenhead, I., Janion-Scheepers, C., Clemson, A., Telonis Scott, M. and Sgro, C. M. (2019). Data from: Comparing thermal performance curves across traits: how consistent are they? Dryad Digital Repository. doi:10.5061/dryad.9pc85c0
Kellermann, V., Van Heerwaarden, B. and Sgrò, C. M.(2017). How important is thermal history? Evidence for lasting effects of developmental temperature on upper thermal limits inDrosophila melanogaster.Proc. R. Soc. B Biol. Sci.284, 20170447. doi:10.1098/rspb.2017.0447
Kingsolver, J. G.(2009). The Well-Temperatured Biologist.Am. Nat.174, 755-768. doi:10.1086/648310
Kingsolver, J. G. and Buckley, L. B.(2017). Quantifying thermal extremes and biological variation to predict evolutionary responses to changing climate.Philos. Trans. R. Soc. B Biol. Sci.372, 20160147. doi:10.1098/rstb.2016.0147
Kingsolver, J. G. and Woods, H. A.(1997). Thermal sensitivity of growth and feeding in Manduca sexta caterpillars.Physiol. Zool.70, 631-638. doi:10.1086/ 515872
Kingsolver, J. G. and Woods, H. A.(2016). Beyond thermal performance curves: modeling time-dependent effects of thermal stress on ectotherm growth rates.
Integr. Comp. Biol.187, 283-294. doi:10.1086/684786
Kingsolver, J. G., Izem, R. and Ragland, G. J.(2004). Plasticity of size and growth in fluctuating thermal environments: comparing reaction norms and performance curves.Integr. Comp. Biol.44, 450-460. doi:10.1093/icb/44.6.450
Kingsolver, J., Shlichta, J. G., Ragland, G. J. and Massie, K. R.(2006). Thermal reaction norms for caterpillar growth depend on diet.Evol. Ecol. Res.8, 703-715.
Kingsolver, J. G., Diamond, S. E. and Buckley, L. B.(2013). Heat stress and the fitness consequences of climate change for terrestrial ectotherms.Funct. Ecol.
27, 1415-1423. doi:10.1111/1365-2435.12145
Kingsolver, J. G., Higgins, J. K. and Augustine, K. E. (2015). Fluctuating temperatures and ectotherm growth: distinguishing non-linear and time-dependent effects.J. Exp. Biol.218, 2218-2225. doi:10.1242/jeb.120733
Klepsatel, P., Gáliková, M., De Maio, N., Huber, C. D., Schlötterer, C. and Flatt, T.
(2013). Variation in thermal performance and reaction norms among populations ofDrosophila melanogaster.Evolution67, 3573-3587. doi:10.1111/evo.12221
Lane, S. J., Frankino, W. A., Elekonich, M. M. and Roberts, S. P.(2014). The effects of age and lifetime flight behavior on flight capacity in Drosophila melanogaster.J. Exp. Biol.217, 1437-1443. doi:10.1242/jeb.095646
Latimer, C. A. L., Wilson, R. S. and Chenoweth, S. F.(2011). Quantitative genetic variation for thermal performance curves within and among natural populations of
Drosophila serrata.J. Evol. Biol.24, 965-975. doi:10.1111/j.1420-9101.2011. 02227.x
Levy, O., Buckley, L. B., Keitt, T. H., Smith, C. D., Boateng, K. O., Kumar, D. S. and Angilletta, M. J.(2015). Resolving the life cycle alters expected impacts of climate change.Proc. R. Soc. B Biol. Sci.282, 20150837. doi:10.1098/rspb. 2015.0837
Logan, M. L., Cox, R. M. and Calsbeek, R.(2014). Natural selection on thermal performance in a novel thermal environment.Proc. Natl. Acad. Sci. USA111, 14165-14169. doi:10.1073/pnas.1404885111
Long, T. A. F. and Rice, W. R.(2007). Adult locomotory activity mediates intralocus sexual conflict in a laboratory-adapted population ofDrosophila melanogaster.
Proc. R. Soc. B Biol. Sci.274, 3105-3112. doi:10.1098/rspb.2007.1140
Luhring, T. M. and DeLong, J. P.(2016). Predation changes the shape of thermal performance curves for population growth rate.Curr. Zool.62, 501-505. doi:10. 1093/cz/zow045
MacMillan, H. A., Nørgård, M., MacLean, H. J., Overgaard, J. and Williams, C. J. A. (2017). A critical test of Drosophila anaesthetics: Isoflurane and sevoflurane are benign alternatives to cold and CO2. J. Insect Physiol.101, 97-106. doi:10.1016/j.jinsphys.2017.07.005
Marshall, K. E. and Sinclair, B. J.(2012). The impacts of repeated cold exposure on insects.J. Exp. Biol.215, 1607-1613. doi:10.1242/jeb.059956
Messamah, B., Kellermann, V., Malte, H., Loeschcke, V. and Overgaard, J.
(2017). Metabolic cold adaptation contributes little to the interspecific variation in metabolic rates of 65 species of Drosophilidae.J. Insect Physiol.98, 309-316. doi:10.1016/j.jinsphys.2017.02.003
Miles, D. B.(2004). The race goes to the swift: fitness consequences of variation in sprint performance in juvenile lizards.Evol. Ecol. Res.6, 63-75.
Murren, C. J., Maclean, H. J., Diamond, S. E., Steiner, U. K., Heskel, M. A., Handelsman, C. A., Ghalambor, C. K., Auld, J. R., Callahan, H. S., Pfennig, D. W. et al.(2014). Evolutionary change in continuous reaction norms.Am. Nat.
183, 453-467. doi:10.1086/675302
Niehaus, A. C., Angilletta, M. J., Sears, M. W., Franklin, C. E. and Wilson, R. S.
(2012). Predicting the physiological performance of ectotherms in fluctuating thermal environments.J. Exp. Biol.215, 694-701. doi:10.1242/jeb.058032
Overgaard, J., Kearney, M. R. and Hoffmann, A. A.(2014). Sensitivity to thermal extremes in AustralianDrosophilaimplies similar impacts of climate change on the distribution of widespread and tropical species. Glob. Change Biol. 20, 1738-1750. doi:10.1111/gcb.12521
Petavy, G., David, J. R., Gibert, P. and Moreteau, B.(2001). Viability and rate of development at different temperatures inDrosophila: a comparison of constant and alternating thermal regimes.J. Therm. Biol.26, 29-39. doi:10.1016/S0306-4565(00)00022-X
Phillips, B. L., Llewelyn, J., Hatcher, A., Macdonald, S. and Moritz, C.(2014). Do evolutionary constraints on thermal performance manifest at different organizational scales?J. Evol. Biol.27, 2687-2694. doi:10.1111/jeb.12526
Rako, L. and Hoffmann, A. A.(2006). Complexity of the cold acclimation response inDrosophila melanogaster.J. Insect Physiol.52, 94-104. doi:10.1016/j.jinsphys. 2005.09.007
Roberts, S. P., Marden, J. H. and Feder, M. E. (2003). Dropping like flies: Environmentally induced impairment and protection of locomotor performance in adultDrosophila melanogaster.Physiol. Biochem. Zool.76, 615-621. doi:10. 1086/376922
Schou, M. F., Kristensen, T. N., Pedersen, A., Karlsson, B. G., Loeschcke, V. and Malmendal, A.(2017). Metabolic and functional characterization of effects of developmental temperature inDrosophila melanogaster.Am. J. Physiol. Regul. Integr. Comp. Physiol.312, R211-R222. doi:10.1152/ajpregu.00268.2016
Schulte, P. M., Healy, T. M. and Fangue, N. A.(2011). Thermal performance curves, phenotypic plasticity, and the time scales of temperature exposure.Integr. Comp. Biol.51, 691-702. doi:10.1093/icb/icr097
Seebacher, F. and Murray, S. A.(2007). Transient receptor potential ion channels control thermoregulatory behaviour in reptiles.PLoS ONE2, e281. doi:10.1371/ journal.pone.0000281
Sgrò, C. M., Terblanche, J. S. and Hoffmann, A. A.(2016). What can plasticity contribute to insect responses to climate change?Annu. Rev. Entomol. 61, 433-451. doi:10.1146/annurev-ento-010715-023859
Sinclair, B. J., Williams, C. M. and Terblanche, J. S.(2012). Variation in thermal performance among insect populations.Physiol. Biochem. Zool.85, 594-606. doi:10.1086/665388
Sinclair, B. J., Marshall, K. E., Sewell, M. A., Levesque, D. L., Willett, C. S., Slotsbo, S., Dong, Y. W., Harley, C. D. G., Marshall, D. J., Helmuth, B. S. et al.
(2016). Can we predict ectotherm responses to climate change using thermal performance curves and body temperatures?Ecol. Lett.19, 1372-1385. doi:10. 1111/ele.12686
Slotsbo, S., Schou, M. F., Kristensen, T. N., Loeschcke, V. and Sørensen, J. G.
(2016). Reversibility of developmental heat and cold plasticity is asymmetric and has long-lasting consequences for adult thermal tolerance.J. Exp. Biol.219, 2726-2732. doi:10.1242/jeb.143750
Stearns, S. C., Kaiser, M. and Kawecki, T. J.(1995). The differential genetic and environmental canalization of fitness components inDrosophila melanogaster.
J. Evol. Biol.8, 539-557. doi:10.1046/j.1420-9101.1995.8050539.x
Stevenson, R. D., Peterson, C. R. and Tsuji, J. S. (1985). The thermal dependence of locomotion, tongue flicking, digestion and oxygen compensation in the wandering garter snake.Physiol. Zool.58, 46-57. doi:10.1086/physzool.58. 1.30161219
Telonis-Scott, M., van Heerwaarden, B., Johnson, T. K., Hoffmann, A. A. and Sgrò, C. M.(2013). New levels of transcriptome complexity at upper thermal limits in wildDrosophilarevealed by exon expression analysis.Genetics195, 809-830. doi:10.1534/genetics.113.156224
Terblanche, J. S., Klok, C. J. and Chown, S. L.(2004). Metabolic rate variation in
Glossina pallidipes(Diptera : Glossinidae): gender, ageing and repeatability.
J. Insect Physiol.50, 419-428. doi:10.1016/j.jinsphys.2004.02.009
Tronick, E. and Hunter, R. G. (2016). Waddington, dynamic systems, and epigenetics.Front. Behav. Neurosci.10, 107. doi:10.3389/fnbeh.2016.00107
Ummenhofer, C. C. and Meehl, G. A.(2017). Extreme weather and climate events with ecological relevance: a review.Philos. Trans. R. Soc. B Biol. Sci. 372, 20160135. doi:10.1098/rstb.2016.0135
van Heerwaarden, B., Kellermann, V. and Sgro, C. M.(2016). Limited scope for plasticity to increase upper thermal limits.Funct. Ecol.30, 1947-1956. doi:10. 1111/1365-2435.12687
Vasseur, D. A., DeLong, J. P., Gilbert, B., Greig, H. S., Harley, C. D. G., McCann, K. S., Savage, V., Tunney, T. D. and O’Connor, M. I. (2014). Increased temperature variation poses a greater risk to species than climate warming.
Proc. R. Soc. B Biol. Sci.281, 20132612. doi:10.1098/rspb.2013.2612
Wood, S. N.(2004). Stable and efficient multiple smoothing parameter estimation for generalized additive models.J. Am. Stat. Assoc.99, 673-686. doi:10.1198/ 016214504000000980
Woods, H. A. and Harrison, J. F.(2002). Interpreting rejections of the beneficial acclimation hypothesis: when is physiological plasticity adaptive?Evolution56, 1863-1866. doi:10.1111/j.0014-3820.2002.tb00201.x
Zuur, A. F., Ieno, E. N. and Meesters, E. H. W. G.(2009).A Beginner’s Guide to R Preface. Beginner’s Guide to R, VII. Springer. doi:10.1007/978-0-387-93837-0