INTRODUCTION
Complex phenotypic traits, such as behavior and organismal performance, are emergent characters that arise from multiple systems which must interact in a coherent fashion. Understanding how these systems respond to changing environmental conditions is particularly challenging, because responses encompass several levels of organization involving multiple physiological functions. For example, it is well known that aerobic performance emerges from the interaction of numerous systems that contribute to the oxygen cascade [(Weibel, 1984; Wagner, 1996; Treacher and Leach, 1998; Richardson et al., 1999; Basset and Howley, 2000) and references therein], and that cold acclimation results in increased aerobic capacity in endothermic species. Consequently, responses to thermal acclimation or seasonal acclimatization include, but are not limited to, systems involved in oxygen delivery or associated with thermogenesis [e.g. the role of brown adipose tissue and noradrenaline as determinants of non-shivering thermogenesis (Heldmaier and Jablonka, 1985; Nespolo et al., 1999; Nespolo et al., 2001)]. Other physiological functions may also have to respond in a coherent fashion; hence, it is not surprising that acclimatory effects following chronic cold exposure are present in organs that process food (e.g. Zhao et al., 1995; del Valle et al., 2004) and remove waste (e.g. Inbar et al., 1975).
How traits involved in multiple processes at different levels of organization function in a coherent fashion is a central question in physiological studies of phenotypic plasticity and evolution (Garland and Kelly, 2006). In this context, aerobic metabolism is a good system for studying integrated responses for a variety of reasons. For instance, the physiological basis underlying aerobic performance
is well described, although discrepancies exist regarding how different steps in the oxygen cascade limit overall capacity (e.g. Bacigalupe and Bozinovic, 2002; Darveau et al., 2002). In addition, measurements of selection on aerobic performance in the field, and interspecific comparisons showing significant associations between performance and environmental characteristics, suggest this trait is important to fitness (Hayes and O’Connor, 1999; Rezende et al., 2004a). Ultimately, understanding the mechanistic foundations of aerobic metabolism involves determining which correlated responses occur at lower levels and the contribution of these responses to overall performance.
Studies of the functional and genetic basis of aerobic capacity, and its evolutionary relevance, can be classified into four major groups. First, there are comparative studies that attempt to correlate interspecific variation in aerobic capacity with differences in traits, such as cardiac output (Bishop, 1997). Second, selection experiments permit examination of correlated evolutionary responses to selection across multiple levels of organization (e.g. Ksiazek et al., 2004; Swallow et al., 2005; Rezende et al., 2006). Third, studies of individual variation in aerobic capacity within species or populations can disentangle the role played by different traits as determinants of overall capacity. Fourth, acclimation and acclimatization experiments can be used to understand how plastic responses at the organismal level are associated with changes at lower levels of physiological organization. These approaches can be employed in a complementary fashion. For instance, several studies have addressed how plasticity evolves in response to artificial selection [(Swallow et al., 2005; Garland and Kelly, 2006) and references therein], or how individual variation is affected by thermal The Journal of Experimental Biology 212, 2795-2802
Published by The Company of Biologists 2009 doi:10.1242/jeb.032789
Cold acclimation in Peromyscus: individual variation and sex effects in maximum
and daily metabolism, organ mass and body composition
Enrico L. Rezende
1,*, Kimberly A. Hammond
2and Mark A. Chappell
21Departament de Genètica i de Microbiologia, Facultat de Biociències, Universitat Autònoma de Barcelona, Bellaterra 08193, Spain
and 2Department of Biology, University of California, Riverside, CA 92521, USA
*Author for correspondence ([email protected])
Accepted 4 June 2009
SUMMARY
We studied metabolic and organ mass responses to thermal acclimation (7 weeks at 5°C or 23°C) in deer mice, Peromyscus maniculatus. Cold acclimation resulted in significantly higher maximal oxygen consumption in thermogenesis (VO2max) and daily mean oxygen consumption (VO2mean), an increase in the mass of most visceral organs, a lower absolute body fat and a marginally significant increase in hematocrit. The mass of digestive organs and body fat content differed significantly between sexes. Acclimation effects on fat content were more pronounced in females. Variation in heart and lung mass was positively correlated with VO2maxand VO2mean, while body fat content was negatively correlated with both traits. Nonetheless, a large fraction of the metabolic difference between cold- and warm-acclimated groups remained unexplained. Associations between traits at lower levels of biological organization measured here and whole-organism energetics remained consistent across acclimation temperatures, except for the correlation between kidney mass and VO2mean, which was positive and significant in cold acclimation and negligible following warm acclimation. We conclude that: (1) VO2maxand VO2meanshare a common physiological basis that remains overall the same across acclimation regimes; (2) changes in these traits are associated primarily with changes in heart mass; and (3) male and female deer mice respond differently to thermal acclimation, possibly due to differences in reproductive allocation.
acclimation or acclimatization (e.g. Rezende et al., 2004b; Szafranska et al., 2007).
Here we report how individual variation in mean daily energy expenditure (VO2mean) and maximum metabolic rate (maximum oxygen consumption; VO2max) in deer mice (Peromyscus maniculatus sonoriensisLe Conte) respond to thermal acclimation, and how these responses correlate with variations in organ mass, body composition and hematocrit. The prominent role of hypertrophy and elevated function of brown adipose tissue in cold acclimation has been well studied in a variety of mammals, including deer mice (Van Sant and Hammond, 2008). However, little is known about how other systems may change in response to thermal acclimation, and how these changes are associated with individual variation in VO2mean and VO2max. The goals of this study were to determine: (i) how VO2mean and VO2max are related within and across acclimation treatments; (ii) which traits at lower levels of biological organization respond to thermal acclimation; (iii) whether there is sexual dimorphism in the response to thermal acclimation in P. maniculatus; and (iv) how responses at lower levels correlate with responses at the whole-organism level. Peromyscus maniculatus has been employed in a variety of studies on thermoregulation and altitude adaptation (e.g. Snyder et al., 1988; Chappell and Snyder, 1984; Chappell, 1985; Hayes and O’Connor, 1999; Chappell et al., 2007), and we think the approach outlined here may be useful for addressing similar questions in other study systems.
MATERIALS AND METHODS
We worked with mice from a laboratory colony of P. m. sonoriensis maintained in captivity for at least four generations at the University of California, Riverside (elevation 340 m above sea level). The colony founders (38 individuals) were captured in the White Mountains of eastern California at a local altitude of about 3800 m above sea level. Thirty-nine adults were separated into two groups that were subjected to contrasting ambient temperatures (Ta=5°C
and 23°C). Both groups had initially been maintained at 23°C, and after subjecting one group to cold acclimation (20 individuals at Ta=5°C), body mass, food consumption, VO2max and ventilatory
variables were monitored every week during 7 weeks of acclimation (Rezende et al., 2004b). Deer mice were housed identically in standard plastic small mammal cages (27.5 cm L⫻17 cm W⫻ 12 cm H), and provided with bedding (wood shavings and cotton) and ad libitum water and rodent chow (LabDiet Rodent Diet 5001, Purina Mills, St Louis, MO, USA).
Apparent food consumption was estimated three times per week, and was calculated as the difference between food given and food remaining (crumbs were subtracted from apparent food consumption) divided by the elapsed time. Body mass remained constant in both groups during the last few weeks of acclimation. Therefore, we assumed that mice were in energetic equilibrium and used food consumption as a surrogate for daily energy expenditure. Mean daily oxygen consumption (VO2mean) was calculated assuming a food caloric content of 16.7 kJ g–1, a digestibility of 89% (Mueller
and Diamond, 2001), and the 0.0497 ml O2/J conversion. Although
changes in gut morphology following acclimation might affect digestibility and consequently VO2mean estimates, most studies suggest that acclimation affects primarily food consumption and gut capacity while digestibility remains relatively constant (e.g. Zhao et al., 1995; del Valle et al., 2004).
Rates of oxygen consumption (VO2) during cold exposure were measured with open-flow respirometry in an atmosphere of heliox (79% He, 21% O2). Heliox is severalfold more conductive than air
and elicits maximal thermogenesis at relatively moderate
temperatures (Rosenmann and Morrison, 1974; Chappell and Bachman, 1995). Briefly, mice were weighed and placed in the metabolism chamber at –5°C; the chamber was flushed with heliox for 1 min and VO2 was subsequently recorded for approximately 15 min. VO2maxwas estimated as the highest continuous 60 s average of VO2 [measurements are described in detail in Rezende et al. (Rezende et al., 2004b)]. We also calculated the ratio between daily VO2meanand VO2max(VO2mean/VO2max), to assess how much energy individuals spent on average with respect to their maximum aerobic capacity.
One day after their last metabolic trial, individuals were killed and dissected (mice were between 386 and 1031 days old, with a mean body mass ± s.e. of 24.5±0.5 g). We anesthetized mice (0.07 ml of 65 mg ml–1 sodium pentobarbitol injected i.p.) and obtained
replicate blood samples (approximately 150μl) with two heparinized microhematocrit tubes via retro-orbital puncture. Samples were centrifuged for 10 min at 1000g, and hematocrit was calculated as the mean proportion of packed cells relative to the total sample volume. After the mice had been killed (additional 0.1 ml of 65 mg ml–1sodium pentobarbitol injected i.p.), we dissected out the
visceral organs, removed all gut contents and measured the wet and dry mass of the heart, lungs, stomach, large and small intestines, cecum, liver, kidneys, spleen and carcass (i.e. head, feet, tail, musculoskeletal system and skin). Organs and carcass were dried for at least 48 h at 60°C and weighed again, and subsequently fat was extracted using petroleum ether (Kerr et al., 1982) in a Goldfische apparatus. Absolute fat content was estimated by subtraction (dry mass before extraction minus dry mass after extraction), and relative fat content was computed as a percentage of wet body mass.
All procedures were approved by the UC Riverside Institutional Animal Care and Use Committee (protocol # A-M 0408026 to K.A.H.) and conform to US National Institutes of Health Guidelines (NIH publication 78-23) and US laws.
Statistical analyses
During the last week of acclimation, raw and mass-independent food consumption were significantly repeatable across days for both cold-and warm-acclimated groups using pairwise Pearson correlations (1-tailed P<0.001 and P<0.014, respectively) or the intraclass correlation coefficient calculated from repeated-measures ANOVA [P<0.001 in both cases (Hayes and Jenkins, 1997; Rezende et al., 2005)]. Similarly, VO2maxwas highly repeatable between weeks 6 and 7 after controlling for body size and acclimation regime (Pearson R=0.695, 1-tailed P<0.001) and values did not differ between weeks (paired t-test, t38=0.40, P=0.692). Therefore, for
subsequent analyses we employed the mean of data gathered in weeks 6 and 7 as the estimate of daily VO2meanand the maximum estimate of VO2maxas more ‘reliable’ estimates of individual traits (see Hayes and Jenkins, 1997; Rezende et al., 2005).
The association between organ size, body composition, VO2max and daily VO2meanwas analyzed with multiple regressions controlling for differences in body size and acclimation regime. We employed dummy variables (0–1) to define acclimatory regime (warm vs cold) and sex; hence this model is mathematically analogous to a two-factor ANCOVA. We initially analyzed the effects of acclimation on organ size and body composition accounting for differences in body size and sex. Unless stated otherwise, models do not include the acclimation⫻sex interaction (most responses to acclimation did not differ significantly between sexes in preliminary analyses).
estimating the difference in VO2between warm- and cold-acclimated animals controlling for size and sex, analyses were repeated with the addition of one (or more) other variables to the model. If the acclimation effects were no longer significant following the inclusion of an additional variable, and the added variable was a significant predictor of VO2, we inferred that the variable partly accounted for the difference between acclimation groups. Conversely, if the difference between acclimation groups remained significant and its magnitude was unchanged after adding another variable to the model, then other traits probably accounted for the acclimation effects on VO2max[for similar analyses, see Rezende et al. (Rezende et al., 2006)]. The same approach was employed to determine which variables could underlie sex differences.
Subsequently, we analyzed how VO2max, daily VO2mean, organ size, body composition and hematocrit were correlated at the level of individual variation, accounting for the effects of body size and sex. In order to avoid statistical redundancy, we used dry carcass mass as a surrogate for body size relatively independent of other organs (see Christians, 1999; Nespolo et al., 2002). To visualize how acclimation might have affected the relationship between VO2max and VO2mean with subordinate traits, we estimated the partial correlation between these variables separately for cold- and warm-acclimated individuals, controlling for sex and dry carcass mass. The standard deviation of these partial correlations was estimated with bootstrap with replacement (1000 replicates). Briefly, a random sample of 20 individuals was obtained with replacement from the original sample, the partial correlation between variables was calculated 1000 times, and the standard deviation was obtained from this distribution.
Statistical significance was judged at α=0.05, and P-values presented are two-tailed unless otherwise noted. We tested directional hypotheses with one-tailed tests (e.g. VO2maxand food consumption were expected to increase with cold acclimation, correlations between heart and lung mass and VO2max were expected to be positive, etc.). Because multiple regression models were performed to analyze the association between each VO2 estimate and traits at lower levels of organization, statistical significance in these models was assessed after controlling for false discovery rates (Type I error) with the QVALUE program run as part of the R statistical package (The R Foundation for Statistical Computing, www.r-project.org/foundation/). Results were considered significant if the false discovery rate associated with each P<0.05 was smaller than 5% (i.e. q-value <0.05). All morphological indices were normally distributed (Kolmogorov– Smirnov P>0.202 in all cases) except for relative fat content and dry carcass mass. Visual inspections showed that the deviation from normality in relative fat content was due to a long tail of disproportionately high values for warm-acclimated females, hence log-transformation was applied only for dry carcass mass. Results are reported as means ± s.e.
RESULTS Acclimation effects
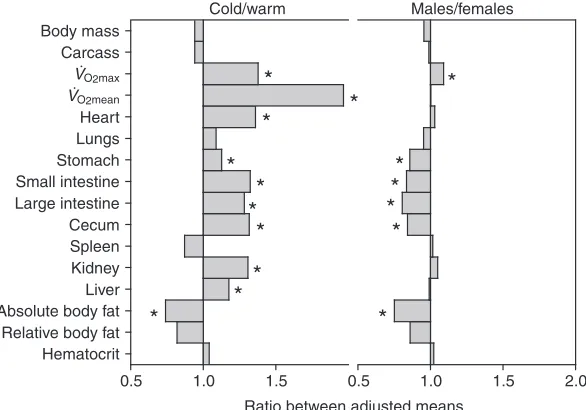
Males attained significantly higher VO2maxthan females (Fig. 1). In addition, total fat content and organs of the digestive system were significantly smaller in males (Table 1; Fig. 2). After controlling for body mass and sex, acclimation effects were statistically significant for VO2max, VO2mean, and mass of several organs including heart, digestive organs, kidney and liver (Table 1). Effects of cold acclimation were particularly apparent for VO2max and VO2mean, followed by increments in heart, digestive organs, kidney and liver mass (Fig. 2). These organs
increased in size with cold acclimation, concomitant with a significant reduction in absolute body fat content (Table 1). Significant acclimation⫻sex interactions in models without body mass show that the reduction in fat content following cold acclimation differs between sexes. In females, total fat content decreased 53% in response to cold acclimation (from 3.8 g in warm-acclimated females to 1.8 g in cold-acclimated females). The corresponding change in males was a 4% reduction (from 2.0 g to 1.9 g; acclimation⫻sex interaction P=0.028). Analyses of relative fat content yielded similar results: a 45% reduction in females (from 13.8% in warm-acclimated females to 7.6% in cold-acclimated females) and a 5% reduction in males (from 8.3% to 7.9%; P=0.036) (these mean estimates differ from values listed in Table 1 because of the inclusion of the acclimation⫻sex interaction in the model). Hematocrit increased after cold acclimation. This increase was significant (F1,36=4.37, 2-tailed P=0.044) after removing body mass as a
covariate, which was not significant in the full model (Table 1). Similar analyses including sex gave qualitatively similar results and the interaction was never statistically significant.
VO2
me
a
n
(ml O
2
min
–1
)
2 4 6
8
VO
2
m
a
x
(ml O
2
min
–1
)
3
5 7 9 11 13
M – cold F – cold
M – warm
F – warm
Cold
Warm
Body mass (g)
16 20 24 28 32 36
VO2
me
a
n
/
VO2
m
a
x
(%)
10 20
30
40 50 60 70
Cold
Warm
Fig. 1. Individual variation in maximum O2consumption (VO2max), mean
daily energy expenditure (VO2mean) and VO2mean/VO2maxin cold- and warm-acclimated Peromyscus maniculatus (filled and open symbols,
VO2maxand daily VO2mean
Individual variation of VO2meanand VO2maxwas positively correlated (1-tailed P=0.036) after controlling for acclimation, sex and body mass. This association was more pronounced in warm-acclimated animals (Fig. 3), indicated by a significant VO2mean⫻acclimation interaction (F1,33=7.01, P=0.012) in a multiple regression with VO2max as the dependent variable. Although VO2meanremained a significant predictor (F1,33=10.9, P=0.002), regressions performed
separately for both acclimation groups supported a significant association between VO2maxand VO2meanonly for warm-acclimated mice (F1,15=11.32, P=0.004; for cold-acclimated animals, F1,16=0.006, P=0.937).
Although both VO2mean and VO2max increased during cold acclimation (Fig. 1), cold-acclimated mice maintained daily VO2mean significantly closer to their aerobic ‘ceiling’ than warm-acclimated
animals (VO2mean was 47.2±1.8% and 33.7±1.9% of VO2max, respectively; F1,35=25.54, P<0.0001). Effects of body mass and sex
were not significant (P>0.213 in both cases). The acclimation⫻body mass interaction was not statistically significant when included in the regression analysis of VO2mean/VO2max(F1,34=3.22, P=0.081).
Body mass
[image:4.612.46.566.78.276.2]Dry carcass mass was the best predictor of wet body mass and explained 60% of the variance in multiple regressions (F1,36=54.0, P<0.0001), accounting for 27.9±4.5% of total wet body mass and 91.5±1.9% of total dry body mass. Dry whole-body mass was significantly correlated with all variables except kidney dry mass and hematocrit, whereas carcass dry mass correlated significantly only with liver dry mass and total and relative fat content (1-tailed P<0.05). Correlation coefficients were smaller for carcass mass
Table 1. Effects of sex, acclimation and body mass on morphological and physiological traits of Peromyscus maniculatus
Cold acclimated Warm acclimated Ratio
Males Females Males Females C/W M/F Pacclimation Psex Pbody mass
N 10 10 10 9
Body mass (g) 23.17±0.80 24.33±0.80 24.60±0.83 25.75±0.80 0.94 0.95 0.135 0.226
Carcass dry mass (g) 6.46 [5.97–7.00] 6.55 [6.06–7.07] 6.86 [6.34–7.43] 6.95 [6.42–7.53] 0.94 0.99 0.193 0.776 <0.0001 VO2max(ml min–1) 9.399±0.208 8.670±0.201 6.878±0.208 6.149±0.208 1.39 1.07 <0.0001 0.004 <0.0001 VO2mean(ml min–1) 4.241±0.189 4.239±0.183 2.157±0.189 2.155±0.189 1.97 1.00 <0.0001 0.993 0.030
Heart dry mass (g) 0.0495±0.0018 0.0483±0.0018 0.0365±0.0018 0.0353±0.0018 1.36 1.03 <0.0001 0.583 0.0003
Lung dry mass (g)a 0.0398±0.0012 0.0381±0.0012 0.0376±0.0012 0.0359±0.0012 1.09 1.05 0.125 0.229 0.001
Stomach dry mass (g) 0.1086±0.0046 0.1257±0.0045 0.0958±0.0046 0.1128±0.0046 1.13 0.86 0.022 0.003 0.011
Small intestine dry mass (g) 0.2244±0.0133 0.2632±0.0129 0.1655±0.0133 0.2043±0.0133 1.32 0.83 0.001 0.016 0.017 Large intestine dry mass (g) 0.0489±0.0032 0.0594±0.0031 0.0372±0.0032 0.0477±0.0032 1.28 0.80 0.004 0.008 0.003 Cecum dry mass (g) 0.0598±0.0030 0.0695±0.0029 0.0444±0.0030 0.0542±0.0030 1.32 0.84 <0.0001 0.007 0.006
Spleen dry mass (g) 0.0100±0.0010 0.0098±0.0010 0.0115±0.0011 0.0113±0.0010 0.87 1.02 0.236 0.896 0.002
Kidney dry mass (g) 0.1047±0.0032 0.1003±0.0031 0.0806±0.0032 0.0762±0.0032 1.31 1.05 <0.0001 0.235 0.0004 Liver dry mass (g) 0.4515±0.0119 0.4559±0.0115 0.3839±0.0119 0.3883±0.0119 1.17 0.99 <0.0001 0.750 <0.0001
Absolute body fat (g) 1.683±0.240 2.354±0.238 2.406±0.246 3.077±0.240 0.74 0.75 0.014 0.021 <0.0001
Relative body fat (%) 7.12±0.91 9.24±0.91 9.60±0.94 11.73±0.91 0.77 0.80 0.026 0.053 <0.0001
Hematocrit (%) 50.90±0.86 49.70±0.86 48.94±0.86 47.75±0.86 1.04 1.02 0.062 0.242 0.463
We report adjusted means ± s.e. for a deer mouse of 24.5 g, or 95% confidence intervals between brackets for carcass dry mass back-transformed from log10
values. Ratios were estimated from acclimation or sex-adjusted means controlling for all additional factors and covariates (acclimation⫻sex interaction not included; see Materials and methods). Values in bold are significant at α=0.05.
C, cold acclimated; W, warm acclimated; M, males; F, females.
aOne cold-acclimated female was removed from the analyses because of measurement problems.
Ratio between adjusted means
0.5 1.0 1.5
Hematocrit Relative body fat Absolute body fat Liver Kidney
Spleen Cecum Large intestine
Small intestine
Stomach
Lungs
Heart
VO2max
Carcass
Body mass
Cold/warm Males/females
0.5 1.0 1.5 2.0
*
*
*
*
*
*
*
*
*
*
*
*
*
*
*
*
VO2mean
[image:4.612.48.341.540.745.2](except for total and relative fat content). Accordingly regressions for VO2maxor VO2meanagainst organ size used carcass dry mass as a surrogate for body size.
Organ size
After controlling for differences in acclimation regime, sex and body size, the addition of heart and lung dry mass, and total and relative fat content, significantly improved the regression model for VO2max (Table 2). Differences in VO2maxbetween cold- and warm-acclimated animals decreased from 39% to 28% when heart mass was included (Table 2), although acclimation effects remained highly significant (P<0.0001). Conversely, sex differences in VO2maxdecreased from 8.9% to 4.0% after total body fat was included (Table 2), and were no longer significant (F1,34=1.355, P=0.253). Inclusion of all
variables that significantly improved the initial regression (Table 2) failed to increase predictive power (adjusted means for cold-acclimated animals remained 28% higher than means for warm-acclimated mice), although sex differences were no longer
significant. In this model, acclimation regime, body size, heart mass and absolute body fat content remained statistically significant (1-tailed P<0.035 in all cases), while sex and lung dry mass did not (P=0.175 and 0.669, respectively).
Heart, lung, kidney and liver dry mass as well as body fat content were significantly correlated with VO2mean. The dry mass of the digestive tract was marginally correlated with VO2mean(Table 2). Including heart mass, kidney mass, liver mass and digestive tract mass separately in the initial model resulted in the largest reduction of acclimation effects (Table 2). The inclusion of all variables that significantly improved the initial model in a single multiple regression reduced the difference in adjusted means between cold-and warm-acclimated animals to 50.2% (compared with the 90.0% difference estimated from the initial model). Nevertheless, acclimation effects were still significant (P<0.0001) and none of the variables remained significantly correlated with VO2meanin this model (P>0.101 in all cases).
We tested the acclimation regime⫻organ size interaction in the relationship between VO2maxor daily VO2mean. The interaction was significant only for VO2meanand kidney dry mass (2-tailed P=0.043). Regressions performed separately for the two acclimation regimes showed no relationship between kidney mass and VO2meanin warm-acclimated animals (1-tailed P=0.437) and a significant positive correlation in cold-acclimated animals (1-tailed P=0.041) after accounting for body size effects and controlling for sex (Fig. 4).
DISCUSSION
Emphasis on individual variation is crucial when attempting to determine the role of physiological plasticity in performance and fitness (Hayes and Jenkins, 1997; Sears et al., 2006), and ultimately to understand how plasticity may affect population responses to selection [either natural or artificial (e.g. Garland and Kelly, 2006; Fordyce, 2006)]. For example, VO2max is heritable in the rodent Phyllotis darwini(Nespolo et al., 2005) and under natural selection in wild populations of P. maniculatus(Hayes and O’Connor, 1999). In this context physiological plasticity is relevant for at least two reasons. First, differences in individual performance might not be consistent across all environmental conditions; e.g. individuals with high VO2maxfollowing warm acclimation might not maintain their performance rank in the population after cold acclimation. We have previously shown that individual differences in deer mouse VO2max
Residual VO2mean (ml O2 min–1)
–2 –1 0 1 2 3 4
Re
s
id
ua
l
VO
2
m
a
x
(ml O
2
min
–1
)
–3
–2 –1 0 1 2
3
Warm Cold
Fig. 3. Relationship between residual daily energy expenditure (VO2mean)
[image:5.612.52.280.64.242.2]and VO2maxafter controlling for body size. Circles, females; triangles, males. Dashed lines represent linear regressions obtained separately for warm- and cold-acclimated deer mice.
Table 2. Analyses of covariance for VO2maxand daily VO2meantesting for effects of acclimation, sex and different subordinate traits, controlling for differences in carcass mass (as a surrogate for body size, see Materials and methods)
VO2max VO2mean
Initial model (IM) d.f. C/W M/F F change P C/W M/F F change P
Acclimation 1,35 82.582 <0.0001 67.961 <0.0001
Sex 1,35 6.018 0.019 0.129 0.722
Carcass mass 1,35 1.39 1.09 13.520 0.001 [+] 1.90 0.97 0.099 0.755 [+]
IM + heart 1,34 1.28 1.09 9.222 0.005 [+] 1.61 0.97 6.789 0.014 [+]
IM + lungsa 1,33 1.37 1.07 5.441 0.026 [+] 1.81 0.92 11.763 0.002 [+]
IM + digestive tract 1,34 1.34 1.13 2.924 0.096 [+] 1.73 1.05 3.715 0.062 [+]
IM + spleen 1,34 1.40 1.09 0.861 0.360 [+] 1.96 0.98 2.848 0.101 [+]
IM + kidney 1,34 1.33 1.08 1.929 0.174 [+] 1.61 0.96 6.249 0.017 [+]
IM + liver 1,34 1.35 1.09 1.990 0.167 [+] 1.69 0.99 5.439 0.026 [+]
IM + absolute body fat 1,34 1.35 1.04 11.426 0.002 [–] 1.80 0.89 8.671 0.006 [–]
IM + relative body fat 1,34 1.38 1.07 11.053 0.002 [–] 1.87 0.95 4.974 0.032 [–]
IM + hematocrit 1,34 1.39 1.09 0.023 0.881 [+] 1.93 0.98 0.337 0.566 [–]
Signs of partial regression coefficients for carcass mass and subordinate traits are in brackets. The magnitude of acclimation and sex effects is shown with ratios between adjusted means from cold- vs warm-acclimated animals (C/W) and males vs females (M/F). Values in bold are statistically significant after accounting for false discovery rates (Materials and methods).
[image:5.612.50.568.554.703.2]are repeatable across acclimation temperatures (Rezende et al., 2004b) (see also Hayes and Chappell, 1990), suggesting physiological commonality underlying VO2maxin warm- and cold-acclimated animals (e.g. central support organs and – at least partially – peripheral effectors).
The second reason physiological plasticity is important is that phenotypic traits will evolve in a correlated fashion in response to selection (Feder et al., 2000; Garland, 2003), but the association between traits may vary depending on environmental conditions (e.g. Hammond et al., 2001; Russell and Chappell, 2007; Chappell et al., 2007). For example, in our mice the relationship between VO2max and daily VO2meanwas less pronounced in the cold-acclimated group (Fig. 3). This result, along with the significant differences in VO2mean/VO2max between acclimation groups, probably reflects behavioral changes in the amount of activity and/or the recruitment of additional tissues to sustain thermogenesis in the cold [presumably
brown adipose tissue (Smith and Horwitz, 1969; Cannon and Nedergaard, 2003)]. Regardless of the mechanistic basis underlying this pattern, it is evident that selection on one of these traits will affect the other in a correlated fashion, although how they co-evolve will depend on the environmental conditions encountered by the animals.
Acclimation and energy balance
As reported previously (Bacigalupe et al., 2003; Rezende et al., 2004b), the occurrence and magnitude of responses to acclimation varied considerably (Fig. 2). The heart, kidney, liver and digestive organ mass increased significantly in response to cold acclimation (Table 1). Hematocrit also showed a moderate increase with cold acclimation. However, lung mass showed no response to acclimation temperature.
In general, these findings resemble results from other acclimation or acclimatization studies (Hammond et al., 2001; Russell and Chappell, 2007), though discrepancies exist regarding the plasticity of lungs and pulmonary function. Some studies reported an increase in lung mass and presumably lung capacity during cold acclimation (e.g. McDevitt and Speakman, 1994; Hammond et al., 1999; Hammond et al., 2001; Deveci and Egginton, 2002), whereas others did not (Hoppeler et al., 1995; Russell and Chappell, 2007). Even though the adult vertebrate lung seems to have limited plasticity compared with other organs (Weibel, 2000; Hsia, 2001; Henderson et al., 2002), several confounding factors possibly obscure comparisons. For instance, phenotypic plasticity during development often differs from acclimatory responses during adulthood (Spicer and Burggren, 2003; Russell et al., 2008), lung plasticity may be associated with particular environmental challenges [e.g. hypoxia (see Hammond et al., 2001)], and levels of plasticity may differ between species and/or populations (e.g. Bacigalupe et al., 2003).
Although several organs were plastic in response to thermal acclimation, only heart mass and fat content were consistent predictors of aerobic capacity (VO2max) across acclimation conditions. Animals with larger hearts and less fat mass attained higher VO2max. This is not surprising because of the relevance of cardiac output as a determinant of VO2max(Bishop, 1997; Rezende et al., 2006) and the negligible contribution of depot fat (white adipose tissue) to metabolism. Nevertheless, the combination of heart mass and fat content explained only 30% of the total increase in VO2maxduring cold acclimation.
Daily VO2meanshowed the largest increase in response to cold acclimation (Fig. 2), and individual differences in VO2mean were significantly correlated with the mass of several organs [heart, lung, kidney and (marginally) digestive tract mass; Table 2]. However, causation cannot be inferred from our strictly correlational approach, and some correlates of VO2meanmight reflect responses of organs to varying levels of energy expenditure instead of to temperature per se. For instance, kidney mass may increase in cold-acclimated mice either as a cause of or a response to increased VO2mean. The lack of correlation between kidney mass and VO2maxsupports the ‘response to VO2mean’ hypothesis, but does not rule out a possible contribution of kidney function to thermogenesis following thermal acclimation (e.g. Inbar et al., 1975; Greenwald and Stetson, 1988; Diaz et al., 2006).
The significant negative correlation between VO2mean and fat content suggests that those individuals that eat more have less fat (Table 2). Because body mass remained constant during the weeks before these measurements [fig. 2 of Rezende et al. (Rezende et al., 2004b)], this presumably reflects individual differences in energy balance: mice with lower energy requirements, possibly due to
Correlation between VO2and traitsat lower levels (RP)
Warm acclimation –0.8
–1.0 –0.6–0.4–0.2 0 0.2 0.4 0.6 0.8 1.0
Correl
a
tion
b
etw
een
VO2
a
nd tr
a
it
s
a
t lo
w
er le
v
el
s
(
RP
)
Cold
a
cclim
a
tion
VO2max
VO2mean
Kid
Kid Hct
Hct
Fat
Fat Ht Ht
DT DT
Lun
Lun
Sp
Sp
–1.0 –0.8
–0.6 –0.4 –0.2 0 0.2 0.4 0.6 0.8
1.0
–1.0 –0.8
–0.6 –0.4 –0.2 0 0.2 0.4 0.6 0.8
Fig. 4. Association between VO2maxand VO2meanwith traits at lower levels of biological organization obtained at different acclimation temperatures. Each data point represents the partial correlation (±s.d. obtained from bootstrap), controlling for dry carcass mass and sex, between VO2and lower level
traits (Kid, kidney; Ht, heart; Lun, lung; Sp, spleen; Fat, total absolute fat; DT, digestive tract; Hct, hematocrit). The dashed line depicts the 1:1 relationship. Regression analyses suggest that the association between dry kidney mass and VO2meanhas changed significantly with acclimation (see
increased thermoregulatory efficiency or less spontaneous activity, may retain more fat. We regressed total and relative fat content against VO2mean/VO2maxto test whether individuals that spend a lower fraction of their total capacity accumulate more fat (acclimation, sex, carcass mass and VO2maxwere controlled in the model). The significant negative correlation in both regressions (F1,33=8.17, P=0.007 and F1,33=4.50, P=0.042 for total and relative fat content,
respectively) shows that individuals with higher metabolic rates tend to be leaner, which supports a trade-off between rates of energy expenditure and fat storage.
Sex differences
Males and females differed significantly in body composition, particularly in the mass of digestive organs and fat content (Fig. 1; Table 1). Previous studies have reported similar sex differences in digestive organs in P. maniculatus(Hammond et al., 1999), but did not find differences in fat content (Hammond et al., 1999; Schulte-Hostedde et al., 2001; Chappell et al., 2003). However, the acclimation periods used for these studies were not as long as in the current study. Several other factors might also account for the differences, including variation in experimental protocols [e.g. wild-caught Peromyscuswere studied by Schulte-Hostedde et al. (Schulte-Hostedde et al., 2001)] and age effects [our mice were considerably older than the animals studied by Hammond et al. (Hammond et al., 1999)]. In addition, sex differences in relative fat content tended to be larger in warm-acclimated animals (Results; Table 1), emphasizing that plasticity is an additional confounding factor.
The finding that warm-acclimated females tend to accumulate more fat than males, and that the sex differences in body mass change during the course of cold acclimation [see fig. 2 of Rezende et al. (Rezende et al., 2004b)], suggest that control of fat storage differs between the sexes inP. maniculatus. Heavier digestive tracts in females might be associated with higher nutrient absorption and fat accumulation, if digestibility remains constant and food consumption increases (see Materials and methods). Previous studies have suggested that differences in body composition reflect differences in reproductive roles between sexes, and that females accumulate more fat than males to support reproduction [(Schulte-Hostedde et al., 2001; Speakman, 2008) and references therein]. Although increased fat accumulation in females might have been favored by natural selection, it is possible they are penalized in terms of thermoregulation. Females have significantly lower VO2max than males (Table 1), and differences in fat content between sexes seem to account for this pattern. Future studies should test this possibility because it is not clear to what extent the higher fat content in females might impact on insulation and/or thermogenic endurance.
Conclusions and future directions
Thermal acclimation in P. maniculatusresulted in responses both at the whole-animal level (VO2maxand VO2mean) and in sub-organismal traits (heart, liver, kidney and digestive organ mass). Responses differed among organs and much of the whole-animal acclimatory changes could not be explained by modulation of organ size. Our results suggest that larger hearts, presumably resulting in higher cardiac output, are partly responsible for increased maximum thermogenic capacities following cold acclimation (Table 1). In contrast, kidney and liver plasticity seems to be more strongly associated with sustained energy turnover than with thermogenic capacity. Although we found correlations in the size of some organs with VO2maxand VO2mean, many acclimatory responses probably occur at lower levels of organization (e.g. capillarization, mitochondrial concentration, enzyme or substrate dynamics, etc.).
Significant sex effects were detected for VO2max, body fat content and mass of digestive organs. It would be of interest to determine whether these results are associated with behavioral differences in the field. For instance, lower thermogenic capacity in females may constrain activity in extreme cold (Sears et al., 2006; Hayes and O’Connor, 1999), but their greater fat content may provide more thermogenic endurance at less stressful temperatures. Hence differences between sexes may impose (or result in) different patterns of activity and foraging behavior. Finally, previous studies have reported sporadic breeding for P. maniculatusduring winter, with considerable variation across altitudes [Dunmire (Dunmire, 1960) and references therein]. In this context, P. maniculatus may provide a useful model for studying the interplay between reproductive allocation, physiological performance, behavior and the different selective pressures associated with each sex (see also Speakman, 2008).
Our understanding of physiological plasticity has improved during the last three decades, yet we have much to learn about how these responses have evolved within or between species (Garland and Kelly, 2006). Studies focusing on individual variation in thermal acclimation may provide important information on how multiple physiological systems (e.g. organs that deliver oxygen, process food, remove waste, etc.) respond coherently to accommodate changing environmental conditions. Detailed information on the plasticity of whole-organism traits and subordinate traits is crucial for a comprehensive understanding of the evolution of physiological plasticity, as well as the role of plasticity in ecological diversification.
We thank E. Hice in the UCR Biology machine shop for constructing the respirometry chamber and the temperature control equipment. Jack Hayes provided the initial cohort of deer mice to establish our laboratory colony. This work was supported by NSF DEB-0111604 (K.A.H. and M.A.C.) and by a UC Riverside intramural research grant (M.A.C.). E.L.R. is currently a Ramón y Cajal Fellow supported by the Spanish Ministry of Science and Innovation.
REFERENCES
Bacigalupe, L. D. and Bozinovic, F.(2002). Design, limitations and sustained metabolic rate: lessons from small mammals. J. Exp. Biol. 205, 2963-2970. Bacigalupe, L. D., Nespolo, R. F., Opazo, J. C. and Bozinovic, F.(2003).
Phenotypic flexibility in a novel thermal environment: phylogenetic inertia in thermogenic capacity and evolutionary adaptation in organ size. Physiol. Biochem. Zool. 77, 805-815.
Basset, D. R., Jr and Howley, E. T.(2000). Limiting factors of maximum oxygen uptake and determinants of endurance performance. Med. Sci. Sports Exerc. 32, 70-84.
Bishop, C. M.(1997). Heart mass and the maximum cardiac output of birds and mammals: implications for estimating the maximum aerobic power input of flying animals. Philos. Trans. R. Soc. Lond. B Biol. Sci. 352, 447-456.
Cannon, B. and Nedergaard, J.(2003). Brown adipose tissue: function and physiological significance. Physiol. Rev. 84, 277-359.
Chappell, M. A.(1985). Effects of ambient temperature and altitude on ventilation and gas exchange in deer mice (Peromyscus maniculatus). J. Comp. Physiol. 155, 751-758.
Chappell, M. A. and Bachman, G. C.(1995). Aerobic performance in Belding’s ground squirrels (Spermophilus beldingi): variance, ontogeny, and the aerobic capacity model of endothermy. Physiol. Zool. 68, 421-442.
Chappell, M. A. and Snyder, L. R. G.(1984). Biochemical and physiological correlates of deer mouse alpha-chain hemoglobin polymorphisms. Proc. Natl. Acad. Sci. USA 81, 5484-5488.
Chappell, M. A., Rezende, E. L. and Hammond, K. A.(2003). Age and aerobic performance in deer mice. J. Exp. Biol. 206, 1221-1231.
Chappell, M. A., Hammond, K. A., Cardullo, R. A., Russell, G. A., Rezende, E. L. and Miller, C.(2007). Deer mouse aerobic performance across altitudes: effects of developmental history and temperature acclimation. Physiol. Biochem. Zool. 80, 652-662.
Christians, J. K.(1999). Controlling for body mass effects: is part-whole correlation important? Physiol. Biochem. Zool. 72, 250-253.
Darveau, C. A., Suarez, R. K., Andrews, R. D. and Hochachka, P. W.(2002). Allometric cascade as a unifying principle of body mass effects on metabolism. Nature 417, 166-170.
Deveci, D. and Egginton, S.(2002). The effects of reduced temperature and photoperiod on body composition in hibernator and non-hibernator rodents. J. Therm. Biol. 27, 467-478.
Diaz, G. B., Ojeda, R. A. and Rezende, E. L.(2006). Renal morphology, phylogenetic history and desert adaptation of South American hystricognath rodents. Funct. Ecol. 20, 609-620.
Dunmire, W. W.(1960). An altitudinal survey of reproduction in Peromyscus maniculatus. Ecology 41, 174-182.
Feder, M. E., Bennett, A. F. and Huey, R. B.(2000). Evolutionary physiology. Annu. Rev. Ecol. Syst. 31, 315-341.
Fordyce, J. A.(2006). The evolutionary consequences of ecological interactions mediated through phenotypic plasticity. J. Exp. Biol. 209, 2368-2376.
Garland, T., Jr(2003). Selection experiments: an under-utilized tool in biomechanics and organismal biology. In Vertebrate Biomechanics and Evolution (ed. V. L. Bels, J. P. Gasc and A. Casinos), pp. 23-56. Oxford: BIOS Scientific.
Garland, T., Jr and Kelly, S. A.(2006). Phenotypic plasticity and experimental evolution. J. Exp. Biol. 209, 2234-2261.
Greenwald, L. and Stetson, D.(1988). Urine concentration and the length of the renal papilla. News Physiol. Sci. 3, 46-49.
Hammond, K. A., Roth, J., Janes, D. N. and Dohm, M. R.(1999). Morphological and physiological responses to altitude in deer mice (Peromyscus maniculatus). Physiol. Biochem. Zool. 72, 613-622.
Hammond, K. A., Szewczak, J. and Krol, E.(2001). Effects of altitude and temperature on organ phenotypic plasticity along an altitudinal gradient. J. Exp. Biol. 204, 1991-2000.
Hayes, J. P. and Chappell, M. A.(1990). Individual consistency of maximal oxygen consumption in deer mice. Funct. Ecol. 4, 495-503.
Hayes, J. P. and Jenkins, S. H.(1997). Individual variation in mammals. J. Mammal. 78, 274-293.
Hayes, J. P. and O’Connor, C. S.(1999). Natural selection on thermogenic capacity of high-altitude deer mice. Evolution 53, 1280-1287.
Heldmaier, G. and Jablonka, B.(1985). Seasonal differences in thermogenic adaptations evoked by daily injections of noradrenaline. J. Therm. Biol. 10, 97-99. Henderson, K. K., Wagner, H., Favret, F., Britton, S. L., Koch, L. G., Wagner, P. D.
and Gonzalez, N. C.(2002). Determinants of maximal O2 uptake in rats selectively bred for endurance running capacity. J. Appl. Physiol. 93, 1265-1274.
Hoppeler, H., Alteper, E., Wagner, M., Turner, D. L., Hokanson, J., König, M., Stalder-Navarro, V. P. and Weibel, E. R.(1995). Cold acclimation and endurance training in guinea pigs: changes in lung, muscle and brown fat tissue. Respir. Physiol. 101, 189-198.
Hsia, C. C.(2001). Coordinated adaptation of oxygen transport in cardiopulmonary disease. Circulation 104, 963-969.
Inbar, I., Chayoth, R. and Cassuto, I.(1975). Energy metabolism in kidney of heat-acclimated hamsters. Am. J. Physiol. 229, 1234-1236.
Kerr, D. C., Ankney, C. D. and Millar, J. S.(1982). The effect of drying temperature on extraction of petroleum ether soluble fats of small birds and mammals. Can. J. Zool. 60, 470-472.
Ksiazek, A., Konarzewski, M. and Lapo, I. B.(2004). Anatomic and energetic correlates of divergent selection for basal metabolic rate in laboratory mice. Physiol. Biochem. Zool. 77, 890-899.
Inbar, I., Chayot, R. and Cassuto, Y.(1975). Energy metabolism in kidney of heat-acclimated hamsters. Am. J. Physiol. 229, 1234-1236.
McDevitt, R. M. and Speakman, J. R.(1994). Central limits to sustainable metabolic-rate have no role in cold-acclimation of the short-tailed field vole (Microtus agrestis). Physiol. Zool. 67, 1117-1139.
Mueller, P. and Diamond, J.(2001). Metabolic rate and environmental productivity: well-provisioned animals evolve to run and idle fast. Proc. Natl. Acad. Sci. USA 22, 12550-12554.
Nespolo, R. F., Opazo, J. C., Rosenmann, M. and Bozinovic, F.(1999). Thermal acclimation, maximum metabolic rate, and non-shivering thermogenesis of Phyllotis xanthopygus (Rodentia) in the Andes Mountains. J. Mammal. 80, 742-748. Nespolo, R. F., Bacigalupe, L. D., Rezende, E. L. and Bozinovic, F.(2001). When
nonshivering thermogenesis equals maximum metabolic rate: thermal acclimation and phenotypic plasticity in bioenergetics of fossorial Spalacopus cyanus (Rodentia). Physiol. Biochem. Zool. 74, 325-332.
Nespolo, R. F., Bacigalupe, L. D., Sabat, P. and Bozinovic, F.(2002). Interplay among energy metabolism, organ mass and digestive enzyme activity in the mouse-opossum Thylamys elegans: the role of thermal acclimation. J. Exp. Biol. 205, 2697-2703.
Nespolo, R. F., Bustamante, D. M., Bacigalupe, L. D. and Bozinovic, F.(2005). Quantitative genetics of bioenergetics and growth-related traits in the wild mammal, Phyllotis darwini. Evolution59, 1829-1837.
Rezende, E. L., Bozinovic, F. and Garland, T., Jr(2004a). Climatic adaptation and the evolution of maximum and basal rates of metabolism in rodents. Evolution 58, 1361-1374.
Rezende, E. L., Chappell, M. A. and Hammond, K. A.(2004b). Cold-acclimation in Peromyscus: temporal effects and individual variation in maximum metabolism and ventilatory traits. J. Exp. Biol. 207, 295-305.
Rezende, E. L., Chappell, M. A., Gomes, F. R., Malisch, J. L. and Garland, T., Jr (2005). Maximal metabolic rates during voluntary exercise, forced exercise, and cold exposure in house mice selectively bred for high wheel running. J. Exp. Biol. 208, 2447-2458.
Rezende, E. L., Gomes, F. R., Malisch, J. L., Chappell, M. A. and Garland, T., Jr (2006). Maximal oxygen consumption in relation to subordinate traits in lines of house mice selectively bred for high voluntary wheel running. J. Appl. Physiol. 101, 477-485. Richardson, R. S., Harms, C. A., Grassi, B. and Hepple, R. T.(1999). Skeletal
muscle: master or slave of their cardiovascular system? Med. Sci. Sports Exerc. 32, 89-93.
Rosenmann, M. and Morrison, P.(1974). Maximum oxygen consumption and heat loss facilitation in small homeotherms by He-O2. Am. J. Physiol. 226, 490-494.
Russell, G. A. and Chappell, M. A.(2007). Is BMR repeatable in deer mice? Organ mass correlates and the effects of cold acclimation and natal altitude. J. Comp. Physiol. B 177, 75-87.
Russell, G. A., Rezende, E. L. and Hammond, K. A.(2008). Development partly determines the aerobic performance of adult deer mice, Peromyscus maniculatus. J. Exp. Biol. 211, 35-41.
Schulte-Hostedde Millar, J. S. and Hickling, G. J.(2001). Sexual dimorphism in body composition of small mammals. Can. J. Zool. 79, 1016-1020.
Sears, M. W., Hayes, J. P., O’Connor, C. S., Geluso, K. and Sedinger, J. S.(2006). Individual variation in thermogenic capacity affects above-ground activity of high-altitude Deer Mice. Funct. Ecol. 20, 97-104.
Smith, R. E. and Horwitz, B. A.(1969). Brown fat and thermogenesis. Physiol. Rev. 49, 330-425.
Snyder, L. R. G., Hayes, J. P. and Chappell, M. A.(1988). Alpha-chain hemoglobin polymorphisms are correlated with altitude in the deer mouse, Peromyscus maniculatus. Evolution 42, 689-697.
Speakman, J. R.(2008). The physiological costs of reproduction in small mammals. Philos. Trans. R. Soc. B Biol. Sci. 363, 375-398.
Spicer, J. I. and Burggren, W. W.(2003). Development of physiological regulatory systems: altering the timing of crucial events. Zoology 106, 91-99.
Swallow, J. G., Rhodes, J. S. and Garland, T., Jr(2005). Phenotypic and evolutionary plasticity of organ masses in response to voluntary exercise in house mice. Integr. Comp. Biol. 45, 426-437.
Szafranska, P. A., Zub, K. and Konarzewski, M.(2007). Long-term repeatability of body mass and resting metabolic rate in free-living weasels, Mustela nivalis. Funct. Ecol. 21, 731-737.
Treacher, D. F. and Leach, R. M.(1998). Oxygen transport: 1. Basic principles. BMJ 317, 1302-1306.
Van Sant, M. J. and Hammond, K. A.(2008). Contribution of shivering and nonshivering thermogenesis to thermogenic capacity for the deer mouse (Peromyscus maniculatus). Physiol. Biochem. Zool. 81, 605-611.
Wagner, P. D.(1996). Determinants of maximal oxygen transport and utilization. Annu. Rev. Physiol. 58, 21-50.
Weibel, E. R.(1984). The Pathway For Oxygen. Cambridge, MA: Harvard University Press.
Weibel, E. R.(2000). Symmorphosis: On Form and Function in Shaping Life. Cambridge, MA: Harvard University Press.