www.impactjournals.com/oncotarget/ Oncotarget, Vol. 7, No. 30
Comprehensive immunohistochemical analysis of tumor
microenvironment immune status in esophageal squamous cell
carcinoma
Ken Hatogai1,2,3, Shigehisa Kitano4, Satoshi Fujii1, Takashi Kojima2, Hiroyuki Daiko5, Shogo Nomura6, Takayuki Yoshino2, Atsushi Ohtsu2,7, Yuichi Takiguchi3, Toshihiko Doi2, Atsushi Ochiai1
1Division of Pathology, Exploratory Oncology Research and Clinical Trial Center, National Cancer Center, Kashiwa, Chiba, Japan 2Department of Gastroenterology and Gastrointestinal Oncology, National Cancer Center Hospital East, Kashiwa, Chiba,
Japan
3Department of Medical Oncology, Graduate School of Medicine, Chiba University, Chuo-ku, Chiba, Japan
4Department of Experimental Therapeutics, Exploratory Oncology Research and Clinical Trial Center, National Cancer Center, Tokyo, Japan
5Department of Esophageal Surgery, National Cancer Center Hospital East, Kashiwa, Chiba, Japan
6Biostatistics Division, Center for Research Administration and Support, National Cancer Center, Kashiwa, Japan 7Exploratory Oncology Research and Clinical Trial Center, National Cancer Center, Kashiwa, Japan
Correspondence to: Atsushi Ochiai, email: aochiai@east.ncc.go.jp
Keywords: esophageal cancer, immunohistochemistry, PD-L1, tumor infiltrating lymphocyte, macrophage
Received: December 31, 2015 Accepted: June 04, 2016 Published: June 15, 2016
AbstrAct
Immunotherapy with anti-PD-1 antibody preliminarily showed promising efficacy
for treating esophageal squamous cell carcinoma (ESCC). Herein, we used tissue
microarrays and immunohistochemically analyzed PD-L1 and various tumor infiltrating
immune cells (TIICs) in specimens from 196 ESCC patients who had undergone curative resection without preoperative therapy. PD-L1 expressions in tumor cells
(TCs) and TIICs, as well as infiltration of lymphocytes (CD4+, CD8+, FOXP3+, and
PD- 1+) and macrophages (CD68+ and CD204+), were evaluated. PD-L1 was expressed
in TCs of 18.4% and in TIICs of 83.3% of these patients. PD-L1 expressions in TCs
and TIICs were associated with significant infiltration of various TIIC types, especially
CD8+ cells. PD-L1 expressions in both TCs and TIICs were significantly associated with
favorable overall survival, and combining their levels enhanced prognostic accuracy.
Prognostic impacts of PD-L1 expressions in TCs and TIICs, abundant PD-1+ cell
infiltration, a high CD8+/FOXP3+ ratio, and the CD8+/CD204+ ratio remained significant
after adjusting for clinicopathological factors. In conclusion, PD-L1 expression reflects anti-tumor immunity, and PD-1/PD-L1 expression and the ratio of infiltrating effector
to immune suppressor cells have prognostic value. Therapeutic strategies inhibiting the PD-1/PD-L1 signal and immune suppressor cells are anticipated in ESCC patients.
IntroductIon
Squamous cell carcinoma is the predominant histological type of esophageal cancer worldwide, though the incidence of esophageal adenocarcinoma exceeds that of squamous cell carcinoma in the UK, certain other western European countries, and the United States [1]. Smoking and alcohol consumption, known as major risk factors for esophageal squamous
cell carcinoma (ESCC), have synergistic effects on carcinogenesis, which are shared with head and neck and also lung cancers [2–4]. Chronic exposure to carcinogens such as nitrosamine related to smoking and the alcohol metabolite aldehyde cause DNA damage and multiple genetic changes [5, 6]. Though no driver gene mutations have yet been detected in ESCC, among solid tumors the somatic mutation rate in ESCC is relatively high [7, 8].
Recent advances in cancer immunology have revealed the importance of signaling between Programmed Death–1 (PD-1), expressed on antigen-experienced T cells, and its ligand PD-L1, expressed on antigen presenting cells and tumor cells (TCs) [9]. Anti-PD-1 or anti-PD-L1
antibodies have clinically benefitted patients with some
solid cancers in early clinical trials [10–12]. In a recent phase 3 trial, a favorable response and survival outcomes were obtained with an anti-PD-1 monoclonal antibody, nivolumab, in advanced squamous-cell non-small-cell lung cancer which is genetically similar to ESCC [13, 14].
In addition, a favorable response and durable efficacy of
anti-PD-1 monoclonal antibodies for ESCC were also demonstrated in early clinical trials [15, 16]. In the context of biomarker analysis, PD-L1 expression in TCs, that in
tumor infiltrating immune cells (TIICs), and a high level
of CD8+ T cell infiltration have been shown, in several clinical trials testing anti-PD-1 and anti-PD-L1 antibody therapy, to be potential predictive biomarkers of clinical
efficacy [17–20].
PD-L1 is expressed on TCs in ESCC and other solid tumors [21, 22]. Recently, high mutation burdens in tumors were reported to be associated with a clinical
benefit of PD-1 blockade [23]. Given the relatively high
mutation burden in ESCC [7, 8], PD-1/PD-L1 blockade shows promise for treating ESCC. The importance of the immune response to cancer has been studied in terms of
infiltration of lymphocytes and macrophages in ESCC
[24–26]. To date, no study has explored the associations
of PD-L1 expressions in TCs and TIICs and the infiltration
of effector cells or immune suppressor cells (regulatory T cells and M2 macrophages).
We performed the present immunohistochemical (IHC) study using surgically resected specimens from a large cohort of treatment-naïve patients with ESCC to identify and quantify PD-L1 expressions in tumors and their associations with anti-tumor immune responses. The survival impacts of various immunological factors were also assessed.
results
Pd-l1 expressions in escc and tIIcs
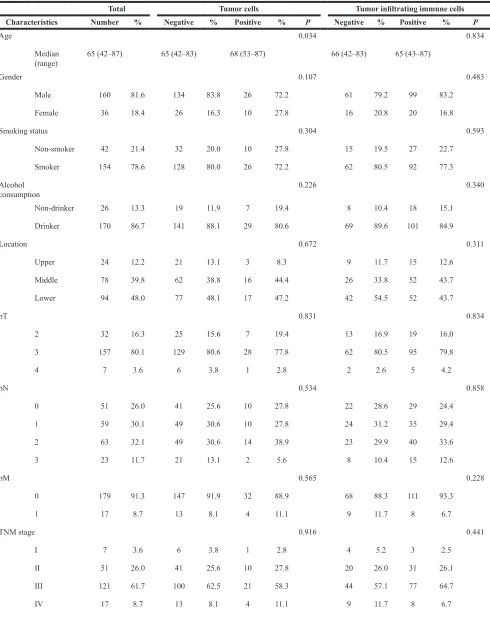
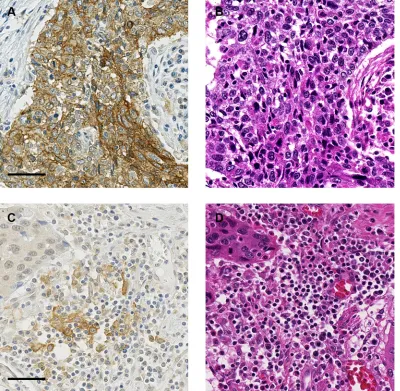
The clinicopathological characteristics of our patients are listed in Table 1. None of the patients in this study had distant organ metastasis or had received immune therapies, such as immune checkpoint inhibitors and immune cell therapy. Representative cases with PD- L1 expression in TCs and TIICs are shown in Figure 1. PD-L1 expression was positive in TCs from 36 patients
(18.4%, 95% confidence interval [CI]: 13.2– 24.5).
PD- L1 expression was positive in TIICs from 119
patients (60.7%, 95% CI: 53.5–67.6). Among patients
showing PD-L1 positive in TCs, 83.3% demonstrated
PD-L1 positive in TIICs, a significantly higher percentage
than that in patients whose TCs were PD-L1 negative (P < 0.001) (Table 2). In total, 125 patients (63.8%, 95%
CI: 56.6–67.6) had TC and/or TIIC positive for PD-L1. The only clinicopathological characteristic significantly associated with PD-L1 expression status, specifically that
in TCs, was age (Table 1).
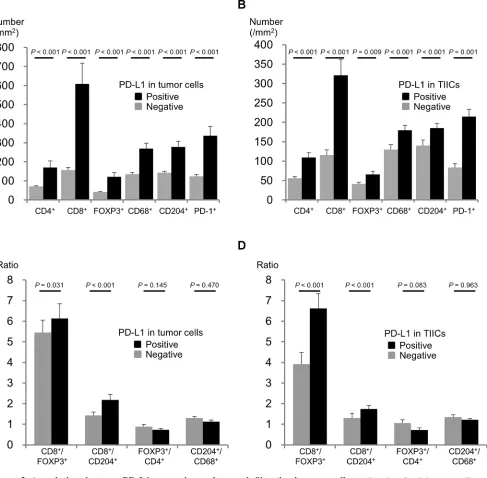
PD-L1 expression and infiltration of TIICs IHC results of representative cases with each TIIC type are shown in Supplementary Figure S1. Figure 2 demonstrates the relationship between PD-L1 expression status in TCs and TIICs and the number and ratio of each TIIC type. The numbers of all TIIC types evaluated were higher in subgroups with PD-L1 positive in TCs and in TIICs than in subgroups with PD-L1 negative in TCs and in TIICs. This tendency was especially strong for CD8+ cells. The CD8+/FOXP3+ and CD8+/CD204+ ratios were also higher in subgroups with PD-L1 positive in TCs and in TIICs. In contrast, the FOXP3+/CD4+ ratio tended to be
lower, though not significantly, in subgroups with PD-L1
positive in TCs and in TIICs.
Survival analyses according to immunological factors
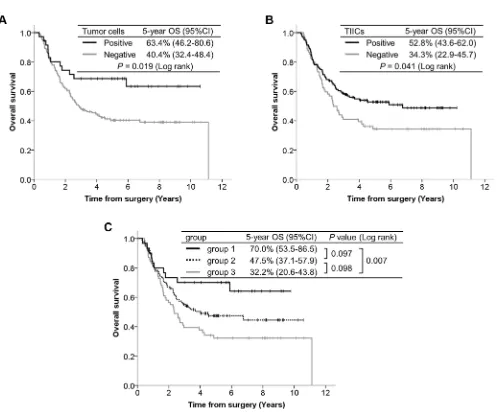
The median follow-up time of the censored cases was 5.5 years (range, 0.1–10.6) from the date of surgery. The overall survival (OS) curves according to PD-L1 expression are presented in Figure 3. Patients with PD-L1
positive in TCs demonstrated significantly better OS than
those with PD-L1 negative in TCs (P = 0.019). Patients
with PD-L1 positive in TIICs had significantly better OS
than those with PD-L1 negative in TIICs (P = 0.041). We divided patients into three groups according to the PD- L1
expression status of their TCs and TIICs: both PD-L1
positive (group 1), either one PD-L1 positive (group 2), and both PD-L1 negative (group 3). The separate OS
curves for these 3 groups revealed a statistically significant
difference only between groups 1 and 3 (P = 0.097 between groups 1 and 2, P = 0.098 between groups 2 and 3, P = 0.007 between groups 1 and 3).
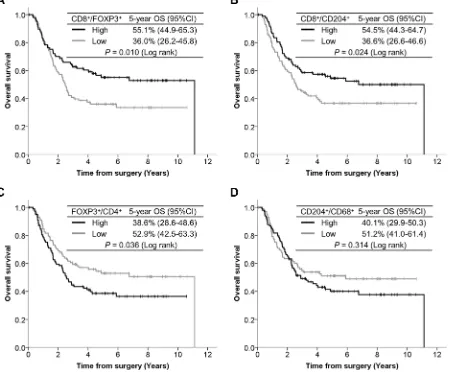
The OS curves according to TIIC ratios are presented in Figure 4. Patients with a high CD8+/FOXP3+
ratio had significantly better OS than those with a low
CD8+/FOXP3+ ratio (P = 0.010). Patients with a high CD8+/CD204+ ratio had significantly better OS than those with a low CD8+/CD204+ ratio (P = 0.024). In contrast, patients with a high FOXP3+/CD4+ ratio showed
significantly poorer OS than those with a low FOXP3+/ CD4+ ratio (P = 0.036). Although the OS curves were drawn separately according to CD204+/CD68+ ratios, the
difference did not reach statistical significance (P = 0.314).
Among each TIIC type assessed, prognostic significance
Table 1: Clinicopathological characteristics according to PD-L1 expressions in tumor cells and
tumor infiltrating immune cells
Total Tumor cells Tumor infiltrating immune cells Characteristics Number % Negative % Positive % P Negative % Positive % P
Age 0.034 0.834
Median
(range) 65 (42–87) 65 (42–83) 68 (53–87) 66 (42–83) 65 (43–87)
Gender 0.107 0.483
Male 160 81.6 134 83.8 26 72.2 61 79.2 99 83.2
Female 36 18.4 26 16.3 10 27.8 16 20.8 20 16.8
Smoking status 0.304 0.593
Non-smoker 42 21.4 32 20.0 10 27.8 15 19.5 27 22.7
Smoker 154 78.6 128 80.0 26 72.2 62 80.5 92 77.3
Alcohol
consumption 0.226 0.340
Non-drinker 26 13.3 19 11.9 7 19.4 8 10.4 18 15.1
Drinker 170 86.7 141 88.1 29 80.6 69 89.6 101 84.9
Location 0.672 0.311
Upper 24 12.2 21 13.1 3 8.3 9 11.7 15 12.6
Middle 78 39.8 62 38.8 16 44.4 26 33.8 52 43.7
Lower 94 48.0 77 48.1 17 47.2 42 54.5 52 43.7
pT 0.831 0.834
2 32 16.3 25 15.6 7 19.4 13 16.9 19 16.0
3 157 80.1 129 80.6 28 77.8 62 80.5 95 79.8
4 7 3.6 6 3.8 1 2.8 2 2.6 5 4.2
pN 0.534 0.858
0 51 26.0 41 25.6 10 27.8 22 28.6 29 24.4
1 59 30.1 49 30.6 10 27.8 24 31.2 35 29.4
2 63 32.1 49 30.6 14 38.9 23 29.9 40 33.6
3 23 11.7 21 13.1 2 5.6 8 10.4 15 12.6
pM 0.565 0.228
0 179 91.3 147 91.9 32 88.9 68 88.3 111 93.3
1 17 8.7 13 8.1 4 11.1 9 11.7 8 6.7
TNM stage 0.916 0.441
I 7 3.6 6 3.8 1 2.8 4 5.2 3 2.5
II 51 26.0 41 25.6 10 27.8 20 26.0 31 26.1
III 121 61.7 100 62.5 21 58.3 44 57.1 77 64.7
Grade 0.245 0.794
W/D 48 24.5 43 26.9 5 13.9 17 22.1 31 26.1
M/D 127 64.8 101 63.1 26 72.2 52 67.5 75 63.0
P/D 21 10.7 16 10.0 5 13.9 8 10.4 13 10.9
Lymphatic invasion 0.442 0.668
Absent 93 47.4 78 48.8 15 41.7 38 49.4 55 46.2
Present 103 52.6 82 51.3 21 58.3 39 50.6 64 53.8
Venous invasion 0.145 0.279
Absent 24 12.2 17 10.6 7 19.4 7 9.1 17 14.3
Present 172 87.8 143 89.4 29 80.6 70 90.9 102 85.7
[image:4.612.110.510.303.694.2]Abbreviations: W/D, well differentiated; M/D, moderately differentiated; P/D, poorly differentiated.
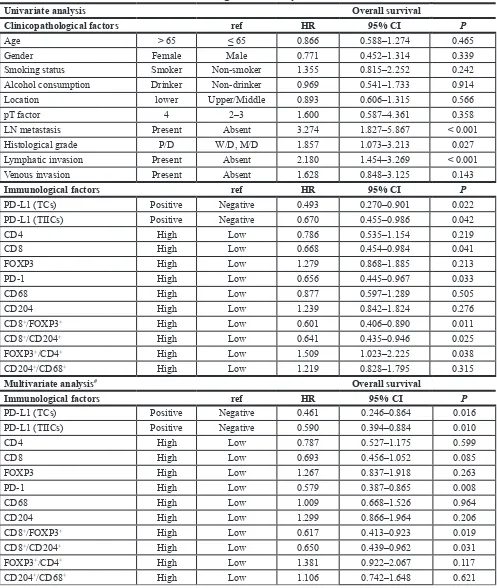
Multivariate analyses for survival outcomes The results of univariate and multivariate survival analyses are presented in Table 3. Both TCs (HR 0.461,
95% CI: 0.246–0.864, P = 0.016) and TIICs (HR 0.590,
95% CI: 0.394–0.884, P = 0.010) being PD-L1 positive
was significantly associated with longer OS in multivariate
analysis even after adjusting for potentially confounding clinicopathological factors. A high CD8+/FOXP3+ ratio
(HR 0.617, 95% CI: 0.413–0.923, P = 0.019) and a high CD8+/CD204+ ratio (HR 0.650, 95% CI: 0.439–0.962, P = 0.031) were also significantly associated with longer
OS, although none of the TIIC types individually showed
a significant association with OS except for PD-1+
cells (HR 0.579, 95% CI: 0.387–0.865, P = 0.008). We explored OS based on TIICs in the stroma by focusing
on factors significantly impacting OS in the tumor nest
assessment (CD8+/FOXP3+, CD8+/CD204+, and PD-1+).
None significantly impacted OS in multivariate analyses
(Supplementary Figure S3).
dIscussIon
We clarified PD-1 and PD-L1 expressions, the
[image:5.612.68.555.220.698.2]associations between PD-L1 expression and various immune cells, and the prognostic relevance of these factors
Table 2: PD–L1 expressions in tumor cells and tumor infiltrating immune cells
Total Positive % 95% cI
TCs 196 36 18.4 13.2–24.5
TIICs 196 119 60.7 53.5–67.6
tIIcs P value
(McNemar) Negative Positive
TCs Negative 71 (44.4%) 89 (55.6%) < 0.001
Positive 6 (16.7%) 30 (83.3%)
Abbreviations: TCs, tumor cells; TIICs, tumor infiltrating immune cells.
Figure 3: Kaplan-Meier curves according to PD-L1 expression, with 5-year survival rate and the log-rank test for OS.
[image:6.612.60.558.264.676.2]Table 3: Univariate and multivariate Cox regression analyses for overall survival
Univariate analysis Overall survival
Clinicopathological factors ref Hr 95% cI P
Age > 65 ≤ 65 0.866 0.588–1.274 0.465
Gender Female Male 0.771 0.452–1.314 0.339
Smoking status Smoker Non-smoker 1.355 0.815–2.252 0.242
Alcohol consumption Drinker Non-drinker 0.969 0.541–1.733 0.914
Location lower Upper/Middle 0.893 0.606–1.315 0.566
pT factor 4 2–3 1.600 0.587–4.361 0.358
LN metastasis Present Absent 3.274 1.827–5.867 < 0.001
Histological grade P/D W/D, M/D 1.857 1.073–3.213 0.027
Lymphatic invasion Present Absent 2.180 1.454–3.269 < 0.001
Venous invasion Present Absent 1.628 0.848–3.125 0.143
Immunological factors ref Hr 95% cI P
PD-L1 (TCs) Positive Negative 0.493 0.270–0.901 0.022
PD-L1 (TIICs) Positive Negative 0.670 0.455–0.986 0.042
CD4 High Low 0.786 0.535–1.154 0.219
CD8 High Low 0.668 0.454–0.984 0.041
FOXP3 High Low 1.279 0.868–1.885 0.213
PD-1 High Low 0.656 0.445–0.967 0.033
CD68 High Low 0.877 0.597–1.289 0.505
CD204 High Low 1.239 0.842–1.824 0.276
CD8+/FOXP3+ High Low 0.601 0.406–0.890 0.011
CD8+/CD204+ High Low 0.641 0.435–0.946 0.025
FOXP3+/CD4+ High Low 1.509 1.023–2.225 0.038
CD204+/CD68+ High Low 1.219 0.828–1.795 0.315
Multivariate analysis# Overall survival
Immunological factors ref Hr 95% cI P
PD-L1 (TCs) Positive Negative 0.461 0.246–0.864 0.016
PD-L1 (TIICs) Positive Negative 0.590 0.394–0.884 0.010
CD4 High Low 0.787 0.527–1.175 0.599
CD8 High Low 0.693 0.456–1.052 0.085
FOXP3 High Low 1.267 0.837–1.918 0.263
PD-1 High Low 0.579 0.387–0.865 0.008
CD68 High Low 1.009 0.668–1.526 0.964
CD204 High Low 1.299 0.866–1.964 0.206
CD8+/FOXP3+ High Low 0.617 0.413–0.923 0.019
CD8+/CD204+ High Low 0.650 0.439–0.962 0.031
FOXP3+/CD4+ High Low 1.381 0.922–2.067 0.117
CD204+/CD68+ High Low 1.106 0.742–1.648 0.621
Abbreviations: HR, hazard ratio; CI, confidence interval; LN, lymph node; W/D, well differentiated; M/D, moderately differentiated; P/D, poorly differentiated; TCs, tumor cells; TIICs, tumor infiltrating immune cells.
employing IHC with tissue microarrays for 196 ESCC cases who had received neither preoperative neoadjuvant therapy nor post-recurrence immunotherapy.
Reports of PD-L1 expression in ESCC are limited. PD-L1 positive rates in TCs were reported to be 41.9% by Ohigashi et al. and 84.5% by Chen et al. [21, 22], though PD-L1 expressions on the plasma membrane
and in the cytoplasm were defined as positive in their
studies. Mechanistically, PD-L1 is a type I transmembrane molecule expressed on TCs and binds to its receptor, PD-1, which is expressed on the plasma membranes of activated T cells [27]. Furthermore, PD-L1 expression on the plasma membrane has been evaluated as a biomarker candidate in recent clinical trials of anti-PD-1 or anti-PD-L1 antibody therapy [17–19]. Accordingly, we evaluated PD-L1 expression on the plasma membranes of TCs employing a cut-off value of 1% based on the sensitivity test assessing
hazard ratios for OS, and demonstrated the positive rate
to be 18.4% in our patients. The positive rate of 63.8% for PD-L1 expression in TCs and/or TIICs demonstrated herein was compatible with the results of a phase 1 trial for esophageal cancer [15].
[image:8.612.85.534.326.698.2]Marked infiltration of CD8+ cells into a PD-L1 positive tumor has been reported for several cancers including ESCC
[21, 28, 29]. In this study, abundant infiltrations of CD8+ and PD-1+ cells were associated with PD-L1 expression in TCs and TIICs, observations in line with the theory that
PD-L1 expression is induced by several pro-inflammatory factors, such as IFNγ and TNFα, produced by activated
T cells [30, 31], and that the PD-1/PD-L1 pathway plays a role in suppressing activated T cells in the periphery. In
addition, marked infiltrations of immune suppressor cells
such as regulatory T cells (FOXP3+) and M2 macrophages (CD204+) were also associated with PD-L1 expression in both TCs and TIICs. These results indicate that PD-L1
expression in TCs and/or TIICs reflects a highly activated
immune response to tumors and also the adaptive immune resistance which develops as a consequence. In contrast,
significant associations of positivity for PD-L1 expression
with the CD8+/FOXP3+ and CD8+/CD204+ ratios, as well as a trend for an inverse association of PD-L1 expression with the FOXP3+/CD4+ ratio, were observed, suggesting PD- L1 expression to be associated with the balance between
infiltrating effector cells and immune suppressor cells.
The prognostic significance of PD-L1 expression
in TCs remains controversial. Previous studies of ESCC demonstrated an association between PD-L1 expression and poor outcomes [21, 22]. However, we found PD-L1 expression to be a factor predicting favorable OS. Similar discordant results have also been reported for other cancers, such as melanoma and lung cancer [32–36]. We speculate that this discrepancy regarding prognostic relevance between the present and previous studies may
be due not only to the definitions of positive staining
applied, but also differences in the antibodies used and heterogeneous baseline characteristics. We also revealed
PD-L1 expression in TIICs and high infiltration of PD-1+ TIICs to predict favorable OS, which is compatible with recent reports on several cancer types [29, 37–40]. PD-1 and PD-L1 are inhibitory immune checkpoint molecules. However, considering that PD-1 is expressed mainly on activated T cells and PD-L1 expression is induced by activated T cells, and also the association between PD- L1 expression and TIIC abundance including PD-1+ cells, PD-1 and PD-L1 expressions should be regarded
as reflecting an immunoreactive state, which contributes
to better OS [9]. PD-L1 positive tumors, which generally have abundant TIICs including PD-1+ immune cells,
may define a subset of ESCC patients who are potential
candidates for anti-PD-1 or anti-PD-L1 antibody therapy. However, we cannot draw a conclusion based on our present results as this study did not include patients receiving these agents. Ongoing clinical trials of these agents are anticipated to clarify the optimal predictive biomarkers.
The number of tumor infiltrating FOXP3+ regulatory
T cells, especially as reflected by a decreased CD8+/ FOXP3+ ratio, is reportedly associated with a poor prognosis for several cancer types [41–44]. In addition
to confirming these prior reports, our results clarified the prognostic significance of the CD8+/CD204+ ratio. CD204+ macrophages are another set of immune suppressor cells (M2 phenotype) [45], and marked CD204+
macrophage infiltration is reportedly associated with a
malignant phenotype or poor survival for several cancers
including ESCC [26, 46–48]. Given the functions of M2
macrophages, such as producing immune suppressive cytokines and downregulating effector T cell activity [49, 50], not only the number of CD204+ cells but also the balance between CD8+ and CD204+ cells must be
considered. Our study is the first, to our knowledge, to
demonstrate the positive survival impact of an increased CD8+/CD204+ ratio. These results suggest that regulatory T cells and M2 macrophages play a critical role in ESCC progression, making these cell types potentially novel therapeutic targets for agents which could be used in addition to immune checkpoint inhibitors targeting PD-1/ PD-L1 signaling.
Herein, TIICs in the stroma were not associated with
OS. The clinical relevance of TIIC localization, whether
in the tumor nest or the stroma, remains controversial. Although several reports have demonstrated the importance of the stroma [51–53], our results indicate that tumor nest TIICs have more clinical relevance in ESCC. Tumor microenvironments may differ among cancer types. The present results are understandable, considering that tumor nest TIICs are in direct contact with TCs. A report on melanoma showed lymphocytes within the tumor nests to be remarkably increased after immune checkpoint inhibitor treatment in patients who demonstrated a response, suggesting the importance of tumor nest TIICs [54].
We examined for the first time the impacts of
various immunological factors in both TCs and TIICs from a large cohort of patients with pure ESCC. Although we enrolled 196 patients, a considerable number, this study was performed retrospectively, in a single institution. A prospective study is needed to validate the present results.
In summary, we employed comprehensive IHC analyses in patients with ESCC. We demonstrated
PD- L1 expression in a significant proportion of patients with ESCC, its association with marked infiltration of TIICs, the prognostic significance of PD-1 and PD-L1
expressions and the impact on clinical outcomes of the
balance between infiltrating effector cells and immune suppressor cells. Given the complex network constituting
anti-tumor immunity, such comprehensive analyses should be applied when assessing immune status in the tumor microenvironment.
MAterIAls And MetHods
Patients and specimensAmong the 372 patients with no prior therapy who underwent surgical resection of esophageal cancer between 2000 and 2011 at the National Cancer Center Hospital East, Kashiwa, Japan, 196 were consecutively enrolled
in this study based on the following selection criteria: i) histologically confirmed squamous cell carcinoma, ii)
pathological T factor of at least T2 according to the TNM
classification [55], iii) complete resection performed, iv) no in-hospital death after surgery, and v) sufficient formalin-fixed paraffin-embedded surgically resected
tissue sample amounts available. Clinical and pathological information was collected from medical records including the pathology report for each subject. The study protocol was approved by the institutional review board of the National Cancer Center in October 2014 (2014–124). The study was carried out according to the Epidemiological
Study Guideline of the Ministry of Health, Labour and
tumor core was obtained from the center of the selected
block, using a manual tissue arrayer (Azumaya Ika Kikai,
Tokyo, Japan). These cores were assembled in a tissue
microarray (TMA) format, and paraffin-embedded TMA
blocks were then cut into 4-mm sections and placed on silicon-coated slides for IHC staining.
Immunohistochemistry
The primary antibodies used for IHC and the IHC assay are described in Supplementary Table S1. For CD4, CD8 and CD68, IHC was performed employing ready-to-use antibodies and the fully automated Ventana Benchmark ULTRA platform (Ventana, Tucson, AZ, USA) according to the manufacturer’s instructions. For CD204, IHC was performed using the Ventana Benchmark ULTRA platform semi-automatically with manual application of the primary antibody. For FOXP3, PD-1 and PD-L1, IHC was performed manually.
Evaluation of PD-L1 expression and tumor infiltrating immune cells
After IHC, the slides were scanned and the
microscopic images were imported as digital photo files
using the NanoZoomer Digital Pathology (NDP) system (Hamamatsu Photonics, Hamamatsu, Japan). PD-L1 expression wasidentified by two independent observers
(KH and SF) blinded to all of the clinical data. To assess PD-L1 in TCs, the proportion of TCs with membrane staining was scored as < 1%, 1–4%, 5–9%, 10%, and
then at 10% intervals up to ≥ 50%. When the difference
between the assessments of the two pathologists was one level or greater, the slide was reviewed jointly and a single consensus score was established. Finally, PD-L1 positive
expression in TCs was defined as the presence of ≥ 1% of TCs with membrane staining based on the hazard ratio
for OS (Supplementary Figure S1). PD-L1 expression in TIICs was determined qualitatively to be either positive (any expression of PD-L1 in TIICs in the core) or negative (no staining).
To quantitatively evaluate each TIIC type, the entire tumor core was reviewed using NDP view at a
magnification of × 200 and 4 independent areas with a size of 0.0625 mm2, containing the greatest abundance of TIICs in the tumor nest, were selected. After counting the TIICs in each selected area using NDP view at a
magnification of × 400, numbers of the respective TIICs
per square millimeter calculated from the total number in the 4 selected areas were presented. We calculated ratios of
infiltrating effector cells to immune suppressor cells, such
as CD8+/FOXP3+ (CD8+ cell count divided by FOXP3+ cell count) and CD8+/CD204+, and ratios of the infiltrating immune suppressor cells to the corresponding whole cell populations, such as FOXP3+/CD4+ and CD204+/CD68+, were also determined.
Statistical analysis
The numbers of each TIIC type were compared according to PD-L1 expression status (positive/negative), in TCs and TIICs, using the Mann-Whitney U test. The Chi-square test was applied to assess the relationships between clinicopathological factors and PD-L1 expressions in TCs and TIICs, and the McNemar test was used to compare the proportions positive for PD-L1
expression between TCs and TIICs. OS was defined as
the period from the date of surgery until the date of death from any cause. Patients were censored at the time of their last follow-up, if they were alive. OS rates were estimated using the Kaplan-Meier method, and were compared using the log-rank test. Immunological factors other than
PD-L1 expression status were dichotomized according to their median values (≥ median/< median).
Univariate and multivariate Cox proportional
hazards models were used to examine the associations
of clinicopathological factors with OS. The impacts of immunological factors (PD-L1 expressions in TCs and TIICs, number of each type of TIIC, and TIIC ratios [CD8+/FOXP3+, CD8+/CD204+, FOXP3+/CD4+ and CD204+/CD68+]) on OS were first examined with univariate Cox regression models. Next, the impact of each immunological factor on OS was assessed by adding each factor to the multivariate model which contained the possibly confounding clinicopathological factors such as age, gender, smoking status, alcohol consumption, location, pT factor, lymph node metastasis, histological grade, lymphatic invasion, and venous invasion. All statistical analyses were performed using IBM SPSS statistics 20 (IBM Japan Ltd., Tokyo, Japan). All P values
were two-sided, with a significance level of 0.05.
ACKNOwLEDgMENTS
We are grateful to Ms. Yuka Nakamura and Ms. Mari Takahashi for a technical assistance.
conflIcts of Interest
The authors have no potential conflicts of interest
related to this work.
gRANT SUPPORT
This study was supported by research funding from the National Cancer Center Hospital East and a Health and
Labor Science Research Grant.
references
2. Enzinger PC, Mayer RJ. Esophageal cancer. N Engl J Med. 2003; 349:2241–2252.
3. Shimazu T, Inoue M, Sasazuki S, Iwasaki M, Kurahashi N, Yamaji T, Tsugane S, Japan Public Health Center-based Prospective Study G. Alcohol and risk of lung cancer among Japanese men: data from a large-scale population-based cohort study, the JPHC study. Cancer Causes Control. 2008; 19:1095–1102.
4. Bagnardi V, Rota M, Botteri E, Tramacere I, Islami F, Fedirko V, Scotti L, Jenab M, Turati F, Pasquali E, Pelucchi C, Galeone C, Bellocco R, et al. Alcohol consumption and site-specific cancer risk: a comprehensive dose-response meta-analysis. Br J Cancer. 2015; 112:580–593.
5. Hecht SS. Tobacco carcinogens, their biomarkers and tobacco-induced cancer. Nat Rev Cancer. 2003; 3:733–744. 6. Liu Y, Chen H, Sun Z, Chen X. Molecular mechanisms
of ethanol-associated oro-esophageal squamous cell carcinoma. Cancer Lett. 2015; 361:164–173.
7. Lin DC, Hao JJ, Nagata Y, Xu L, Shang L, Meng X, Sato Y, Okuno Y, Varela AM, Ding LW, Garg M, Liu LZ, Yang H, et al. Genomic and molecular characterization of esophageal squamous cell carcinoma. Nat Genet. 2014; 46:467–473. 8. Vogelstein B, Papadopoulos N, Velculescu VE, Zhou S,
Diaz LA, Jr., Kinzler KW. Cancer genome landscapes. Science. 2013; 339:1546–1558.
9. Topalian SL, Drake CG, Pardoll DM. Targeting the PD-1/ B7-H1(PD-L1) pathway to activate anti-tumor immunity. Curr Opin Immunol. 2012; 24:207–212.
10. Spira AI, Park K, Mazieres J, Vansteenkiste JF, Rittmeyer A, Ballinger M, Waterkamp D, Kowanetz M, Mokatrin A, Fehrenbacher L. Efficacy, safety and predictive biomarker results from a randomized phase II study comparing MPDL3280A vs docetaxel in 2L/3L NSCLC (POPLAR). ASCO Annual Meeting. Chicago, 2015:Abstract 8010. 11. Gettinger SN, Horn L, Gandhi L, Spigel DR, Antonia SJ,
Rizvi NA, Powderly JD, Heist RS, Carvajal RD, Jackman DM, Sequist LV, Smith DC, Leming P, et al. Overall Survival and Long-Term Safety of Nivolumab (Anti-Programmed Death 1 Antibody, BMS-936558, ONO-4538) in Patients With Previously Treated Advanced Non-Small-Cell Lung Cancer. J Clin Oncol. 2015; 33:2004–2012. 12. McDermott DF, Drake CG, Sznol M, Choueiri TK,
Powderly JD, Smith DC, Brahmer JR, Carvajal RD, Hammers HJ, Puzanov I, Hodi FS, Kluger HM, Topalian SL, et al. Survival, Durable Response, and Long-Term Safety in Patients With Previously Treated Advanced Renal Cell Carcinoma Receiving Nivolumab. J Clin Oncol. 2015; 33:2013–2020.
13. Song Y, Li L, Ou Y, Gao Z, Li E, Li X, Zhang W, Wang J, Xu L, Zhou Y, Ma X, Liu L, Zhao Z, et al. Identification of genomic alterations in oesophageal squamous cell cancer. Nature. 2014; 509:91–95.
14. Brahmer J, Reckamp KL, Baas P, Crino L, Eberhardt WE, Poddubskaya E, Antonia S, Pluzanski A, Vokes EE, Holgado E, Waterhouse D, Ready N, Gainor J, et al. Nivolumab versus
Docetaxel in Advanced Squamous-Cell Non-Small-Cell Lung Cancer. N Engl J Med. 2015; 373:123–135.
15. Doi T, Piha-Paul SA, Jalal SI, Mai-Dang H, Yuan S, Koshiji M, Csiki I, Bennouna J. Pembrolizumab (MK-3475) for patients (pts) with advanced esophageal carcinoma: Preliminary results from KEYNOTE-028. ASCO Annual Meeting. Chicago, 2015:Abstract 4010.
16. Ura T, Muro K, Hara H, Yamaguchi K, Hironaka S, Iwasa S, Kato K, Kojima T, Tsushima T, Yasui H, Satoh T, Doki Y, Ohtsu A, et al. Phase 2 study of Nivolumab (Anti-PD-1; ONO-4538) in Patients with Esophageal Cancer: Preliminary Report. The European Cancer Congress. Vienna, 2015:Abstract 2301.
17. Taube JM, Klein A, Brahmer JR, Xu H, Pan X, Kim JH, Chen L, Pardoll DM, Topalian SL, Anders RA. Association of PD-1, PD-1 ligands, and other features of the tumor immune microenvironment with response to anti-PD-1 therapy. Clin Cancer Res. 2014; 20:5064–5074.
18. Garon EB, Rizvi NA, Hui R, Leighl N, Balmanoukian AS, Eder JP, Patnaik A, Aggarwal C, Gubens M, Horn L, Carcereny E, Ahn MJ, Felip E, et al. Pembrolizumab for the treatment of non-small-cell lung cancer. N Engl J Med. 2015; 372:2018–2028.
19. Herbst RS, Soria JC, Kowanetz M, Fine GD, Hamid O, Gordon MS, Sosman JA, McDermott DF, Powderly JD, Gettinger SN, Kohrt HE, Horn L, Lawrence DP, et al. Predictive correlates of response to the anti-PD-L1 antibody MPDL3280A in cancer patients. Nature. 2014; 515:563–567. 20. Le DT, Uram JN, Wang H, Bartlett BR, Kemberling H,
Eyring AD, Skora AD, Luber BS, Azad NS, Laheru D, Biedrzycki B, Donehower RC, Zaheer A, et al. PD-1 Blockade in Tumors with Mismatch-Repair Deficiency. N Engl J Med. 2015; 372:2509–2520.
21. Ohigashi Y, Sho M, Yamada Y, Tsurui Y, Hamada K, Ikeda N, Mizuno T, Yoriki R, Kashizuka H, Yane K, Tsushima F, Otsuki N, Yagita H, et al. Clinical significance of programmed death-1 ligand-1 and programmed death-1 ligand-2 expression in human esophageal cancer. Clin Cancer Res. 2005; 11:2947–2953.
22. Chen L, Deng H, Lu M, Xu B, Wang Q, Jiang J, Wu C. B7- H1 expression associates with tumor invasion and predicts patient’s survival in human esophageal cancer. Int J Clin Exp Pathol. 2014; 7:6015–6023.
23. Rizvi NA, Hellmann MD, Snyder A, Kvistborg P, Makarov V, Havel JJ, Lee W, Yuan J, Wong P, Ho TS, Miller ML, Rekhtman N, Moreira AL, et al. Cancer immunology. Mutational landscape determines sensitivity to PD-1 blockade in non-small cell lung cancer. Science. 2015; 348:124–128.
25. Yoshioka T, Miyamoto M, Cho Y, Ishikawa K, Tsuchikawa T, Kadoya M, Li L, Mishra R, Ichinokawa K, Shoji Y, Matsumura Y, Shichinohe T, Hirano S, et al. Infiltrating regulatory T cell numbers is not a factor to predict patient’s survival in oesophageal squamous cell carcinoma. Br J Cancer. 2008; 98:1258–1263.
26. Shigeoka M, Urakawa N, Nakamura T, Nishio M, Watajima T, Kuroda D, Komori T, Kakeji Y, Semba S, Yokozaki H. Tumor associated macrophage expressing CD204 is associated with tumor aggressiveness of esophageal squamous cell carcinoma. Cancer Sci. 2013; 104:1112–1119.
27. Dong H, Zhu G, Tamada K, Chen L. B7-H1, a third member of the B7 family, co-stimulates T-cell proliferation and interleukin-10 secretion. Nat Med. 1999; 5:1365–1369. 28. Lipson EJ, Vincent JG, Loyo M, Kagohara LT, Luber BS,
Wang H, Xu H, Nayar SK, Wang TS, Sidransky D, Anders RA, Topalian SL, Taube JM. PD-L1 expression in the Merkel cell carcinoma microenvironment: association with inflammation, Merkel cell polyomavirus and overall survival. Cancer Immunol Res. 2013; 1:54–63.
29. Kim MY, Koh J, Kim S, Go H, Jeon YK, Chung DH. Clinicopathological analysis of PD-L1 and PD-L2 expression in pulmonary squamous cell carcinoma: Comparison with tumor-infiltrating T cells and the status of oncogenic drivers. Lung Cancer. 2015; 88:24–33.
30. Ostrand-Rosenberg S, Horn LA, Haile ST. The programmed death-1 immune-suppressive pathway: barrier to antitumor immunity. J Immunol. 2014; 193:3835–3841.
31. Kondo A, Yamashita T, Tamura H, Zhao W, Tsuji T, Shimizu M, Shinya E, Takahashi H, Tamada K, Chen L, Dan K, Ogata K. Interferon-gamma and tumor necrosis factor-alpha induce an immunoinhibitory molecule, B7- H1, via nuclear factor-kappaB activation in blasts in myelodysplastic syndromes. Blood. 2010; 116:1124–1131. 32. Yang CY, Lin MW, Chang YL, Wu CT, Yang PC.
Programmed cell death-ligand 1 expression in surgically resected stage I pulmonary adenocarcinoma and its correlation with driver mutations and clinical outcomes. Eur J Cancer. 2014; 50:1361–1369.
33. Zhang Y, Wang L, Li Y, Pan Y, Wang R, Hu H, Li H, Luo X, Ye T, Sun Y, Chen H. Protein expression of programmed death 1 ligand 1 and ligand 2 independently predict poor prognosis in surgically resected lung adenocarcinoma. Onco Targets Ther. 2014; 7:567–573.
34. Gadiot J, Hooijkaas AI, Kaiser AD, van Tinteren H, van Boven H, Blank C. Overall survival and PD-L1 expression in metastasized malignant melanoma. Cancer. 2011; 117:2192–2201.
35. Hino R, Kabashima K, Kato Y, Yagi H, Nakamura M, Honjo T, Okazaki T, Tokura Y. Tumor cell expression of programmed cell death-1 ligand 1 is a prognostic factor for malignant melanoma. Cancer. 2010; 116:1757–1766. 36. Taube JM, Anders RA, Young GD, Xu H, Sharma R,
McMiller TL, Chen S, Klein AP, Pardoll DM, Topalian SL,
Chen L. Colocalization of inflammatory response with B7-h1 expression in human melanocytic lesions supports an adaptive resistance mechanism of immune escape. Sci Transl Med. 2012; 4:127ra137.
37. Bellmunt J, Mullane SA, Werner L, Fay AP, Callea M, Leow JJ, Taplin ME, Choueiri TK, Hodi FS, Freeman GJ, Signoretti S. Association of PD-L1 expression on tumor-infiltrating mononuclear cells and overall survival in patients with urothelial carcinoma. Ann Oncol. 2015. 38. Choueiri TK, Fay AP, Gray KP, Callea M, Ho TH,
Albiges L, Bellmunt J, Song J, Carvo I, Lampron M, Stanton ML, Hodi FS, McDermott DF, et al. PD-L1 expression in nonclear-cell renal cell carcinoma. Ann Oncol. 2014; 25:2178–2184.
39. Darb-Esfahani S, Kunze CA, Kulbe H, Sehouli J, Wienert S, Lindner J, Budczies J, Bockmayr M, Dietel M, Denkert C, Braicu I, Johrens K. Prognostic impact of programmed cell death-1 (PD-1) and PD-ligand 1 (PD-L1) expression in cancer cells and tumor-infiltrating lymphocytes in ovarian high grade serous carcinoma. Oncotarget. 2016; 7:1486–1499. doi: 10.18632/oncotarget.6429.
40. Duchnowska R, Peksa R, Radecka B, Mandat T, Trojanowski T, Jarosz B, Czartoryska-Arlukowicz B, Olszewski WP, Och W, Kalinka-Warzocha E, Kozlowski W, Kowalczyk A, Loi S, et al. Immune response in breast cancer brain metastases and their microenvironment: the role of the PD-1/PD-L axis. Breast Cancer Res. 2016; 18:43.
41. Bates GJ, Fox SB, Han C, Leek RD, Garcia JF, Harris AL, Banham AH. Quantification of regulatory T cells enables the identification of high-risk breast cancer patients and those at risk of late relapse. J Clin Oncol. 2006; 24:5373–5380. 42. Curiel TJ, Coukos G, Zou L, Alvarez X, Cheng P,
Mottram P, Evdemon-Hogan M, Conejo-Garcia JR, Zhang L, Burow M, Zhu Y, Wei S, Kryczek I, et al. Specific recruitment of regulatory T cells in ovarian carcinoma fosters immune privilege and predicts reduced survival. Nat Med. 2004; 10:942–949.
43. Sasada T, Kimura M, Yoshida Y, Kanai M, Takabayashi A. CD4+CD25+ regulatory T cells in patients with gastrointestinal malignancies: possible involvement of regulatory T cells in disease progression. Cancer. 2003; 98:1089–1099.
44. Sato E, Olson SH, Ahn J, Bundy B, Nishikawa H, Qian F, Jungbluth AA, Frosina D, Gnjatic S, Ambrosone C, Kepner J, Odunsi T, Ritter G, et al. Intraepithelial CD8+ tumor-infiltrating lymphocytes and a high CD8+/regulatory T cell ratio are associated with favorable prognosis in ovarian cancer. Proc Natl Acad Sci U S A. 2005; 102:18538–18543.
45. Ostrand-Rosenberg S, Sinha P, Beury DW, Clements VK. Cross-talk between myeloid-derived suppressor cells (MDSC), macrophages, and dendritic cells enhances tumor-induced immune suppression. Semin Cancer Biol. 2012; 22:275–281.
Impact of tumor-associated macrophages on invasive ductal carcinoma of the pancreas head. Cancer Sci. 2012; 103:2012–2020.
47. Komohara Y, Ohnishi K, Kuratsu J, Takeya M. Possible involvement of the M2 anti-inflammatory macrophage phenotype in growth of human gliomas. J Pathol. 2008; 216:15–24.
48. Ohtaki Y, Ishii G, Nagai K, Ashimine S, Kuwata T, Hishida T, Nishimura M, Yoshida J, Takeyoshi I, Ochiai A. Stromal macrophage expressing CD204 is associated with tumor aggressiveness in lung adenocarcinoma. J Thorac Oncol. 2010; 5:1507–1515.
49. Jinushi M, Komohara Y. Tumor-associated macrophages as an emerging target against tumors: Creating a new path from bench to bedside. Biochim Biophys Acta. 2015; 1855:123–130.
50. Ostuni R, Kratochvill F, Murray PJ, Natoli G. Macrophages and cancer: from mechanisms to therapeutic implications. Trends Immunol. 2015; 36:229–239.
51. Haas M, Dimmler A, Hohenberger W, Grabenbauer GG, Niedobitek G, Distel LV. Stromal regulatory T-cells are
associated with a favourable prognosis in gastric cancer of the cardia. BMC Gastroenterol. 2009; 9:65.
52. Kayser G, Schulte-Uentrop L, Sienel W, Werner M, Fisch P, Passlick B, Zur Hausen A, Stremmel C. Stromal CD4/CD25 positive T-cells are a strong and independent prognostic factor in non-small cell lung cancer patients, especially with adenocarcinomas. Lung Cancer. 2012; 76:445–451. 53. Yoon HH, Orrock JM, Foster NR, Sargent DJ, Smyrk TC,
Sinicrope FA. Prognostic impact of FoxP3+ regulatory T cells in relation to CD8+ T lymphocyte density in human colon carcinomas. PLoS One. 2012; 7:e42274.
54. Tumeh PC, Harview CL, Yearley JH, Shintaku IP, Taylor EJ, Robert L, Chmielowski B, Spasic M, Henry G, Ciobanu V, West AN, Carmona M, Kivork C, et al. PD-1 blockade induces responses by inhibiting adaptive immune resistance. Nature. 2014; 515:568–571.