www.impactjournals.com/oncotarget/ Oncotarget, Vol. 7, No. 29
INTRODUCTION
Thyroid carcinomas are the most common type of endocrine malignancies, with an incidence steadily
increasing worldwide [1]. The classification of thyroid
carcinomas is made according to cell origin, with well-differentiated thyroid carcinomas (papillary thyroid carcinoma (PTC) and follicular thyroid carcinoma (FTC)) being the most frequent types. FTC is further
sub-classified into oncocytic and non-oncocytic subtypes
with distinct genomic, epigenomic, proteomic and clinical
profiles, according to the Cancer Genome Atlas Research
Network. Poorly differentiated and undifferentiated
(anaplastic) thyroid carcinomas (PDTC and ATC) are less
common but more aggressive [2]. Fine-needle aspiration
(FNA) biopsy is the standard diagnostic test recommended
for the clinical evaluation of thyroid non-secreting nodules
≥ 1 cm [3]. While FNA allows for the reliable recognition
of most classical PTC cases, it stays indeterminate in about
20–30% of cases, mostly for malignant follicular lesions.
The differentiation between benign follicular adenoma and FTC is virtually impossible based on cytological features, since the hallmark of malignancy in FTC is the presence of capsular or vascular invasion, which cannot be assessed
Identification of CHEK1, SLC26A4, c-KIT, TPO and TG as new
biomarkers for human follicular thyroid carcinoma
Anne-Marie Makhlouf1,*, Zhanna Chitikova1,*, Marc Pusztaszeri2, Margaret Berczy2, Celine Delucinge-Vivier3, Frederic Triponez4, Patrick Meyer5, Jacques Philippe1,5, Charna Dibner1,5
1Department of Medical Specialties, Faculty of Medicine, University of Geneva, Geneva, Switzerland 2Division of Clinical Pathology, University Hospital of Geneva, Geneva, Switzerland
3iGE3 Genomics Platform, University of Geneva, Geneva, Switzerland
4Department of Thoracic and Endocrine Surgery, University Hospital of Geneva, Geneva, Switzerland
5Division of Endocrinology, Diabetes, Hypertension and Nutrition, University Hospital of Geneva, Geneva, Switzerland *These authors contributed equally to this work
Correspondence to: Charna Dibner, email: [email protected]
Keywords:follicular thyroid carcinoma, poorly differentiated thyroid carcinoma, NanoString analysis, diagnostic biomarkers
Received: April 01, 2016 Accepted: June 03, 2016 Published: June 18, 2016
ABSTRACT
The search for preoperative biomarkers for thyroid malignancies, in particular for follicular thyroid carcinoma (FTC) diagnostics, is of utmost clinical importance. We thus aimed at screening for potential biomarker candidates for FTC. To evaluate dynamic alterations in molecular patterns as a function of thyroid malignancy progression, a comparative analysis was conducted in clinically distinct subgroups of FTC and poorly differentiated thyroid carcinoma (PDTC) nodules. NanoString analysis of FFPE samples was performed in 22 follicular adenomas, 56 FTC and 25 PDTC nodules, including oncocytic and non-oncocytic subgroups. The expression levels of CHEK1, c-KIT, SLC26A4, TG and TPO were significantly altered in all types of thyroid carcinomas. Based on collective changes of these biomarkers which correlating among each other, a predictive score has been established, allowing for discrimination between benign and FTC samples with high sensitivity and specificity. Additional transcripts related to thyroid function, cell cycle, circadian clock, and apoptosis regulation were altered in the more aggressive oncocytic subgroups only, with expression levels correlating with disease progression. Distinct molecular patterns were observed for oncocytic and non-oncocytic FTCs and PDTCs. A predictive score correlation coefficient based on collective alterations of identified here biomarkers might help to improve the preoperative diagnosis of FTC nodules.
www.impactjournals.com/oncotarget
by FNA. Therefore, surgery is generally recommended for these patients [3]. Postoperatively, the majority of indeterminate cases are classified as benign, revealing a significant rate of unnecessary surgeries, complications,
and even morbidity [1].
Numerous studies have aimed to find predictive
factors of malignancy before patients undergo surgery, including genetic analyses and search for molecular
biomarkers [4]. A particular effort has been thus undertaken in the field to explore molecular alterations and genetic
mutations, which may allow for the accurate pre-operative clinical diagnostics of FTC ([5] and references therein). The presence of RAS point mutations or PAX8/PPARγ rearrangement in FTC might represent such diagnostic markers, with RAS demonstrating also a strong association with disease aggressiveness [6]. However, the sensitivity of these gene analyses is very low. Moreover, RAS or PAX8/PPARγ alterations are also found in a subset of follicular adenomas, therefore limiting their predictive value. Substantial efforts including large-scale screening studies have revealed numerous potential biomarkers for the preoperative diagnostic of FTC, however, none of those provide conclusive results for patients with indeterminate
thyroid FNA cytology [7]. Therefore, the search for reliable
preoperative markers of FTC cases with indeterminate cytology stays of utmost clinical importance.
Our recent work has allowed for the identification
of new potential biomarkers for postoperative PTC FFPE samples [8] employing NanoString analysis [9]. Parallel
assessment of changes in the expression levels of several
biomarkers in the same sample has let us to establish a predictive score based on the combined changes of these candidate genes, and thus provides a more accurate diagnostic test compared to alterations of one transcript only. Moreover, cell cycle regulator CHEK1 and circadian clock component BMAL1 have been identified as potential
biomarkers for PTC [8]. Employing the settings developed by us for the analysis of FFPE samples by NanoString [8], we now aimed at screening for potential biomarker candidates and molecular patterns in FTC, including different subgroups within the FTC category. To evaluate
the dynamics of thus identified transcript alterations as
a function of thyroid malignancy progression, the same analysis was conducted in PDTC nodules.
RESULTS
Transcriptional alterations in different subgroups of FTC nodules assessed by NanoString analysis
12 healthy thyroid samples and 22 benign thyroid nodules (follicular adenomas) obtained during planned thyroid surgeries (see Supplementary Table S1 for donor
characteristics), were subjected to NanoString analysis.
The panel of 22 genes (Supplementary Table S4),
comprising those related to thyroid function, core clock, cell cycle and apoptosis, was analyzed (for gene selection details see Materials and Methods). NanoString analysis revealed that transcriptional pattern of the benign thyroid
nodule was not significantly altered for any of 22 analyzed
genes, in comparison to healthy thyroid tissue, with no
transcript exhibiting significant difference in their false discovery rate (FDR) 5% (Supplementary Table S5).
In an attempt to identify the transcripts with altered
expression levels upon FTC development, FTC samples
(see Supplementary Table S2 for donor characteristics and postoperative diagnosis) were analyzed by NanoString.
Expression levels of the same 22 genes (Supplementary
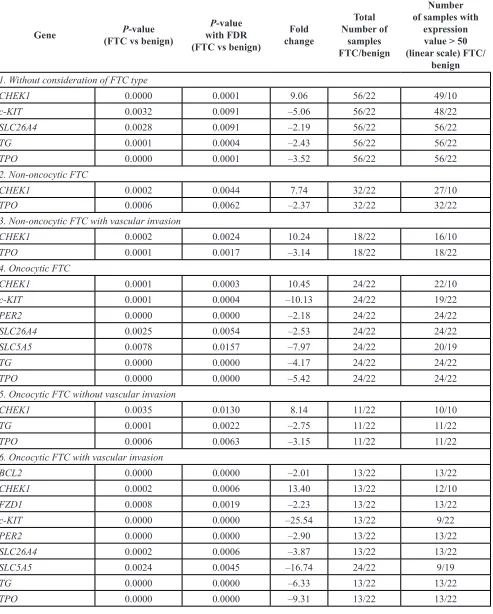
Table S4) were compared between 56 FTC and 22 follicular adenomas described above. NanoString analysis revealed that the cell-cycle related transcript CHEK1 was upregulated 9-fold in FTC, compared to the
benign counterpart (Table 1, subgroup 1). Along with the
upregulation of CHEK1, a 2 to 5-fold downregulation of c-KIT, SLC26A4, TG and TPO transcript levels was observed in FTC (Table 1, subgroup 1).
To address a possible correlation between the oncocytic feature of FTC nodules, representing a more aggressive form of the disease, and clinical diagnostics
we next compared transcript changes in non-oncocytic
versus oncocytic subgroups. Furthermore, taking into account the clinical and molecular heterogeneity of FTC depending on the presence of capsular or vascular invasion, differential analysis of samples with and without capsular and vascular invasion was performed within each subgroup
(Supplementary Table S2). As presented at Table 1
subgroup 2, FTC with non-oncocytic diagnostics and
without capsular invasion exhibited a 7.7-fold upregulation
of CHEK1 and a 2-fold downregulation of TPO. Similar results, with slightly stronger fold changes for both markers, were observed for non-oncocytic FTC with
vascular invasion (Table 1, subgroup 3). In the oncocytic
subgroup of FTC (Table 1, subgroup 4), in addition to the 10-fold upregulation of CHEK1 and the 5-fold downregulation of TPO, c-KIT, SLC26A4, SLC5A5, TG and PER2 levels were downregulated. Strikingly, oncocytic
samples without vascular invasion exhibited relatively
milder changes in CHEK1, TPO and TG (Table 1, subgroup 5). The strongest alterations of CHEK1, TPO, c-KIT, SLC26A4, SLC5A5, TG and PER2 were observed in FTC oncocytic samples with vascular invasion (Table 1, subgroup 6). Furthermore, two additional transcripts, BCL2 and FZD1, were significantly downregulated in these samples. No significant differences in the molecular pattern
were observed comparing subgroups with and without capsular invasion (data not shown).
NanoString analysis of PDTC nodules
group of 25 FFPE samples with postoperative PDTC
diagnosis (Supplementary Table S3). NanoString
analysis of 22 transcripts (Supplementary Table S4) was performed for these samples and compared to benign and
FTC counterparts analyzed in parallel. The expression
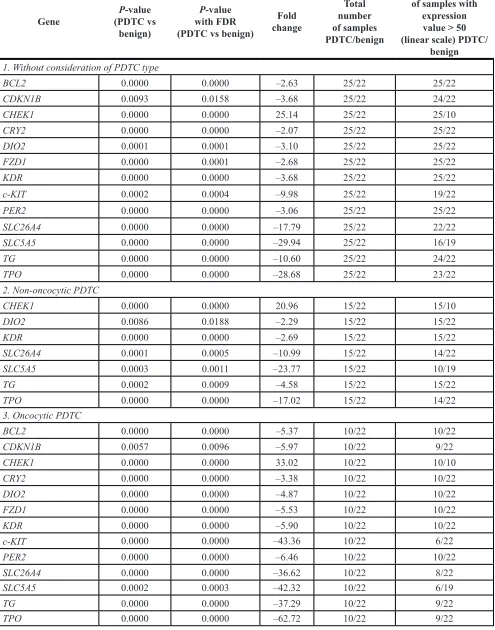
levels of CHEK1, c-KIT, SLC26A4, TG and TPO were
altered in a more extreme manner in PDTC than in FTC
(compare subgroups 1 in Tables 1, 2). In addition, the levels of DIO2, KDR, CDKN1B, FZD1, BCL2, PER2, CRY2 and SLC5A5 were strongly downregulated in PDTC.
Next, transcript level changes in the oncocytic and
non-oncocytic PDTC were evaluated separately. Consistent with the trend observed in FTC, relatively milder alterations were observed in the non-oncocytic PDTC subgroup for CHEK1, DIO2, KDR, SLC26A4, SLC5A5, TG and TPO (Table 2, subgroup 2). By contrast, along with CHEK1 exhibiting 33-fold up-regulation and c-KIT, SLC26A4, SLC5A5, TG, and TPO exhibiting over
35-fold downregulation, the levels of CDKN1B, DIO2, FZD, and KDR were significantly down-regulated (Table 2, subgroup 3). Apoptosis marker BCL2 and circadian core-clock genes CRY2 and PER2 were further downregulated in this subgroup if compared to all PDTCs (Table 2,
compare subgroup 3 to 1).
Alterations of CHEK1, c-KIT, SLC26A4, TG and TPO expression levels in FTC exhibit pair-wise correlations
Given that the NanoString approach allows for the
assessment of numerous transcript levels within the same
sample, we next performed pair-wise correlation analysis among the transcripts that exhibited the most pronounced
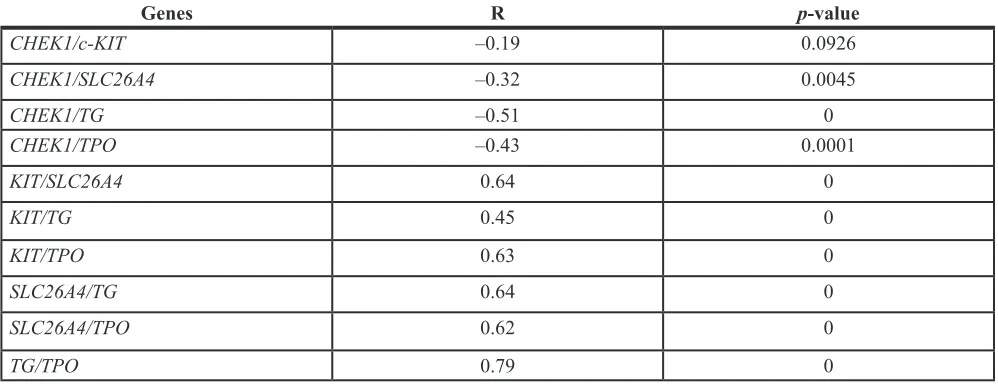
alterations in FTC. Pair-wise correlation analyses of the combined set of 56 FTC samples enrolled in this study (Supplementary Table S2) revealed that alterations of CHEK1, c-KIT, SLC26A4, TG and TPO were significantly correlated (Table 3). Specifically, c-KIT, SLC26A4, TG and TPO exhibited moderate to strong positive correlations,
while CHEK1 was weakly inversely correlated with
rest of the transcripts (Table 3). Therefore, this group of
transcripts represents a plausible cluster of biomarkers whose collective changes are associated with FTC development, and might thus be potentially predictive of FTC diagnosis.
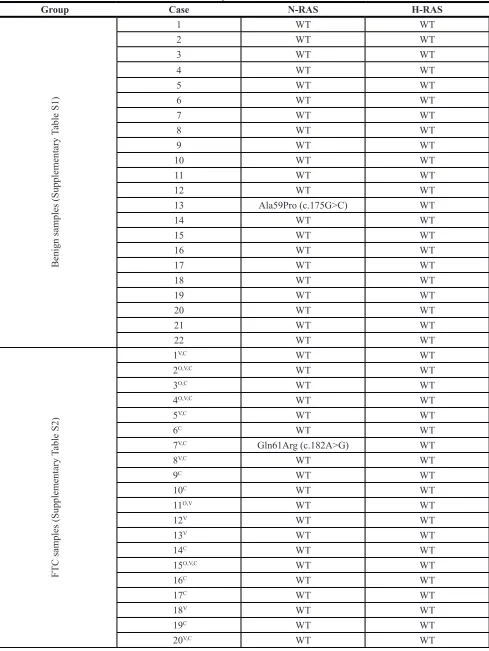
RAS mutation analysis in the FTC samples To acquire additional valuable characteristics of the FTC nodules analyzed in this study by NanoString, we conducted N-RAS61 and H-RAS61mutation analysis
[10] for the same FTC nodules. As listed in Table 4, 8.9% (5/56) of FTC samples exhibited the N-RAS61mutation,
in an agreement with previous reports [11]. A similar
frequency of the N-RAS61mutation (8.3%; 2/24) was
observed for the oncocytic FTC subgroup.Surprisingly,
one out of 22 benign samples exhibited an N-RAS61 mutation different from those detected in FTCs (Table 4). Of note, this particular type of N-RAS61 mutation
(Ala59Pro (c.175G > C)) detected in the benign sample has never been described previously. With regard to
H-RAS61,one sample was identified as positive within all FTC samples. This sample was classified in the oncocytic
FTC group (Table 4). No H-RAS61 mutation was detected in the benign samples.
Predictive score for FTC diagnostics based on combined gene expression level changes
In an attempt to correlate the degree of expression
level changes of CHEK1, c-KIT, SLC26A4, TG and TPO with the histological diagnosis, we aimed at establishing
a gene expression-based predictive score, taking into account the collective biomarker changes [12, 13]. A final
predictive score was established for each biological sample,
based on the expression levels of five distinctive genes
(CHEK1, c-KIT, SLC26A4, TG and TPO), which exhibit
stable changes in FTC and correlate among each other,
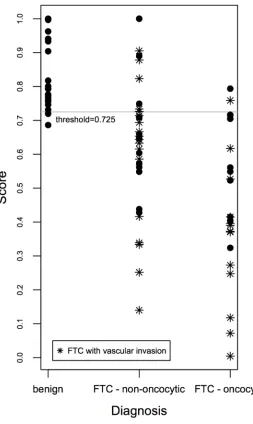
using the Linear Prediction Score (LPS; for details see Supplementary Methods; [13]). To test the performance of the score, a receiver operating characteristic (ROC) analysis was performed, and ROC curves were established (see Supplementary Figure S1A and Supplementary Methods). Our results indicate that at a threshold of 0.725, based on empirical curve analysis (Supplementary Figure S1A, Supplementary Tables S6, S7), our predictive score discriminates FTC from benign cases with 96% sensitivity and 82% specificity. Of note, such discrimination was
more sensitive for the oncocytic FTC cases compared to
their non-oncocytic counterparts (significantly more false
negatives for non-oncocytic than for oncocytic FTC, see
Figure 1). Moreover, FTCs with vascular invasion exhibited
the highest scores, if compared with their counterparts that do not bear vascular invasion (Figure 1).
In spite of the relatively high fold changes in FTC, CHEK1 exhibited weak correlations with the rest of the identified biomarkers. To identify a cluster of biomarkers,
which will give the most reliable predictive score, we tested predictive scores based on the combinations of c-KIT, SLC26A4, TG, TPO and SLC26A4, TG, TPO
(Supplementary Figures S1B–S1C and S2A–S2B) that gave slightly weaker specificity (77%) or sensitivity (95%), respectively. Finally, a predictive score based on the
combination of BCL2, CHEK1, CRY2, KDR, c-KIT, PER2, SLC26A4, TG, and TPO was established (Supplementary Figures S1D and S2C). It allows for the discrimination
of FTC from benign with 97% sensitivity and 78% specificity. In agreement with the first predictive score (Figure 1), specificity of the predictive score was higher
for the oncocytic subgroup compared to the non-oncocytic subgroup, and the highest for FTCs bearing vascular
www.impactjournals.com/oncotarget
based on the combination of CHEK1, c-KIT, SLC26A4, TG and TPO allows for the most accurate prediction of
FTC diagnosis (Figure 1). Although these results strongly
suggest a predictive value for FTC diagnosis based on the
combined assessment of 5 gene expression level changes,
follow-up studies with a higher number of samples will be required to estimate the here proposed score validity.
In accordance with the gene expression-based score
previously established by us for PTC, we employed the BRAF mutation status as an additional parameter for establishing the correlation with postoperative clinical evaluation [8]. However, due to the low frequency of the N-RAS61 and H-RAS61 mutation in our FTC cohort (8.9% and 1.8% respectively; Table 4), and lack of correlation between the mutation frequency and disease progression, the RAS mutational status was not taken into account for the predictive score established for FTC.
DISCUSSION
Altered transcript expression in human FTC: identification of new and confirmation of previously reported potential biomarkers by NanoString analysis
NanoString nCounterTM, a color-coded probe-based method, represents a highly sensitive approach for the
quantification of gene expression. Based on direct probe
hybridization, it allows for the collective assessment of a large number of transcripts within the same sample, including high precision analyses of FFPE samples, as previously reported by us and others [8, 14, 15].
Employing NanoString analysis, we report for the
[image:4.612.182.435.263.687.2]first time a strong upregulation of the essential cell cycle
Figure 1: Scatter plot of the gene expression-based predictive score correlated with FTC aggressiveness. The gene expression-based score for benign and FTC samples was calculated based on joint expression levels of CHEK1, c-KIT, SLC26A4, TG and
Table 1: Altered transcript expression in FTC samples as compared to benign counterparts
Gene (FTC vs benign)P-value with FDR P-value (FTC vs benign)
Fold change
Total Number of
samples FTC/benign
Number of samples with
expression value > 50 (linear scale) FTC/
benign
1. Without consideration of FTC type
CHEK1 0.0000 0.0001 9.06 56/22 49/10
c-KIT 0.0032 0.0091 –5.06 56/22 48/22
SLC26A4 0.0028 0.0091 –2.19 56/22 56/22
TG 0.0001 0.0004 –2.43 56/22 56/22
TPO 0.0000 0.0001 –3.52 56/22 56/22
2. Non-oncocytic FTC
CHEK1 0.0002 0.0044 7.74 32/22 27/10
TPO 0.0006 0.0062 –2.37 32/22 32/22
3. Non-oncocytic FTC with vascular invasion
CHEK1 0.0002 0.0024 10.24 18/22 16/10
TPO 0.0001 0.0017 –3.14 18/22 18/22
4. Oncocytic FTC
CHEK1 0.0001 0.0003 10.45 24/22 22/10
c-KIT 0.0001 0.0004 –10.13 24/22 19/22
PER2 0.0000 0.0000 –2.18 24/22 24/22
SLC26A4 0.0025 0.0054 –2.53 24/22 24/22
SLC5A5 0.0078 0.0157 –7.97 24/22 20/19
TG 0.0000 0.0000 –4.17 24/22 24/22
TPO 0.0000 0.0000 –5.42 24/22 24/22
5. Oncocytic FTC without vascular invasion
CHEK1 0.0035 0.0130 8.14 11/22 10/10
TG 0.0001 0.0022 –2.75 11/22 11/22
TPO 0.0006 0.0063 –3.15 11/22 11/22
6. Oncocytic FTC with vascular invasion
BCL2 0.0000 0.0000 –2.01 13/22 13/22
CHEK1 0.0002 0.0006 13.40 13/22 12/10
FZD1 0.0008 0.0019 –2.23 13/22 13/22
c-KIT 0.0000 0.0000 –25.54 13/22 9/22
PER2 0.0000 0.0000 –2.90 13/22 13/22
SLC26A4 0.0002 0.0006 –3.87 13/22 13/22
SLC5A5 0.0024 0.0045 –16.74 24/22 9/19
TG 0.0000 0.0000 –6.33 13/22 13/22
www.impactjournals.com/oncotarget
Table 2: Altered transcript expression in PDTC samples as compared to benign counterparts
Gene (PDTC vs P-value benign)
P-value with FDR (PDTC vs benign)
Fold change
Total number of samples PDTC/benign
Number of samples with
expression value > 50 (linear scale) PDTC/
benign
1. Without consideration of PDTC type
BCL2 0.0000 0.0000 –2.63 25/22 25/22
CDKN1B 0.0093 0.0158 –3.68 25/22 24/22
CHEK1 0.0000 0.0000 25.14 25/22 25/10
CRY2 0.0000 0.0000 –2.07 25/22 25/22
DIO2 0.0001 0.0001 –3.10 25/22 25/22
FZD1 0.0000 0.0001 –2.68 25/22 25/22
KDR 0.0000 0.0000 –3.68 25/22 25/22
c-KIT 0.0002 0.0004 –9.98 25/22 19/22
PER2 0.0000 0.0000 –3.06 25/22 25/22
SLC26A4 0.0000 0.0000 –17.79 25/22 22/22
SLC5A5 0.0000 0.0000 –29.94 25/22 16/19
TG 0.0000 0.0000 –10.60 25/22 24/22
TPO 0.0000 0.0000 –28.68 25/22 23/22
2. Non-oncocytic PDTC
CHEK1 0.0000 0.0000 20.96 15/22 15/10
DIO2 0.0086 0.0188 –2.29 15/22 15/22
KDR 0.0000 0.0000 –2.69 15/22 15/22
SLC26A4 0.0001 0.0005 –10.99 15/22 14/22
SLC5A5 0.0003 0.0011 –23.77 15/22 10/19
TG 0.0002 0.0009 –4.58 15/22 15/22
TPO 0.0000 0.0000 –17.02 15/22 14/22
3. Oncocytic PDTC
BCL2 0.0000 0.0000 –5.37 10/22 10/22
CDKN1B 0.0057 0.0096 –5.97 10/22 9/22
CHEK1 0.0000 0.0000 33.02 10/22 10/10
CRY2 0.0000 0.0000 –3.38 10/22 10/22
DIO2 0.0000 0.0000 –4.87 10/22 10/22
FZD1 0.0000 0.0000 –5.53 10/22 10/22
KDR 0.0000 0.0000 –5.90 10/22 10/22
c-KIT 0.0000 0.0000 –43.36 10/22 6/22
PER2 0.0000 0.0000 –6.46 10/22 10/22
SLC26A4 0.0000 0.0000 –36.62 10/22 8/22
SLC5A5 0.0002 0.0003 –42.32 10/22 6/19
TG 0.0000 0.0000 –37.29 10/22 9/22
component CHEK1 in FTC samples (Table 1). Alterations
in CHEK1 levels have been previously described by us in PTC (Table 5, [8]), and in a number of non-thyroid
malignancies by other groups [16, 17]. A recent report
reveals that CHEK2 (but not CHEK1) levels are altered
in PDTC and ATC [18]. In addition, transcript levels
of the solute carrier (SLC) family members SLC26A4 (encoding for pendrin) and SLC5A5 were significantly
downregulated in samples without consideration of FTC type, and in oncocytic FTC, respectively (Table 1). Our recent study revealed that SLC26A4 has a tendency for downregulation in human PTC [8]. Interestingly, the SLC26A4 gene methylation pattern in benign adenoma was altered in thyroid carcinoma, with methylation levels
being inversely correlated to the gene expression levels,
suggesting that such epigenetic changes might represent a new mechanism in altering SLC26A4 gene function during thyroid carcinoma tumorigenesis [19]. SLC5A5 was previously reported to be downregulated in thyroid carcinomas by us and others [8, 20]. Of note, pendrin was
suggested to be a downstream target of the TTF-1/Nkx-2.1
homeodomain transcription factor in differentiated thyroid cells [21]. In good agreement with previous work [22], our current analysis reveals that thyroglobulin (TG) was
significantly downregulated in FTC (Table 1). Assuming
that thyroid tissue is de-differentiating upon carcinoma development, this might be a plausible mechanism by which SLC26A4 and TG are downregulated in FTC. To
further explore this link, it might be interesting to assess the expression of TTF1 and Nkx2.1 in the same human
carcinoma samples in the future. With regard to the strong
downregulation of c-KIT observed by us in FTC (Table 1), to the best of our knowledge such downregulation has not been previously associated with human FTC, while a similar tendency has been previously reported in PTC
by us and others [8]. Finally, in an agreement with the
previously established role of thyroid peroxidase (TPO) in oncogenic transformation in general, and its association
with human thyroid carcinomas [23, 24], our analysis has
shown a strong downregulation of this transcript in all FTC samples (Table 1).
In summary, our study reveals for the first time
that transcript levels of CHEK1 are strongly upregulated
in human FTCs. Moreover, it further confirms
downregulation of SLC26A4, SLC5A5, c-KIT, TG, and TPO in the same FTC samples, in good agreement with previous publications.
Cell cycle regulators and core-clock components in human thyroid carcinomas
There is growing evidence on the importance of biological rhythms in the pathophysiology and treatment
of cancer [25–28]. Recent findings have revealed that the circadian clock and cell cycle might be linked [29–32]. Here, we show for the first time a downregulation of PER2 core-clock transcript levels in oncocytic FTC, and PDTC cases (Table 1–2). Of note, PER2 has been previously demonstrated to play a key role as tumor suppressor, by
regulating DNA damage responsive pathways [33]. The
levels of another clock transcript, CRY2, were significantly
downregulated in PDTC, and even further downregulated in oncocytic PDTC (Table 2), in agreement with our previous study, demonstrating downregulation of CRY2
in PTC (Table 5 [8]). The alterations in expression levels
of PER2 and CRY2 described here in PDTCs are in line with the results of our previous study, demonstrating that the molecular characteristics of the human thyroid clock are altered in primary cultured thyrocytes derived
[image:7.612.58.557.82.275.2]from PDTC biopsies [34]. Furthermore, a key cell cycle
Table 3: Pair-wise correlation coefficients (R) for
CHEK1
,
c-KIT
,
SLC26A4
,
TPO
and
TG
levels in
FTCs
Genes R p-value
CHEK1/c-KIT –0.19 0.0926
CHEK1/SLC26A4 –0.32 0.0045
CHEK1/TG –0.51 0
CHEK1/TPO –0.43 0.0001
KIT/SLC26A4 0.64 0
KIT/TG 0.45 0
KIT/TPO 0.63 0
SLC26A4/TG 0.64 0
SLC26A4/TPO 0.62 0
www.impactjournals.com/oncotarget
Table 4:
NRAS61
and
HRAS61
mutation analysis
Group Case N-RAS H-RAS
Benign samples (Supplementary
Table S1)
1 WT WT
2 WT WT
3 WT WT
4 WT WT
5 WT WT
6 WT WT
7 WT WT
8 WT WT
9 WT WT
10 WT WT
11 WT WT
12 WT WT
13 Ala59Pro (c.175G>C) WT
14 WT WT
15 WT WT
16 WT WT
17 WT WT
18 WT WT
19 WT WT
20 WT WT
21 WT WT
22 WT WT
FTC samples (Supplementary
Table S2)
1V,C WT WT
2O,V,C WT WT
3O,C WT WT
4O,V,C WT WT
5V,C WT WT
6C WT WT
7V,C Gln61Arg (c.182A>G) WT
8V,C WT WT
9C WT WT
10C WT WT
11O,V WT WT
12V WT WT
13V WT WT
14C WT WT
15O,V,C WT WT
16C WT WT
17C WT WT
18V WT WT
19C WT WT
regulator CHEK1 exhibited significant alterations in all
groups of malignancies, with increasing fold changes from
FTC to PDTC (Table 5). Additional cell cycle regulator
CDKN1B was significantly downregulated in PDTCs
(Table 2). Finally, we demonstrate that the apoptosis
related gene BCL2, previously reported to be associated
with a number of malignancies by other groups [16, 17], exhibits a downregulation in FTC, PTC and PDTC, with
a progressive increase in fold change associated with malignancy progression (Table 5, [8]).
FTC samples (Supplementary
Table 2)
21V WT WT
22V WT WT
23V WT WT
24O,C WT WT
25O,C WT WT
26V WT WT
27O,C WT WT
28O,V,C WT WT
29O,C Gln61Arg (c.182A>G) WT
30O,V,C WT WT
31O,V,C WT Gln61Arg (c.182A>G)
32O,C WT WT
33O,V,C WT WT
34O,V,C WT WT
35O,V,C WT WT
36O,C WT WT
37O,C WT WT
38O,C WT WT
39O,V,C WT WT
40V WT WT
41C WT WT
42C WT WT
43V,C Gln61Arg (c.182A>G) WT
44V,C WT WT
45C WT WT
46C WT WT
47C Gln61Arg (c.182A>G) WT
48C WT WT
49C WT WT
50O,C WT WT
51O,V,C WT WT
52V,C WT WT
53O,C Gln61Arg (c.182A>G) WT
54O,V,C WT WT
55V WT WT
56V WT WT
www.impactjournals.com/oncotarget
Taken together, these data suggest a correlation between the transcriptional changes in the levels of the circadian clock, the cell cycle key components, and the increasing the risk for oncogenic transformation and progression. Providing further insights into the molecular mechanisms that underlie the alterations in key components of the core-clock, cell cycle and apoptosis, and their roles in thyroid malignancy progression, might
be of great scientific and clinical interest.
Correlation between the molecular biomarker alterations and the clinical progression of human thyroid carcinomas
Strikingly, the pattern of molecular biomarkers
identified by our analyses was strongly associated with
the clinical diagnostics of the FTC and PDTC subgroups (Tables 1–2). Both oncocytic FTC and PDTC groups
exhibited a higher number of altered genes compared
to their non-oncocytic counterparts. For instance, a key component of WNT signaling, FZD1, whose downregulation might be associated with increased growth
and invasiveness of FTCs [35], was significantly decreased
in oncocytic FTC and PDTC only, while it stayed unchanged in non-oncocytic samples (Tables 1–2). In addition, transcripts, which were altered in both oncocytic
and non-oncocytic subgroups, exhibited consistently higher
fold-changes in the oncocytic group versus non-oncocytic
counterparts (compare subgroups 4–6 to 2–3 in Table 1 and subgroups 3 and 2 at Table 2). These data further support
the hypothesis that oncocytic and non-oncocytic variants of human thyroid carcinomas might bear distinct molecular
pattern [36]. Additionally, FTC with vascular invasion exhibited more pronounced changes of molecular markers,
if compared to their counterparts without vascular invasion (Table 1), further suggesting that vascular invasion represents a hallmark of malignancy, accompanied by
dramatic changes in the molecular pattern [36].
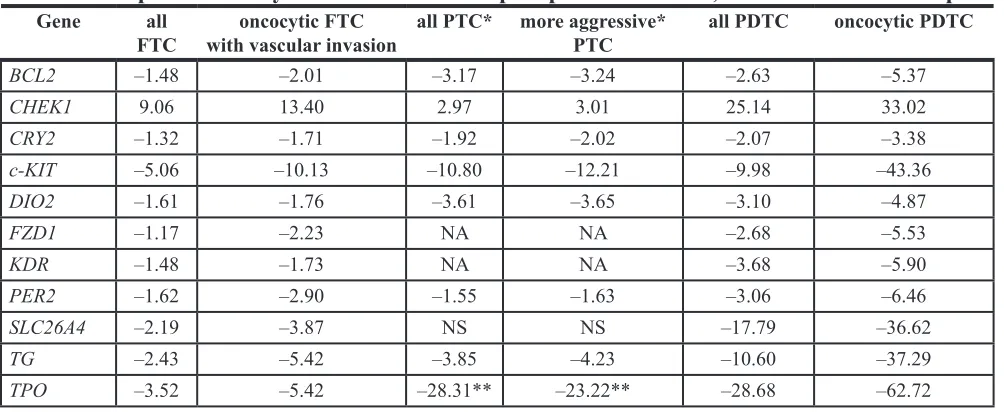
Of note, the comparative investigation of gene
expression levels assessed by NanoString analyses in three major clinical groups of human thyroid carcinomas
(FTC, PTC and PDTC [8]), reveals that alterations levels of several transcripts might be gradually increasing in
conjunction with tumor progression (Table 5). Such
tendency was observed for BCL2, CRY2, c-KIT, DIO2, FZD1, KDR, PER2, SLC26A4, TG and TPO, (Table 5). For CHEK1, however, alteration levels in PTC were lower than those observed for FTC, which might be attributed to the relatively small number of cohorts analyzed in both studies.
Towards a reliable correlation coefficient for the diagnosis of FTC: a gene expression-based predictive score
Correlation analysis of the most promising biomarkers for FTC (CHEK1, c-KIT, SLC26A4, TG and TPO) allowed for the establishment of a predictive score that discriminates between benign and FTC samples with
96% sensitivity and 82% specificity at a threshold of 0.725 (Figure 1). While this score was moderately reliable for
[image:10.612.58.560.64.270.2]the non-oncocytic subgroup of FTC (Figure 1), in case of oncocytic FTC only two false-negatives were observed (Figure 1). The most reliable prediction was provided for oncocytic cases with vascular invasion, based on
Table 5: Comparative analysis of altered transcript expression in FTC, PTC* and PDTC samples
Gene all
FTC with vascular invasiononcocytic FTC all PTC* more aggressive* PTC all PDTC oncocytic PDTC
BCL2 –1.48 –2.01 –3.17 –3.24 –2.63 –5.37
CHEK1 9.06 13.40 2.97 3.01 25.14 33.02
CRY2 –1.32 –1.71 –1.92 –2.02 –2.07 –3.38
c-KIT –5.06 –10.13 –10.80 –12.21 –9.98 –43.36
DIO2 –1.61 –1.76 –3.61 –3.65 –3.10 –4.87
FZD1 –1.17 –2.23 NA NA –2.68 –5.53
KDR –1.48 –1.73 NA NA –3.68 –5.90
PER2 –1.62 –2.90 –1.55 –1.63 –3.06 –6.46
SLC26A4 –2.19 –3.87 NS NS –17.79 –36.62
TG –2.43 –5.42 –3.85 –4.23 –10.60 –37.29
TPO –3.52 –5.42 –28.31** –23.22** –28.68 –62.72
NS - non significant. NA - not assessed.
the subset of samples analyzed in our work (Figure 1). Importantly, our predictive score is only indicative at this
point and demands rigorous confirmation in subsequent
follow-up studies.
Assessment of preoperative biomarkers for thyroid carcinomas through microRNA screening [37], proteome, and lipidome analyses [38, 39] have recently proven to be
highly promising strategies. Thus, integrative approaches including the here established predictive score based on the combined alterations of several molecular biomarker levels, possibly in combination with biomarkers assessed
by microRNA, proteomic and lipidomic profiling, might
encompass a great potential towards increasing the reliability of the preoperative diagnostics for thyroid carcinomas.
MATERIALS AND METHODS
Study participants and thyroid tissue sampling FFPE samples from benign, FTC and PDTC human thyroid nodules were obtained from the archive of the
Pathology Department, Geneva University Hospital.
Donor characteristics are summarized in Supplementary
Tables S1–S3. Malignant tumors were classified by histopathological analysis according to the World Health Organization Classification of Thyroid Tumors [40] and staged according to the AJCC Cancer Staging Manual 7th ed (see Supplementary Data for more details on the
diagnostics). In addition, the diagnostics of PDTC cases
was made using the Turin criteria [41]. Written informed
consent was obtained from each patient and the study protocol was approved by the local Ethics Committee
(CER 11-014).
RNA extraction from FFPE samples
RNA was extracted using the High Pure miRNA isolation kit (Roche) according to the manufacturer’s
instruction, as previously described by us in details [8].
Gene expression quantification using multiplexed, color-coded probe pairs (NanoString nCounterTM)
53 candidate genes were selected for analysis, based on our own previous studies [8, 34], and on literature
search. Several transcripts, previously demonstrated
to exhibit strong expression level changes in the FTC
and PDTC, such as TIMP1, c-MET and c-KIT [20, 42], were included for the correlation analysis. Probes were designed and synthesized by NanoString nCounterTM
technologies. 22 genes out of 53 overlapping between the three independent NanoString experiments (codesets), exhibited significant alterations in thyroid carcinoma
(Supplementary Table S4) and were therefore used for
subsequent analyses. 200–400 ng of total RNA, extracted
from FFPE samples, were hybridized with multiplexed NanoString probes, as described in [9], from 3 independent NanoString experiments (codesets 1, 2 and 3). Background
correction, codeset calibration, and statistical analysis were performed as described in Supplementary Methods.
RAS mutation analysis
For the analysis of N-RAS61 and H-RAS61
mutations, 3 µm thick FFPE tissue sections were deparaffinized in xylol, proteins were digested over night at 56°C and DNA was subsequently processed on the QIAcube using the QIAamp DNA FFPE Tissue Kit (QIAGEN). PCR was performed as previously described [43] using the following primers: HRAS61
forward 5′-TGTCCTCCTGCAGGATTC-3′ and reverse 5′-GTACTGGTGGATGTCCTC-3′, NRAS61 forward
5′-CACCCCCAGGATTCTTACAG-3′ and reverse 5′-TCCGCAAATGACTTGCTATT-3′. PCR products were separated on agarose gel, purified using the peqGold gel extraction kit (Peqlab), sequenced and analyzed on a capillary automatic sequencer (Applied Biosystems 96-capillary 3730xl).
Abbreviations
ATC: Anaplastic Thyroid Carcinoma; BCL2: B-Cell CLL/Lymphoma 2; BMAL1: Brain and muscle ARNT-like protein 1; CHEK1: Checkpoint Kinase 1; c-KIT: V-Kit Hardy-Zuckerman 4 Feline Sarcoma; Viral Oncogene Homolog; CRY2: Cryptochrome 2; DIO2: Deiodinase, Iodothyronine, Type II; FDR: False Discovery Rate; FTC: Follicular Thyroid Carcinoma; FFPE: Formalin-fixed Paraffin-embedded; FNA: Fine Needle Aspiration; FZD1: Frizzled Class Receptor 1; HRAS: Harvey Rat Sarcoma Viral Oncogene; Homolog; KDR: Kinase Insert Domain Receptor; Nkx-2.1: NK2 Homobox 1; NRAS: Neuroblastoma RAS Viral Oncogene; Homolog; PAX 8: Paired box 8; PER2: Period 2; PDTC: Poorly Differentiated Thyroid Carcinoma; PPARγ: Peroxisome Proliferator-Activated Receptor; Gamma; PTC: Papillary Thyroid Carcinoma; ROC: Receiver Operating Characteristic; SLC26A4: Solute Carrier Family 26 (Anion; Exchanger), Member 4; SLC5A5: Solute Carrier Family 5 (Sodium/Iodide; Cotransporter), Member 5; TTF1: Transcription Termination Factor, RNA; Polymerase I; TG: Thyroglobulin; TIMP1: Tissue Inhibitor of Metalloproteinase 1; TPO: Thyroid Peroxidase; WEE1: G2 Checkpoint Kinase.
ACKNOWLEDGMENTS
We thank Didier Chollet and Mylene Docquier (iGE3 Genomics Platform) for performing NanoString, and Ursula Loizides-Mangold for critical reading of the
www.impactjournals.com/oncotarget
CONFLICTS OF INTEREST
The authors declare that there is no duality of interest associated with this manuscript.
Authorsʼ contributions
AM, ZC, MP, FT, PM, CDV and MB contributed to data acquisition and analysis, CD and JP designed the study and drafted the manuscript. All authors took part in the revision of the manuscript and approved the final
version.
FUNDING
This work was funded by the Fondation pour la
Recherche sur le Cancer et la Biologie and Fonds de Recherche du Département des Spécialités de Médecine (CD).
REFERENCES
1. Siegel R, Ma J, Zou Z and Jemal A. Cancer statistics, 2014. CA Cancer J Clin. 2014; 64:9–29.
2. Elisei R, Molinaro E, Agate L, Bottici V, Masserini L, Ceccarelli C, Lippi F, Grasso L, Basolo F, Bevilacqua G, Miccoli P, Di Coscio G, Vitti P, et al. Are the clinical and pathological features of differentiated thyroid carcinoma really changed over the last 35 years? Study on 4187 patients from a single Italian institution to answer this question. The Journal of clinical endocrinology and metabolism. 2010; 95:1516–1527.
3. Haugen BR, Alexander EK, Bible KC, Doherty GM, Mandel SJ, Nikiforov YE, Pacini F, Randolph GW, Sawka AM, Schlumberger M, Schuff KG, Sherman SI, Sosa JA, et al. 2015 American Thyroid Association Management Guidelines for Adult Patients with Thyroid Nodules and Differentiated Thyroid Cancer: The American Thyroid Association Guidelines Task Force on Thyroid Nodules and Differentiated Thyroid Cancer. Thyroid. 2016; 26:1–133.
4. Schmid KW and Farid NR. How to define follicular thyroid carcinoma? Virchows Arch. 2006; 448:385–393.
5. Nikiforov YE. Molecular diagnostics of thyroid tumors. Arch Pathol Lab Med. 2011; 135:569–577.
6. Tavares C, Melo M, Cameselle-Teijeiro JM, Soares P and Sobrinho-Simoes M. ENDOCRINE TUMOURS: Genetic predictors of thyroid cancer outcome. European journal of endocrinology/European Federation of Endocrine Societies. 2016; 174:R117–126.
7. Borup R, Rossing M, Henao R, Yamamoto Y, Krogdahl A, Godballe C, Winther O, Kiss K, Christensen L, Hogdall E, Bennedbaek F and Nielsen FC. Molecular signatures of thyroid follicular neoplasia. Endocrine-related cancer. 2010; 17:691–708.
8. Chitikova Z, Pusztaszeri M, Makhlouf AM, Berczy M, Delucinge-Vivier C, Triponez F, Meyer P, Philippe J and
Dibner C. Identification of new biomarkers for human papillary thyroid carcinoma employing NanoString analysis. Oncotarget. 2015; 6:10978–10993. doi: 10.18632/ oncotarget.3452.
9. Geiss GK, Bumgarner RE, Birditt B, Dahl T, Dowidar N, Dunaway DL, Fell HP, Ferree S, George RD, Grogan T, James JJ, Maysuria M, Mitton JD, et al. Direct multiplexed measurement of gene expression with color-coded probe pairs. Nat Biotechnol. 2008; 26:317–325.
10. Romei C, Ciampi R, Faviana P, Agate L, Molinaro E, Bottici V, Basolo F, Miccoli P, Pacini F, Pinchera A and Elisei R. BRAFV600E mutation, but not RET/PTC rearrangements, is correlated with a lower expression of both thyroperoxidase and sodium iodide symporter genes in papillary thyroid cancer. Endocrine-related cancer. 2008; 15:511–520.
11. Howell GM, Hodak SP and Yip L. RAS mutations in thyroid cancer. The oncologist. 2013; 18:926–932. 12. Brutsche MH, Joos L, Carlen Brutsche IE, Bissinger R,
Tamm M, Custovic A and Woodcock A. Array-based diagnostic gene-expression score for atopy and asthma. J Allergy Clin Immunol. 2002; 109:271–273.
13. Wright G, Tan B, Rosenwald A, Hurt EH, Wiestner A and Staudt LM. A gene expression-based method to diagnose clinically distinct subgroups of diffuse large B cell lymphoma. Proc Natl Acad Sci U S A. 2003; 100:9991–9996.
14. Norton N, Sun Z, Asmann YW, Serie DJ, Necela BM, Bhagwate A, Jen J, Eckloff BW, Kalari KR, Thompson KJ, Carr JM, Kachergus JM, Geiger XJ, et al. Gene expression, single nucleotide variant and fusion transcript discovery in archival material from breast tumors. PLoS One. 2013; 8:e81925.
15. Reis PP, Waldron L, Goswami RS, Xu W, Xuan Y, Perez-Ordonez B, Gullane P, Irish J, Jurisica I and Kamel-Reid S. mRNA transcript quantification in archival samples using multiplexed, color-coded probes. BMC Biotechnol. 2011; 11:46. 16. Sochalska M, Tuzlak S, Egle A and Villunger A. Lessons from
gain- and loss-of-function models of pro-survival Bcl2 family proteins: implications for targeted therapy. FEBS J. 2015. 17. Kim MK, Min DJ, Wright G, Goldlust I and
Annunziata CM. Loss of compensatory pro-survival and anti-apoptotic modulator, IKKepsilon, sensitizes ovarian cancer cells to CHEK1 loss through an increased level of p21. Oncotarget. 2014; 5:12788–12802. doi: 10.18632/ oncotarget.2665.
18. Sykorova V, Dvorakova S, Vcelak J, Vaclavikova E, Halkova T, Kodetova D, Lastuvka P, Betka J, Vlcek P, Reboun M, Katra R and Bendlova B. Search for new genetic biomarkers in poorly differentiated and anaplastic thyroid carcinomas using next generation sequencing. Anticancer Res. 2015; 35:2029–2036.
19. Xing M, Tokumaru Y, Wu G, Westra WB, Ladenson PW and Sidransky D. Hypermethylation of the Pendred syndrome gene SLC26A4 is an early event in thyroid tumorigenesis. Cancer Res. 2003; 63:2312–2315.
the sodium iodide symporter and other emerging therapeutic targets. Lancet Diabetes Endocrinol. 2014; 2:830–842. 21. Dentice M, Luongo C, Elefante A, Ambrosio R, Salzano S,
Zannini M, Nitsch R, Di Lauro R, Rossi G, Fenzi G and Salvatore D. Pendrin is a novel in vivo downstream target gene of the TTF-1/Nkx-2.1 homeodomain transcription factor in differentiated thyroid cells. Mol Cell Biol. 2005; 25:10171–10182.
22. Fuhrer D, Eszlinger M, Karger S, Krause K, Engelhardt C, Hasenclever D, Dralle H and Paschke R. Evaluation of insulin-like growth factor II, cyclooxygenase-2, ets-1 and thyroid-specific thyroglobulin mRNA expression in benign and malignant thyroid tumours. European journal of endocrinology/European Federation of Endocrine Societies. 2005; 152:785–790.
23. Caballero Y, Lopez-Tomassetti EM, Favre J, Santana JR, Cabrera JJ and Hernandez JR. The value of thyroperoxidase as a prognostic factor for differentiated thyroid cancer—a long-term follow-up study. Thyroid Res. 2015; 8:12. 24. Cipollini M, Pastor S, Gemignani F, Castell J, Garritano S,
Bonotti A, Biarnes J, Figlioli G, Romei C, Marcos R, Cristaudo A, Elisei R, Landi S and Velazquez A. TPO genetic variants and risk of differentiated thyroid carcinoma in two European populations. Int J Cancer. 2013; 133:2843–2851. 25. Levi F, Okyar A, Dulong S, Innominato PF and
Clairambault J. Circadian timing in cancer treatments. Annu Rev Pharmacol Toxicol. 2010; 50:377–421.
26. Roche VP, Mohamad-Djafari A, Innominato PF, Karaboue A, Gorbach A and Levi FA. Thoracic surface temperature rhythms as circadian biomarkers for cancer chronotherapy. Chronobiol Int. 2014; 31:409–420.
27. Philippe J and Dibner C. Thyroid Circadian Timing: Roles in Physiology and Thyroid Malignancies. Journal of biological rhythms. 2014.
28. Saini C, Brown SA and Dibner C. Human peripheral clocks: applications for studying circadian phenotypes in physiology and pathophysiology. Front Neurol. 2015; 6:95. 29. Kowalska E, Ripperger JA, Hoegger DC, Bruegger P,
Buch T, Birchler T, Mueller A, Albrecht U, Contaldo C and Brown SA. NONO couples the circadian clock to the cell cycle. Proc Natl Acad Sci U S A. 2013; 110:1592–1599. 30. Matsuo T, Yamaguchi S, Mitsui S, Emi A, Shimoda F
and Okamura H. Control mechanism of the circadian clock for timing of cell division in vivo. Science. 2003; 302:255–259.
31. Nagoshi E, Saini C, Bauer C, Laroche T, Naef F and Schibler U. Circadian gene expression in individual fibroblasts: cell-autonomous and self-sustained oscillators pass time to daughter cells. Cell. 2004; 119:693–705. 32. Feillet C, Krusche P, Tamanini F, Janssens RC, Downey MJ,
Martin P, Teboul M, Saito S, Levi FA, Bretschneider T, van der Horst GT, Delaunay F and Rand DA. Phase locking and multiple oscillating attractors for the coupled mammalian clock and cell cycle. Proc Natl Acad Sci U S A. 2014; 111:9828–9833.
33. Fu L, Pelicano H, Liu J, Huang P and Lee C. The circadian gene Period2 plays an important role in tumor suppression and DNA damage response in vivo. Cell. 2002; 111:41–50. 34. Mannic T, Meyer P, Triponez F, Pusztaszeri M, Le
Martelot G, Mariani O, Schmitter D, Sage D, Philippe J and Dibner C. Circadian clock characteristics are altered in human thyroid malignant nodules. The Journal of clinical endocrinology and metabolism. 2013; 98:4446–4456. 35. Ulivieri A, Lavra L, Dominici R, Giacomelli L, Brunetti E,
Sciacca L, Trovato M, Barresi G, Foukakis T, Jia-Jing L, Larsson C, Bartolazzi A and Sciacchitano S. Frizzled-1 is down-regulated in follicular thyroid tumours and modulates growth and invasiveness. The Journal of pathology. 2008; 215:87–96.
36. Cipriani NA, Nagar S, Kaplan SP, White MG, Antic T, Sadow PM, Aschebrook-Kilfoy B, Angelos P, Kaplan EL and Grogan RH. Follicular Thyroid Carcinoma: How Have Histologic Diagnoses Changed in the Last Half-Century and What Are the Prognostic Implications? Thyroid. 2015; 25:1209–1216.
37. Stokowy T, Eszlinger M, Swierniak M, Fujarewicz K, Jarzab B, Paschke R and Krohn K. Analysis options for high-throughput sequencing in miRNA expression profiling. BMC Res Notes. 2014; 7:144.
38. Ishikawa S, Tateya I, Hayasaka T, Masaki N, Takizawa Y, Ohno S, Kojima T, Kitani Y, Kitamura M, Hirano S, Setou M and Ito J. Increased expression of phosphatidylcholine (16:0/18:1) and (16:0/18:2) in thyroid papillary cancer. PLoS One. 2012; 7:e48873.
39. Pagni F, L’Imperio V, Bono F, Garancini M, Roversi G, De Sio G, Galli M, Smith AJ, Chinello C and Magni F. Proteome analysis in thyroid pathology. Expert Rev Proteomics. 2015; 12:375–390.
40. Vandesompele J, De Preter K, Pattyn F, Poppe B, Van Roy N, De Paepe A and Speleman F. Accurate normalization of real-time quantitative RT-PCR data by geometric averaging of multiple internal control genes. Genome Biol. 2002; 3:RESEARCH0034.
41. Volante M, Collini P, Nikiforov YE, Sakamoto A, Kakudo K, Katoh R, Lloyd RV, LiVolsi VA, Papotti M, Sobrinho-Simoes M, Bussolati G and Rosai J. Poorly differentiated thyroid carcinoma: the Turin proposal for the use of uniform diagnostic criteria and an algorithmic diagnostic approach. Am J Surg Pathol. 2007; 31:1256–1264.
42. Tomei S, Mazzanti C, Marchetti I, Rossi L, Zavaglia K, Lessi F, Apollo A, Aretini P, Di Coscio G and Bevilacqua G. c-KIT receptor expression is strictly associated with the biological behaviour of thyroid nodules. Journal of translational medicine. 2012; 10:7.