1 2 3 4 5 6 7 8 9 10 11 12 13 14 15 16 17 18 19 20 21 22 23 24 25 26 27 28 29 30 31 32 33 34 35 36 37 38 39 40 41 42 43 44 45 46 47 48 49 50 51 52 53 54 55 56 57 58 59 60 61
Selectivity sequences in a model calcium channel:
Role of electrostatic field strength
Daniel Krauss1,2, Bob Eisenberg1, and Dirk Gillespie1,*
1
Department of Molecular Biophysics and Physiology, Rush University Medical Center, Chicago, IL
2
Grinnell College, Grinnell, IA
*
corresponding author: [email protected]
4 5 6 7 8 9 10 11 12 13 14 15 16 17 18 19 20 21 22 23 24 25 26 27 28 29 30 31 32 33 34 35 36 37 38 39 40 41 42 43 44 45 46 47 48 49 50 51 52 53 54 55 56 57 58 59 60
ABSTRACT
The energetics that give rise to selectivity sequences of ionic binding selectivity of Li+, Na+, K+, Rb+, and Cs+ in a model of a calcium channel are considered. This work generalizes Eisenman’s classical treatment (Biophys. J. 2 (Suppl. 2), 259) by including multiple, mobile binding site oxygens that coordinate many permeating ions (all modeled as charged, hard spheres). The selectivity filter of the model calcium channel allows the carboxyl terminal groups of glutamate and aspartate side chains to directly interact with and coordinate the permeating ions. Ion dehydration effects are represented with a Born energy between the dielectric coefficients of the selectivity filter and the bath. High oxygen concentration creates a high field strength site that prefers small ions, as in Eisenman’s model. On the other hand, a low filter dielectric constant also creates a high field strength site, but this site prefers large ions, contrary to Eisenman’s model. These results indicate that field strength does not have a unique effect on ionic binding selectivity sequences once entropic, electrostatic, and dehydration forces are included in the model. Thus, Eisenman’s classical relationship between field strength and selectivity sequences must be supplemented with additional information in selectivity filters like the calcium channel that have amino acid side chains mixing with ions to make a crowded permeation pathway.
INTRODUCTION
If Li+, Na+, K+, Rb+, and Cs+ are placed in equimolar amounts outside a channel and allowed to permeate only 11 of the possible 120 different possible sequences of binding selectivity have been found in actual channels. Eisenman described these selectivity sequences of ion binding in ion channels solely as a function of electrostatics and dehydration (Eisenman 1962; Eisenman and Horn 1983). His first model (Eisenman 1962) ignored many physical properties like entropy that are critical to accurately describe condensed matter systems like an electrolyte in a channel. Despite its simplicity, Eisenman’s model has proven to be remarkably accurate at predicting the 11 sequences that occur.
Here we expand on Eisenman’s idea. In an early paper he noted that ―While it is possible to extend the above calculations [for electrochemical potential] to assess the role of adjacent oxygens, silicons, and ―screening‖ cations, the lack of detailed knowledge of their positions makes it more profitable at present to simplify the above representations by a single charged monopolar site‖ (Eisenman 1962). In our paper we include these adjacent oxygens and screening charges by modeling the oxygens as half-charged, mobile spheres that can coordinate the permeating ions. We also include a dielectric constant for the binding site to describe ion dehydration. Overall, this allows us to include electrostatics, dehydration, and entropic forces in our characterization of selectivity sequences in calcium channels, the main class of channels to which our model applies. While Eisenman and Alvarez (Eisenman and Alvarez 1991) have studied the effect of nearby channel atoms in some specific channel structures, our approach allows us to systematically explore all possible outcomes (within the confines of our reduced model) in a system in which all atoms at their free energy minimum. This approach then gives a broad brushstroke picture of selectivity sequences in calcium channels.
4 5 6 7 8 9 10 11 12 13 14 15 16 17 18 19 20 21 22 23 24 25 26 27 28 29 30 31 32 33 34 35 36 37 38 39 40 41 42 43 44 45 46 47 48 49 50 51 52 53 54 55 56 57 58 59 60 61
Eisenman sequences and ―field strength‖. However, the dielectric constant of the filter results in a ―high field strength‖ site that produces a ―low field strength‖ selectivity sequence. Therefore, we conclude that selectivity in a model of a pore crowded with amino acids side chains cannot be characterized by one parameter like field strength. Since ours is a very simple model, we speculate that the same is true in a real channel, a much more complicated system.
THE EISENMAN MODEL
In this section we will give a brief review of the basic Eisenman model (Eisenman 1962), ignoring its many generalizations and extensions (see (Eisenman and Horn 1983) and references therein). Eisenman modeled the alkali ions as equivalent charged spheres with their Goldschmidt radii and the binding site as a sphere with a charge of –1. This model is based on the physics of ion selective glass electrodes. By simple electrostatic calculations, one can compute the energy of the system to show that the smaller the ion, the higher its affinity for a sphere of that diameter (Eisenman 1962; Hille 2001).
With just this information, the only selectivity sequence that could be observed would be Li+>Na+>K+>Rb+>Cs+ (Sequence XI, Table 1). The smaller ion will always be able to move closer to the binding site charge. However, if ions dehydrate before they permeate, Eisenman sequences come from the competition between binding and dehydration, and one can observe a myriad of selectivity sequences. As the size of the binding site sphere changes from small to large, the Eisenman selectivity sequences are observed (Table 1). Eisenman defined a sequence corresponding to a small sphere as a ―high field strength‖ site and those corresponding to a large sphere as ―low field strength‖. He could then apply ―field strength‖ to actual channels based on their selectivity properties.
The Eisenman sequences are then the result of two competing phenomena, the attraction of ion into the charged binding site and the dehydration penalty for entering the binding site. Generalizing the work of Krasne and Eisenman (Krasne and Eisenman 1973), Eisenman and Horn (Eisenman and Horn 1983) showed that the sequences arise as long as the attraction term falls off as function of ion size as a lower power than the dehydration term. While this approach is simple in principle, some have criticized this ―field strength‖ argument. Armstrong (Armstrong 1989), for example, demonstrated that the Eisenman procedure is very inaccurate when predicting relative ratios between ions. He also showed that the sequences observed are very sensitive to the particular diameter used. If, for instance, Pauling radii are used in the place of Goldschmidt radii, no K+ selective channels are observed. This makes it possible that the 11 Eisenman sequences do not correspond to Eisenman’s ―field strength.‖
As an alternative, Armstrong suggested that any theory that produced a single peak when affinity is plotted as a function of permeant ion radius will produce the Eisenman sequences (plus five others) (Armstrong 1989). The balance of electrostatic attraction and ion dehydration do this since each energy is monotonic in ion radius (but of opposite sign). Later we show that Armstrong’s idea does not hold in our model when the filter dielectric constant is very low.
REDUCED CALCIUM CHANNEL MODEL
4 5 6 7 8 9 10 11 12 13 14 15 16 17 18 19 20 21 22 23 24 25 26 27 28 29 30 31 32 33 34 35 36 37 38 39 40 41 42 43 44 45 46 47 48 49 50 51 52 53 54 55 56 57 58 59 60
Our reduced model of a calcium channel consists of two bulk fluids (homogeneous and infinite in all directions) consisting of ions modeled as charged hard spheres. Water is implicitly present in each compartment as dielectric constants, one for each fluid. One fluid represents the bath outside the channel and contains the permeating ions. The other fluid represents the selectivity filter and contains a given concentration of half-charged oxygen ions (O1/2–). These oxygens represent the carboxyl oxygens present in the selectivity filter of calcium channels or the carbonyl oxygens of the protein backbone of K+ channels. Koch et al. (2000) have shown that the glutamates of L-type calcium channels face the permeation pathway and therefore can directly interact with the permeating ions.
The oxygens are modeled as a fluid so that they can coordinate the permeating ions, which has been shown to give calcium channels their selectivity (Boda et al. 2000; Boda et al. 2002; Gillespie 2008; Nonner et al. 2000). Because the fluid is infinite in all directions, the model makes no distinction between having n oxygens in a filter of volume v and having αn
oxygens in a filter of volume αv. Thus, any channel geometry is represented through [O1/2–]; the selectivity filter does not have an explicit length or radius.
[O1/2–] also determines selectivity. As an example, [O1/2–] = 40 M behaves somewhat like the highly Ca2+ selective L-type Ca2+ channel while [O1/2–] = 20 M behaves more like the mildly Ca2+ selective ryanodine receptor calcium channel (Krauss and Gillespie 2010; Nonner et al. 2000). Theoretical studies support the assumption that oxygen concentration as opposed to size or shape of the filter determines the number of ions which move into the filter (Malasics et al. 2009). By changing the oxygen concentration we alter the charge density of the filter. A higher [O1/2–] therefore results in a higher field strength site.
The dielectric constant within the filter gives us a way of including water and dehydration (Nonner et al. 2001). If the dielectric constant within the filter is the same as the bath (78.4), all waters of hydration are free to move into the channel, and there are zero penalties for shedding waters of hydration. On the other hand, if the channel’s dielectric constant is lower than that of the bath, the channel can better exclude waters of hydration and thus has penalties for shedding waters of hydration. Reducing the filter’s dielectric constant also reduces the amount of water between the screening charge and therefore also increases the interactions between the ions and between the ions and the oxygens. This means that a low dielectric constant results in a high field strength site.
4 5 6 7 8 9 10 11 12 13 14 15 16 17 18 19 20 21 22 23 24 25 26 27 28 29 30 31 32 33 34 35 36 37 38 39 40 41 42 43 44 45 46 47 48 49 50 51 52 53 54 55 56 57 58 59 60 61
This system in this paper uses the mean spherical approximation (MSA) to compute the electrochemical potential of these ions (Barthel et al. 1998; Blum 1975; Blum 1980; Nonner et al. 2000; Nonner et al. 2001; Waisman and Lebowitz 1970). Given the bath concentrations, valences, and ionic radii of all the permeating ions and the concentration of oxygens in the filter we can use the MSA theory for the excess chemical potential to determine the concentration of each bath ion in the filter. Since our system is in equilibrium, the chemical potential for all ions is the same for the bath and the filter so that, for ion species X,
(1)
where is the electrochemical potential of the ion in the bath, is the Boltzmann constant,
is temperature in Kelvin, filter is concentration of the ion in the filter, is valence, is
Donnan (electrical) potential, is the term representing the ion screening the charges around
it, is the excluded volume term, is the ion’s Gibbs free energy of hydration (Table 2),
εfilter is the filter dielectric constant, and εbath is the bath dielectric constant.
The excess chemical potential contains four terms in this model. An excluded volume
portion ( ) represents the chemical potential created by volume exclusion (i.e., two hard sphere ions cannot overlap). The electrostatic portion contains two parts, a mean electrostatic
potential ( ) and a screening component ( ). The former is the long-time, many-particle average of the electrostatic potential, while the latter describes the energetic of ions rearranging to screen each other, with small ions lowering the free energy of the system because they screen better than larger ions that cannot approach as closely (Gillespie 2008). The dehydration term is represented as a Born scaling of the experimental Gibbs free energy of hydration with a dielectric constant, as was done previously by Nonner et al. (Nonner et al. 2001). For the bath, we have the concentrations of all ions within the system and we set the mean electrostatic
potential to 0. This allows us to define the chemical potential for the bath from the concentrations of the permeating ions. For the filter, however, the only concentration we know is that of the oxygens and the Donnan potential for the filter VD is also a variable. To fill this
gap, we assume charge neutrality in the filter because it is a bulk fluid. We can then numerically solve for the unknowns using Mathematica (version 7, Wolfram Research, Champaign, IL) to determine ionic concentrations in the filter and, thus, selectivity.
RESULTS
We considered selectivity of channels with filter εfilter varying between 3 and 80 and
oxygen concentration varying between 1 and 25 M with Li+, Na+, K+, Rb+, and Cs+ present in the bath at 50 mM. 250 mM Cl– was added in to the bath to balance out the charge from the cations. For each channel, we determined the selectivity sequence of the five cations by computing the concentration of each ion species in the filter. The sequences observed, listed in Table 1,
excluded mean
ideal gas electrostatic screening volume
bath 3 SC HS
X X filter X X X
dehydration
dehydr filter bath X
filter bath
ln [X]
( 1)
D
kT z V
bath X
kB
T [X] zX VD
SC X HS X dehydr X HS X D
V XSC
bath X
4 5 6 7 8 9 10 11 12 13 14 15 16 17 18 19 20 21 22 23 24 25 26 27 28 29 30 31 32 33 34 35 36 37 38 39 40 41 42 43 44 45 46 47 48 49 50 51 52 53 54 55 56 57 58 59 60
occurred in distinct regions as shown in Figure 1. Eight of the 11 Eisenman sequences were observed and ten non-Eisenman sequences were observed (lowercase Roman numerals on Figure 1). Selectivity trended towards large ions at low dielectrics and low oxygen concentrations.
At high filter dielectric constants (>~75), the oxygen concentration had no effect on selectivity. However, at lower dielectrics increasing the oxygen concentration caused a trend towards small ion selectivity (while keeping εfilter fixed). This trend generally followed the
Eisenman sequences from I to XI with a few non-Eisenman sequences in a discrete band in the middle of our data range. The higher oxygen concentration increased the weight of the hard sphere and electrostatic terms in the chemical potential (Eq. (1)). The hard sphere portion increased as oxygen concentration rose until volume exclusion became the dominant factor in determining selectivity (Fig. 2). This figure shows, as a function of oxygen concentration, the binding selectivity between K+ and Na+ which is defined by (Gillespie 2008)
(2) where the Δ indicates the difference between the filter and bath values of that component of the chemical potential of ion X. A positive term in Eq. (2) favors K+ binding in the filter while a negative one favors Na+.
The figure shows each component of the binding selectivity of Eq. (2). The dehydration term remains relatively constant and in favor of K+ since the filter dielectric constant does not change (from 50) during these calculations. As oxygen concentration increases, the hard sphere term becomes larger and eventually increases to over four times the dehydration energy. Since the entropic effect is so large, it is the main determinant of the selectivity of the system in this region of the parameter space.
Changes to the dielectric constant of the filter produce a similar trend with large dielectrics resulting in small ion selectivity (Fig. 3). Much like in the Fig. 2, this figure presents difference in chemical potential and its components of Eq. (2), this time as a function of dielectric constant in the filter. When the filter dielectric approaches that of the bath (78.4), the dehydration penalties and the electrostatic interaction both approach 0. This means that the excluded volume term becomes the largest determinant of electrochemical potential and thus selectivity in the high εfilter regime.
For small filter dielectrics, the picture gets a bit murkier. The screening component of the chemical potential and dehydration both become very large and are of opposite sign, yet the difference between the two is still relatively small. Therefore, small changes to how each term is computed have large effects on the selectivity sequence observed. In order to accurately predict sequences in this region, our model would need more detailed knowledge about the environment of the channel and more accurate theories of the ions and their dehydration. While probably inaccurate in this region, our model should produce the correct trend in selectivity for εfilter>15.
binding selectivity number advantage screening advantage
+ + SC SC filter bath K Na + + filter bath excluded-volume advantage EV EV K Na
[K ] [K ] 1
ln ln
[Na ] [Na ]
1 ( kT kT dehydration advantage
dehydr dehydr filter bath
4 5 6 7 8 9 10 11 12 13 14 15 16 17 18 19 20 21 22 23 24 25 26 27 28 29 30 31 32 33 34 35 36 37 38 39 40 41 42 43 44 45 46 47 48 49 50 51 52 53 54 55 56 57 58 59 60 61
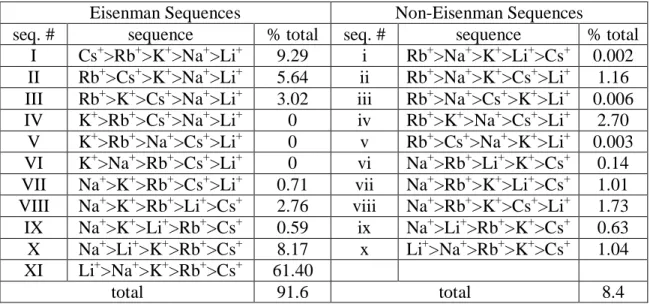
While the vast majority of the selectivity sequences produced by the model are Eisenman sequences, we also calculated a band of other sequences (the collection of lowercase Roman numerals in Fig. 1). This band represents approximately 8.7% of channels with sequences that do not match any of the 11 standard Eisenman sequences (or even the extended 13 Eisenman sequences). They are broken down in a histogram in Fig. 4. Ten non-Eisenman sequences were observed, but only five represented more than 1% of the total sequences (Table 1). These 10 sequences were generally Rb+ or Na+ selective while one was Li+ selective. Despite being non-Eisenman sequences they appeared in a distinct band of oxygen concentrations and dielectrics (Fig. 1) and generally only had one pair of ions out of order when compared to an Eisenman sequence that existed near that band.
DISCUSSION
We have shown that as we change the oxygen concentration and the dielectric constant of the filter within our model, we observe many of the 11 Eisenman sequences in order. As oxygen concentration increases, the sequences trend from I to XI (Table 1). As the dielectric constant increases the sequences trend from XI to I.
Our model provides two definitions for field strength that correspond to these parameters. A channel with a high oxygen concentration produces a ―high field strength‖ sequence because it increases the number of charges within the filter. Because of the steric effects caused by the oxygens, a high [O1/2–] channel becomes small ion selective and produces a ―high field strength‖ sequence.
A low means that water is excluded, increasing charge-charge interactions, and
thereby increasing field strength. However, we find that a high produces an Eisenman
―high field strength‖ sequence. When the dehydration penalty is negligible ( >~70), the channel is selective for small ions at virtually all oxygen concentrations. This appears to contradict Eisenman’s definition of electrostatic field strength because a ―high field strength‖ selectivity sequence should imply increased charge-charge interaction. Increased charge-charge interactions actually occur at low εfilter instead of at high εfilter in our calculations, the opposite of
what would be classically expected.
In Eisenman’s work the binding site charges were fixed in place because the binding site was a glass (Eisenman 1962). However, calcium channels have mobile binding site charges. This allows for some waters to enter. The filter dielectric constant this produces couples ―field strength‖ and the dehydration penalty. The field strength can be decreased by having more waters around the screening charges. This extra water decreases charge-charge interactions while simultaneously decreasing the magnitude of dehydration penalties. In Eisenman’s calculations, the number of waters admitted into the channel did not affect selectivity. This is because without an entropic term, the magnitude of the dehydration penalties would have to become much smaller than we calculate before they would affect selectivity.
In the Eisenman model of a glass electrode, a single particle moving to a single binding site has no entropic effect; the screening charge does not have to fit between other screening ions and compete for space. However, this model of a rigid glass electrodes may not be a good representation of a calcium channel that has amino acid side chains crowding the permeation pathway. In our model, the excluded volume term is relatively constant as a function of εfilter in
our chemical potential calculations (Fig. 3). Therefore, at high dielectric constants the relative
filter
filter
filter
4 5 6 7 8 9 10 11 12 13 14 15 16 17 18 19 20 21 22 23 24 25 26 27 28 29 30 31 32 33 34 35 36 37 38 39 40 41 42 43 44 45 46 47 48 49 50 51 52 53 54 55 56 57 58 59 60
differences between the dehydration penalties would not alter selectivity because the hard sphere term is so much larger than the dehydration penalties. Once entropic effects are included and charge-charge interaction is coupled with dehydration energy through a dielectric constant, we observe large ion selectivity in certain ―high field strength‖ sites (Fig. 3).
While ―field strength‖ may not work as a determinant of selectivity, our calculations generally support the monotonic viewpoint of Armstrong (Armstrong 1989) when εfilter>15.
Only a single peak in an affinity (ion concentrations in the filter) as a function of ionic diameter is observed for all of the channels with Eisenman sequences, which were 91% of the observed sequences. However, among the non-Eisenman sequences we computed, only one of the ten, namely Rb+>K+>Na+>Cs+>Li+ (iv), followed Armstrong’s argument. The other nine non-Eisenman sequences depart from Armstrong’s argument and occurred mostly at very low (εfilter<~15) filter dielectric constants (Fig. 1). In fact, at extremely low filter dielectric constant
(εfilter<~8) we found multiple peaks when affinity is plotted versus ionic radius (data not shown).
However, below εfilter = 15 our model is probably quite inaccurate because of the very large
attractive Coulombic forces and the very large repulsive dehydration penalties (Fig. 3). The balance of these two large forces will always be hard to calculate, and our simple model is no exception.
This parameter space region of low filter dielectric constant is also interesting because these parameters characterize potassium channels. Potassium channels can generally be described as excluding almost all waters and as having a large dipole and oxygen density (Doyle et al. 1998). This describes exactly the lower region of Fig. 1 in which most of these sequences occur. Our data shows K+ versus Na+ selectivity only in essentially gaseous environments (very low oxygen concentration and εfilter), which is consistent with gas-phase experiments of ion
binding with water molecules (Dzidic and Kebarle 1970). This seems to contradict the idea that potassium channels have large oxygen concentrations and low dielectric constants. However, theoretical studies on potassium channels show that the key difference between our high oxygen/low dielectric channels and a potassium channel is the lack of constraint on oxygen movement in our model; in the potassium channel the oxygens cannot move to fully coordinate the permeating ions. A potassium channel’s filter charges are not present in the permeation pathway as in our model and they do not move very freely as we allow our oxygens to do (Fowler et al. 2008). This constraint on the oxygens’ ability to fully coordinate the permeating ions produces K+ selectivity over Na+. This data supports the argument that constraints on the oxygens’ freedom of movement produces K+
selectivity (Bostick and Brooks III 2007; Thomas et al. 2007; Varma and Rempe 2007; Varma et al. 2008).
CONCLUSION
4 5 6 7 8 9 10 11 12 13 14 15 16 17 18 19 20 21 22 23 24 25 26 27 28 29 30 31 32 33 34 35 36 37 38 39 40 41 42 43 44 45 46 47 48 49 50 51 52 53 54 55 56 57 58 59 60 61
ACKNOWLEDGMENTS
4 5 6 7 8 9 10 11 12 13 14 15 16 17 18 19 20 21 22 23 24 25 26 27 28 29 30 31 32 33 34 35 36 37 38 39 40 41 42 43 44 45 46 47 48 49 50 51 52 53 54 55 56 57 58 59 60
TABLES
Table 1: List of all selectivity sequences observed in Fig. 1 with its percentage of the total.
Eisenman Sequences Non-Eisenman Sequences
seq. # sequence % total seq. # sequence % total
I Cs+>Rb+>K+>Na+>Li+ 9.29 i Rb+>Na+>K+>Li+>Cs+ 0.002 II Rb+>Cs+>K+>Na+>Li+ 5.64 ii Rb+>Na+>K+>Cs+>Li+ 1.16 III Rb+>K+>Cs+>Na+>Li+ 3.02 iii Rb+>Na+>Cs+>K+>Li+ 0.006 IV K+>Rb+>Cs+>Na+>Li+ 0 iv Rb+>K+>Na+>Cs+>Li+ 2.70
V K+>Rb+>Na+>Cs+>Li+ 0 v Rb+>Cs+>Na+>K+>Li+ 0.003 VI K+>Na+>Rb+>Cs+>Li+ 0 vi Na+>Rb+>Li+>K+>Cs+ 0.14 VII Na+>K+>Rb+>Cs+>Li+ 0.71 vii Na+>Rb+>K+>Li+>Cs+ 1.01 VIII Na+>K+>Rb+>Li+>Cs+ 2.76 viii Na+>Rb+>K+>Cs+>Li+ 1.73 IX Na+>K+>Li+>Rb+>Cs+ 0.59 ix Na+>Li+>Rb+>K+>Cs+ 0.63 X Na+>Li+>K+>Rb+>Cs+ 8.17 x Li+>Na+>Rb+>K+>Cs+ 1.04 XI Li+>Na+>K+>Rb+>Cs+ 61.40
total 91.6 total 8.4
Table 2: Properties of all ions present in the system. Ion diameters are crystal diameters from Shannon and Prewitt (Shannon and Prewitt 1969) and the experimental Gibbs free energy of hydration are from Fawcett (Fawcett 1999).
ion diameter (Å) (kJ/mol)
Li+ 1.33 –529.4
Na+ 2.00 –423.7
K+ 2.76 –351.9
Rb+ 2.98 –329.3
Cs+ 3.40 –306.1
Cl– 3.62 –304.0
O1/2– 2.80 —
dehydr
4 5 6 7 8 9 10 11 12 13 14 15 16 17 18 19 20 21 22 23 24 25 26 27 28 29 30 31 32 33 34 35 36 37 38 39 40 41 42 43 44 45 46 47 48 49 50 51 52 53 54 55 56 57 58 59 60 61
REFERENCES
Armstrong CM (1989) Reflections on selectivity. In: Tosteson DC (ed) Membrane Transport: People and Ideas. American Physiological Society, Bethesda, MD, pp 261-273
Barthel JMG, Krienke H, Kunz W (1998) Physical Chemistry of Electrolyte Solutions: Modern Aspects. Springer, New York
Blum L (1975) Mean spherical model for asymmetric electrolytes I: Method of solution. Mol Phys 30:1529-1535
Blum L (1980) Solution of the Ornstein-Zernike equation for a mixture of hard ions and Yukawa closure. J Stat Phys 22:661-672
Boda D, Busath DD, Henderson D, Sokołowski S (2000) Monte Carlo simulations of the mechanism of channel selectivity: The competition between volume exclusion and charge neutrality. J Phys Chem B 104:8903-8910
Boda D, Henderson D, Busath DD (2001) Monte Carlo study of the effect of ion and channel size on the selectivity of a model calcium channel. J Phys Chem B 105:11574-11577
Boda D, Henderson D, Busath DD (2002) Monte Carlo study of the selectivity of calcium channels: Improved geometry. Mol Phys 100:2361-2368
Boda D, Nonner W, Henderson D, Eisenberg B, Gillespie D (2008) Volume exclusion in calcium selective channels. Biophys J 94:3486-3496
Boda D, Valiskó M, Eisenberg B, Nonner W, Henderson D, Gillespie D (2006) The effect of protein dielectric coefficient on the ionic selectivity of a calcium channel. J Chem Phys 125:034901
Boda D, Valiskó M, Eisenberg B, Nonner W, Henderson D, Gillespie D (2007) Combined effect of pore radius and protein dielectric coefficient on the selectivity of a calcium channel. Phys Rev Lett 98:168102
Boda D, Valiskó M, Henderson D, Eisenberg B, Gillespie D, Nonner W (2009) Ionic selectivity in L-type calcium channels by electrostatics and hard-core repulsion. J Gen Physiol 133:497-509
Bostick D, Brooks III CL (2007) Selectivity in K+ channels is due to topological control of the permeant ion’s coordinated state. Proc. Natl. Acad. Sci. U S A 104:9260-9265
Doyle DA, Morais Cabral J, Pfuetzner RA, Kuo A, Gulbis JM, Cohen SL, Chait BT, MacKinnon R (1998) The structure of the potassium channel: molecular basis of K+ conduction and selectivity. Science 280:69-77
4 5 6 7 8 9 10 11 12 13 14 15 16 17 18 19 20 21 22 23 24 25 26 27 28 29 30 31 32 33 34 35 36 37 38 39 40 41 42 43 44 45 46 47 48 49 50 51 52 53 54 55 56 57 58 59 60
Eisenman G (1962) Cation selective glass electrodes and their mode of operation. Biophys J 2 (Suppl. 2):259-323
Eisenman G, Alvarez O (1991) Structure and function of channels and channelogs as studied by computational chemistry. J Membr Biol 119:109-132
Eisenman G, Horn R (1983) Ionic selectivity revisited: The role of kinetic and equlibrium processes in ion permeation through channels. J Membr Biol 76:197-225
Fawcett WR (1999) Thermodynamic Parameters for the Solvation of Monatomic Ions in Water. J Phys Chem B 103:11181-11185
Fowler PW, Tai K, Sansom MSP (2008) The slectivity of K+ ion channels: Testing the hypotheses. Biophys J 95:5062-5072
Gillespie D (2008) Energetics of divalent selectivity in a calcium channel: The ryanodine receptor case study. Biophys J 94:1169-1184
Gillespie D, Boda D (2008) The anomalous mole fraction effect in calcium channels: A measure of preferential selectivity. Biophys J 95:2658-2672
Gillespie D, Boda D, He Y, Apel P, Siwy ZS (2008) Synthetic nanopores as a test case for ion channel theories: The anomalous mole fraction effect without single filing. Biophys J 95:609-619
Gillespie D, Fill M (2008) Intracellular calcium release channels mediate their own countercurrent: The ryanodine receptor case study. Biophys J 95:3706-3714
Gillespie D, Giri J, Fill M (2009) Reinterpreting the anomalous mole fraction effect: The ryanodine receptor case study. Biophys J 97:2212-2221
Gillespie D, Xu L, Wang Y, Meissner G (2005) (De)constructing the ryanodine receptor: Modeling ion permeation and selectivity of the calcium release channel. J Phys Chem B 109:15598-15610
Hille B (2001) Ion Channels of Excitable Membranes, 3rd edn. Sinauer Associates Inc., Sunderland
Koch SE, Bodi I, Schwartz A, Varadi G (2000) Architecture of Ca2+ channel pore-lining segments revealed by covalent modification of substituted cysteines. J Biol Chem 275:34493-34500
Krasne S, Eisenman G (1973) The molecular basis of ion selectivity. In: Eisenman G (ed) Membranes: A Series of Advances: Lipid Bilayers and Antibiotics, vol 2. Marcel Dekker, New York
4 5 6 7 8 9 10 11 12 13 14 15 16 17 18 19 20 21 22 23 24 25 26 27 28 29 30 31 32 33 34 35 36 37 38 39 40 41 42 43 44 45 46 47 48 49 50 51 52 53 54 55 56 57 58 59 60 61
Malasics A, Gillespie D, Nonner W, Henderson D, Eisenberg B, Boda D (2009) Protein structure and ionic selectivity in calcium channels: Selectivity filter size, not shape, matters. Biochim Biophys Acta Biomembr 1788:2471-2480
Miedema H, Meter-Arkema A, Wierenga J, Tang J, Eisenberg B, Nonner W, Hektor H, Gillespie D, Meijberg W (2004) Permeation properties of an engineered bacterial OmpF porin containing the EEEE-Locus of Ca2+ channels. Biophys J 87:3137-3147
Miedema H, Vrouenraets M, Wierenga J, Gillespie D, Eisenberg B, Meijberg W, Nonner W (2006) Ca2+ selectivity of a chemically modified OmpF with reduced pore volume. Biophys J 91:4392-4400
Nonner W, Catacuzzeno L, Eisenberg B (2000) Binding and selectivity in L-type calcium channels: A mean spherical approximation. Biophys J 79:1976-1992
Nonner W, Eisenberg B (1998) Ion permeation and glutamate residues linked by Poisson-Nernst-Planck theory in L-type calcium channels. Biophys J 75:1287-1305
Nonner W, Gillespie D, Henderson D, Eisenberg B (2001) Ion accumulation in a biological calcium channel: effects of solvent and confining pressure. J Phys Chem B 105:6427-6436
Rodriguez-Contreras A, Nonner W, Yamoah EN (2002) Ca2+ transport properties and determinants of anomalous mole fraction effects of single voltage-gated Ca2+ channels in hair cells from bullfrog saccule. J Physiol 538:729-745
Shannon RD, Prewitt CT (1969) Effective ionic radii in oxides and fluorides. Acta Crystallogr B25:925-946
Thomas M, Jayatilaka D, Corry B (2007) The predominant role of coordination number in potassium channel selectivity. Biophys J 93:2635-2643
Varma S, Rempe S (2007) Tuning ion coordination architectures to enable selective partitioning. Biophys J 93:1093-1099
Varma S, Sabo D, Rempe SB (2008) K+/Na+ selectivity in K channels and Valinomycin: Over-coordination versus cavity-size constraints. J Mol Biol 376:13-22
4 5 6 7 8 9 10 11 12 13 14 15 16 17 18 19 20 21 22 23 24 25 26 27 28 29 30 31 32 33 34 35 36 37 38 39 40 41 42 43 44 45 46 47 48 49 50 51 52 53 54 55 56 57 58 59 60
FIGURE LEGENDS
1. Monovalent cation selectivity sequences for all channels with [O1/2–] = 1 M to 25 M and
εfilter = 3 to 80. The five cations were each present at 50 mM in the bath along with 250 mM
Cl–. Roman numerals correspond to the selectivity sequences listed in Table 1. Capital numerals denote Eisenman sequences and lowercase non-Eisenman sequences.
2. Differences in the components of the electrochemical potential (Eq. (2)) between K+ and Na+ as a function of [O1/2–]. The thin solid line corresponds to the screening advantage, the dotted line to the hard sphere advantage, the dashed line to the dehydration advantage, and the thick, solid line to the total of the other four lines, the overall binding selectivity. Positive values indicate the term favors K+ over Na+ accumulating in the filter while negative values indicate the opposite selectivity. The mean electrostatic and ideal gas components are the same for both ions and are not included. In this figure, εfilter = 50.
3. Differences in the components of the electrochemical potential (Eq. (2)) between K+ and Na+ as a function of εfilter. The thin solid line corresponds to the screening advantage, the dotted
line to the hard sphere advantage, the dashed line to the dehydration advantage, and the thick, solid line to the total of the other four lines, the overall binding selectivity. Positive values favor K+ accumulating in the filter. The mean electrostatic and ideal gas components are the same for both ions and is not included. In this figure, [O1/2–] = 15 M.
[O 1/2-] (M)
IX VII
vi
ix
f
ilt
e
r
d
ie
le
ct
ri
c
co
n
st
a
n
t
(
εfilt
e
r
)
i
I II III
X
XI
VI II
ii
iv viii
vii
5 10 15 20 25
5 10 15 20 25
- 1.2 - 1.0 - 0.8 - 0.6 - 0.4 - 0.2 0.2
binding selectivity screening advantage
excluded volume advantage dehydration advantage
[O1/2-] (M)
kT
kT
20 40 60 80
-4 -2 2 4
binding selectivity
screening advantage dehydration advantage
0
ԑfilter
fra
ct
io
n
o
f
to
ta
l
I II III IV V VI VII VIIIIX X XI i ii iii iv v vi viiviiiix x