Report on self reported experience of patients from
black and minority ethnic groups
Executive summary
This report examines variations in the self-reported views of NHS patients from different ethnic groups. These results give us insight into the areas of NHS service provision where experience of the service looks different to patients from different ethnic groups. Results are based on data from the National Patient Survey
programme, led by the Healthcare Commission.
Some ethnic groups are very small, relative to the overall size of the population, and the small number of responses from these groups means that the data contain a limited amount of information about ethnic variations. The Department of Health and The Healthcare Commission have worked together to find a way to analyse the data in other ways to allow comparisons to be made.
Attention focuses on how likely patients are to give ‘positive’ answers to each patient survey question. A number called the ‘odds ratio’ is used to show whether a
particular ethnic category is more likely or less likely to give a positive answer when compared with White British respondents. If the odds ratio (and its margin of error) are above 1, then that group has reported better experience, whilst if the odds ratio (and its margin of error) are below 1, the reported experience of that group is worse.
The results may be influenced by differences in perception as well as physical
differences in experience (for example where patients see the same ward, but have a different perception of its cleanliness). Results are best used to interpret broad
patterns, rather than focussing on individual categories or questions.
The broad findings are:
• Results show a range of variations between black and minority ethnic (BME)
groups and their white British counterparts. Where differences do exist, most are negative, indicating that BME groups are less likely to report a positive
experience. But many areas show no difference and a few show a positive difference.
• Patients from the Asian and Chinese/Other groups were less likely to give
positive responses.
• Results for Black patients were more mixed, although slightly less likely to give
positive responses compared with the White British group.
• Patients from the White Irish group were more likely to give positive responses
compared with the White British baseline, across many questions.
• BME groups tended to be less positive about questions relating to ‘access and
waiting’ or to ‘better information and more choice’.
• The largest number of differences were seen in the primary care and outpatient
surveys. There were relatively few differences for results in the community mental health survey. This is consistent with previous HCC variations reports.
Report on self reported experience of patients from black and minority ethnic groups
Introduction
This report examines variations in the self-reported views of NHS patients from different ethnic groups. These results give us insight into the areas of NHS service provision where experience of the service looks different to patients from different ethnic groups. The variations in experience reported here could reflect real inter-group differences in the quality of services received, or inter-inter-group differences in subjective factors such as expectations or perceptions, or some combination of these factors.
Exploring these differences is important, and is part of an established programme of work by the Department of Health and the Healthcare Commission to report on the experiences of patients. This work is underpinned by a national programme of surveys that examine the experience of patients in the NHS in England. The survey programme systematically collects structured and systematic feedback on the quality of service delivery from the patient and service users. This provides objective measures of NHS performance – at organisation level and both regionally and nationally.
Results in this report are based on the National Patient Survey Programme. This is the most substantial source of survey data across a range of different healthcare settings and a range of different aspects of patient experience. There are other data sources, including the GP patient survey which has a very large sample size but focuses on patient experience of primary care, and primarily around issues relating to access. Results from the GP patient survey are not considered here, but it has been used by the Department to support the review by Professor Mayur Lakhani of why patients from black and ethnic minority (BME) groups find it more difficult to access
GP services than white populations.1
Targets in this area
This report is designed to address a specific commitment in “National Standards,
Local Action”2 to report on the experience of patients from BME groups. This
commitment needs to be seen in the broader context of overall targets to improve patient experience. In 2002 the Department of Health agreed a target for the measurement of trends in patient experience as part of its Public Services Agreement (PSA) with HM Treasury to:
Enhance accountability to patients and the public and secure sustained national improvements in patient experience as measured by independently
validated national surveys3.
This was rolled forward in a slightly amended form in 2004:
Secure sustained annual national improvements in NHS patient experience by 2008, as measured by independently validated surveys, ensuring that
1
The report of this review is due to be published in May 2008. 2
Further details are available at:
http://www.dh.gov.uk/en/Publicationsandstatistics/Publications/PublicationsPolicyAndGuidance/Browsable/DH_4096173 3
Further details for SR2002 are available via the Department of Health website:
individuals are fully involved in decisions about their healthcare, including choice of provider4.
It was rolled forward again in the same form, as one of the indicators in the 2008-11 PSA delivery agreement 19: “ensure better care for all”. The commitment in “National
Standards, Local Action”5 in effect forms an additional part of this indicator.
These results also relate to responsibilities under equality and human rights legislation to monitor variations in service provision for different groups. They also address the Healthcare Commission’s commitment under the race equality scheme to monitor the experiences of minority ethnic groups.
The national patient survey programme – scoring patient experience
The national patient survey programme is a well-established feature of healthcare regulation in England. The Healthcare Commission publishes all the data at individual trust level and uses it in its annual assessment of NHS trusts – the Annual Health Check. Each survey consists of responses from individual respondents (around 27,000 useable responses for the smallest survey and up to 117,000 for the largest). Each respondent answers around 50 questions about their experience per survey.
To report on overall targets for improvements in patient experience, a subset of questions has been identified in advance to represent findings against each of five key domains of patient experience. Responses to these questions are converted into scores out of 100 using a scoring schema, and results are then standardised by age and gender (and in the case of adult inpatient data, by admission method too). Scores are then aggregated to form five domain scores:
• Access & waiting
• Safe, high quality, co-ordinated care
• Better information, more choice
• Building closer relationships
• Clean, comfortable, friendly place to be6
Overall national scores for these five domains are routinely published on the
Department of Health website7. This methodology was agreed between the
Department of Health and the Healthcare Commission.
Methods
In theory we could use this method to calculate scores for individual ethnic categories, to allow a direct comparison. However, some ethnic categories form a relatively small proportion of the population. Even in these large surveys, the number of respondents from most minority ethnic groups is small. Whilst it is possible to calculate notional scores using the above methods, the confidence intervals are very large and it is not possible to say reliably whether the scores differ by ethnic group.
4
Further details for SR2004 are available via the Department of Health website:
http://www.dh.gov.uk/en/AboutUs/HowDHWorks/ServiceStandardsAndCommitments/DHPublicServiceAgreement/DH_4106188
5
Further details are available at:
http://www.dh.gov.uk/en/Publicationsandstatistics/Publications/PublicationsPolicyAndGuidance/Browsable/DH_4096173 6
This domain is not included in the Mental Health service survey. 7
The publication can be found at:
The Healthcare Commission and Department of Health have worked together to develop an alternative methodology that allows results for different ethnic groups to be presented. This methodology builds on previous work in a series of ‘variations
reports’ published by the Healthcare Commission8. One aim is to establish a
standard methodology for reporting on the data that can be applied in a consistent way across healthcare settings and across time. Annex B describes the process used to narrow down the range of possible analytical techniques and to define the approach used in this report.
In brief, the small number of responses for some ethnic groups limits the amount of information in the data. The methodology makes maximum use of the available information by:
a) considering responses to individual questions rather than overall domains (since this means that we can ignore missing values in calculating average scores).
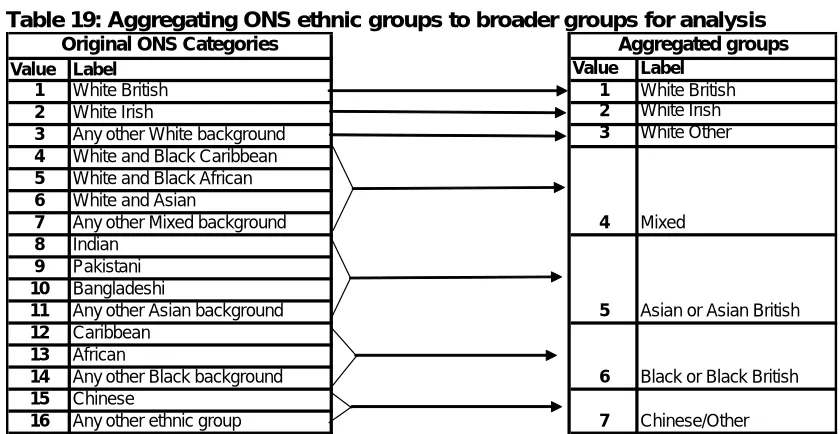
b) grouping some BME groups, where appropriate, to increase the base size of the group
c) grouping responses to the multiple-choice questions to create binary responses (positive/ negative)
d) focusing on differences from a baseline group rather than absolute scores (we use White: British as the baseline group because it is by far the largest group)
We use a technique called logistic regression to build a model to measure the extent to which positive or negative results are explained by the ethnic group of the respondent, in models which also take into account factors such as age and gender. The result is a number called an ‘odds ratio’ which serves as a score giving an indication of whether the responses of people within each aggregate ethnic group are more or less likely to be positive than those for White British respondents. Scores are calculated for each ‘PSA question’ in the most recent surveys conducted in five different clinical settings:
• survey of adults who use inpatients departments (2006/07)
• survey of people who use community mental health services (2006/07)
• survey of people who use outpatients departments (2004/05)
• survey of people who use emergency departments (2004/05)
• survey of people who use local health services (Primary Care Trusts)
(2004/05)
Some of these data are quite old, as they relate to 2004/05, but we wanted to establish a standard methodology for all the service settings covered by the National Patient Survey Programme. These results provide the most up to date assessment currently available, and provide a useful baseline position against which comparisons can be made when new data become available.
The results presented in this report are at national level and provide useful insights into the way that patient-reported views can vary across ethnic groups. The NHS
8
Three such reports are available at:
Operating Framework for 2008-09 includes an indicator for patient experience in the ‘Vital Signs’. These national data provide useful context for local health organisations considering how best to address their plans in this area.
Interpretation of the tables – and some caveats
As noted above, the results of this analysis are a set of numbers called ‘odds ratios’.
To understand what an odds ratio is, we must first explain the term ‘odds’. The odds are not shown in this report, but they are represented by a number indicating how likely it is that an individual reports a positive experience in response to a particular survey question. The analysis has been configured so that larger numbers are always more positive, so we are considering the ‘odds in favour’ of a positive outcome. (This is slightly different to the betting industry. The odds there are reported as the ‘odds against’ a particular outcome. In mathematical terms, odds against and odds in favour are reciprocals of each other).
Odds-in-favour of 1 would indicate that a positive experience is about as likely as a negative one (in the betting industry this would be referred to as ‘evens’ and would be written as 1:1). Numbers bigger than 1 (for example 2) indicate that positive outcomes are more likely (in the betting industry we would say that a positive outcome is ‘odds on’ and might write this as 1:2, for example). Numbers smaller than 1 (for example 0.5) indicate that positive outcomes are less likely. The odds are against (and in the betting industry this would be written as 2:1, for example).
Notionally, then, the White British group has a number associated with it, called the odds, indicating how likely that group is to have a positive experience. Other ethnic groups also have odds associated with them. The ‘odds ratio’ simply divides one set of odds by another. If the Asian group has an odds ratio of 2, relative to the White British group, it suggests that the ‘odds’ in favour of a positive experience are about twice as large for the Asian group as they are for the White British group.
The odds ratio for the White British group is always 1 because this group is used as a baseline against which other groups are compared – we are dividing the White British odds number by itself. If a BME group has an odds ratio greater than one, then we have some evidence that respondents in that group are more likely to give positive answers to that survey question. An odds ratio of less than one means that members
of the particular group are less likely to give a positive answer.
If the odds ratio is quite close to 1, the difference could be because of random variation (reflecting a small number of respondents answering questions in a
particular way because of their own circumstances, rather than reflecting the reports of the group as a whole). To judge whether the experience of the whole ethnic group is different to the White British group, we need to look at the confidence interval around the odds ratio. The confidence interval is a range within which we expect the ‘true’ value of the odds ratio to lie. For us to be confident that a result is a ‘real’ difference and not merely caused by random variation the range of the confidence
interval must not cross 1. For us to report that responses from an ethnic group are
more positive than the baseline group, the whole confidence interval must be above 1. For results to be less positive, the whole confidence interval must be below 1. This is explained in more detail in annex A.
- It is important to look at the overall pattern of results rather than individual odds ratios.
- None of the results presented in this report allow assessment of changes over
time.
- A patient’s response can be influenced by a number of factors; including their
own expectations and perceptions.
- Some ethnic categories have been grouped and it is not possible, for
example, to comment on the experiences of the Bangladeshi group.
- Results reflect an average profile for each group and the experience of
individuals within that group may be different.
- It is possible that the results are affected slightly by differential response rates
for different ethnic groups, but we do not expect this to have a large impact on the overall pattern of results.
Results
The following section provides a descriptive summary of the results in each of the five care settings. The summary is accompanied by small tables showing the results for particular aspects of care. These tables are extracts from the full set of results in Annex C. They have been simplified here, and also colour coded to make
interpretation easier:
Key
i) Cells with a beige-pink colour like this indicate that positive responses are significantly less likely than for the White British baseline
ii) Cells with a green colour like this indicate that responses are significantly more likely to be positive than for the White British baseline
iii) Cells with no shading indicate no statistically significant difference from the White British baseline in the likelihood of responding positively
Inpatients 06/07
The inpatient survey, which collected information on the experiences of people who had been recently discharged from hospital following a stay of at least one night, showed disparate patterns of variation between different ethnic groups. Whilst in some areas patients from BME groups tended to give more negative responses, there were also other examples where they were consistently more positive about their experiences in hospital.
In general, patients from BME groups gave less positive accounts of their
experiences within the access and waiting domain than patients from the White
Table 1: Results for access and waiting
White: Irish White: Other Mixed
Asian/Asian British Black/black British Chinese/ other Access and Waiting
1.05 0.76 0.80 0.83 0.77 0.74 (0.84,1.32) (0.63,0.92) (0.56,1.16) (0.71,0.98) (0.62,0.96) (0.47,1.16) 1.15 0.68 0.61 0.69 0.88 0.54 (0.93,1.43) (0.57,0.82) (0.43,0.85) (0.59,0.8) (0.71,1.09) (0.36,0.82) 1.06 0.91 0.66 0.77 0.85 0.47 (0.92,1.23) (0.8,1.03) (0.53,0.82) (0.7,0.85) (0.74,0.98) (0.35,0.63) From the time you arrived at the hospital, did you feel that you had to
wait a long time to get to a bed on a ward? Was your admission date changed by the hospital?
How do you feel about the length of time you were on the waiting list before your admission to hospital?
Similarly, overall, patients from some BME groups were less likely to give positive
responses about building relationships with staff than patients from the White
British group. There were few significant differences for the two questions about relationships with doctors, though, and there were no differences at all for the White Irish group. However, most BME groups were more likely to report that nurses talked in front of them as if they weren’t there. This can be seen in Table 2.
Table 2: Results for building relationships with staff
White: Irish White: Other Mixed
Asian/Asian British Black/black British Chinese/ other Building relationships
1.13 0.90 0.79 0.91 0.95 0.70 (0.98,1.31) (0.8,1.02) (0.63,0.97) (0.82,1.01) (0.83,1.09) (0.52,0.93) 1.04 0.95 0.86 0.76 1.04 0.81 (0.9,1.2) (0.84,1.08) (0.69,1.08) (0.69,0.84) (0.9,1.2) (0.6,1.09) 0.99 0.91 0.83 0.89 0.84 0.57 (0.86,1.14) (0.81,1.03) (0.67,1.03) (0.81,0.98) (0.73,0.96) (0.43,0.75) 1.01 0.80 0.60 0.64 0.82 0.76 (0.87,1.18) (0.7,0.91) (0.49,0.75) (0.58,0.71) (0.71,0.95) (0.56,1.04) Did doctors talk in front of you as if you weren't there?
When you had important questions to ask a nurse, did you get answers that you could understand?
When you had important questions to ask the doctor, did you get answers that you could understand?
Did nurses talk in front of you as if you weren't there?
For questions in the safe, high quality, coordinated care and better information,
more choice domains, however, patients from BME groups generally gave similar or
[image:8.595.89.506.85.151.2]more positive reports of their experiences than patients from the White British group. An exception to this pattern was that patients from some BME groups suggest they would have liked more involvement in decisions about their care and treatment. This can be seen in Table 3.
Table 3: Results for safe, high quality, coordinated care & better information, more choice
White: Irish White: Other Mixed
Asian/Asian British Black/black British Chinese/ other Safe, high quality, coordinated care
0.99 1.02 1.10 0.89 1.24 1.08 (0.86,1.13) (0.91,1.15) (0.89,1.35) (0.81,0.98) (1.09,1.42) (0.81,1.42) 1.39 1.03 1.19 1.09 1.04 1.07 (1.22,1.59) (0.92,1.15) (0.97,1.46) (0.99,1.2) (0.91,1.18) (0.81,1.42) 1.41 1.04 1.10 1.12 1.18 0.97 (1.21,1.63) (0.91,1.18) (0.87,1.4) (1.003,1.25) (1.02,1.36) (0.7,1.32) Better information, more choice
1.19 0.78 0.90 0.92 0.79 0.60 (1.04,1.35) (0.69,0.87) (0.73,1.11) (0.84,1.01) (0.69,0.9) (0.46,0.8) 1.16 0.94 1.07 0.94 1.28 0.85 (0.98,1.37) (0.82,1.09) (0.83,1.38) (0.84,1.06) (1.08,1.51) (0.61,1.19) 1.31 1.07 1.33 1.27 1.14 1.13 (1.12,1.53) (0.93,1.24) (1.04,1.69) (1.14,1.42) (0.97,1.32) (0.82,1.57) Sometimes, a member of staff will say one thing and another will say
something quite different. Did this happen to you?
Were you involved as much as you wanted to be in decisions made about your care and treatment?
Did a member of staff explain the purpose of the medications you were to take at home in a way you could understand?
On the day you left hospital, was your discharge delayed for any reason? Did a member of staff tell you about any danger signals you should watch for after you went home?
Did a member of staff tell you about medication side effects to watch for when you went home?
Relatively few ethnic differences were apparent for questions in the clean,
comfortable, friendly place to be domain. Where differences were apparent,
Table 4: Results for clean, comfortable, friendly place to be
White: Irish White: Other Mixed
Asian/Asian British Black/black British Chinese/ other Clean, comfortable, friendly place to be
1.27 1.03 1.44 1.11 1.74 1.14 (1.12,1.46) (0.92,1.16) (1.17,1.78) (1.01,1.22) (1.51,1.99) (0.86,1.51) 1.31 1.13 1.48 1.14 1.93 1.44 (1.1,1.55) (0.98,1.3) (1.15,1.91) (1.01,1.28) (1.62,2.31) (1.01,2.04) 1.22 0.93 0.89 0.96 1.11 0.56 (1.08,1.39) (0.83,1.05) (0.72,1.1) (0.88,1.06) (0.98,1.26) (0.42,0.75) 0.99 0.90 1.01 0.99 1.15 0.80 (0.87,1.13) (0.8,1.01) (0.82,1.26) (0.9,1.09) (1.01,1.32) (0.6,1.07) 1.20 0.95 1.06 0.93 1.45 0.86 (0.98,1.48) (0.82,1.11) (0.81,1.37) (0.82,1.06) (1.2,1.74) (0.61,1.22) 1.19 0.96 0.92 1.03 1.09 0.78 (1.01,1.39) (0.84,1.09) (0.74,1.15) (0.92,1.15) (0.94,1.26) (0.58,1.04) 1.05 0.99 0.98 0.93 1.14 0.74 (0.88,1.25) (0.86,1.14) (0.77,1.24) (0.82,1.05) (0.98,1.34) (0.53,1.04) Were you ever bothered by noise at night from hospital staff?
In your opinion, how clean was the hospital room or ward that you were in?
Were you ever bothered by noise at night from other patients?
Overall, did you feel you were treated with respect and dignity while you were in the hospital?
Do you think the hospital staff did everything they could to help control your pain?
How would you rate the hospital food?
Were you given enough privacy when being examined or treated?
Overall, patterns of variation within ethnic groups on the inpatients survey were mixed, with most BME groups being more positive than the White British baseline on some areas, less positive on some others, and showing no differences elsewhere. Exceptions were the White Irish respondents, who showed no negative differences relative to the White British group, and respondents from the White Other group, who showed no positive differences.
Outpatients 2004/05
The 2004/05 outpatients survey looked at the experiences of people who had had a recent outpatient appointment at an acute hospital. Here, whilst results from White Irish patients were again generally similar to or more positive than those from the White British baseline group, results from the White Other, Mixed, Asian, Black, and Chinese/Other groups across all domains were generally less positive across most aspects of care.
In the access and waiting domain results were generally more negative across all
groups than the White British baseline, particularly on the question about how long after the stated time did the appointment start (on which all but White Irish were more negative than the baseline). The White Other group and the Asian group recorded less positive responses on length of time waiting for an appointment.
Across the safe, high quality, coordinated care domain, results for all ethnic
groups tended to be less positive than those for the White British baseline.
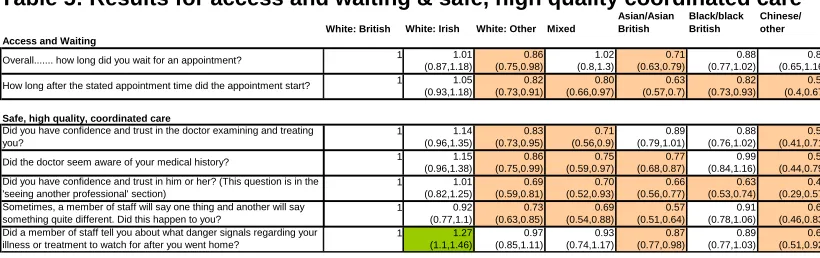
[image:9.595.90.500.617.746.2]Responses from Black patients were similar to the baseline except on confidence in the doctor, where responses were more negative. For the question about being told about danger signals to look out for, White Irish respondents recorded more positive experiences whilst Chinese/other and Asian/Asian British respondents recorded less positive ones. For other groups there was no difference on this question. This can be seen in Table 5.
Table 5: Results for access and waiting & safe, high quality coordinated care
White: British White: Irish White: Other Mixed
Asian/Asian British Black/black British Chinese/ other Access and Waiting
1 1.01 0.86 1.02 0.71 0.88 0.87
(0.87,1.18) (0.75,0.98) (0.8,1.3) (0.63,0.79) (0.77,1.02) (0.65,1.16)
1 1.05 0.82 0.80 0.63 0.82 0.52
(0.93,1.18) (0.73,0.91) (0.66,0.97) (0.57,0.7) (0.73,0.93) (0.4,0.67)
Safe, high quality, coordinated care
1 1.14 0.83 0.71 0.89 0.88 0.54
(0.96,1.35) (0.73,0.95) (0.56,0.9) (0.79,1.01) (0.76,1.02) (0.41,0.71)
1 1.15 0.86 0.75 0.77 0.99 0.59
(0.96,1.38) (0.75,0.99) (0.59,0.97) (0.68,0.87) (0.84,1.16) (0.44,0.79)
1 1.01 0.69 0.70 0.66 0.63 0.41
(0.82,1.25) (0.59,0.81) (0.52,0.93) (0.56,0.77) (0.53,0.74) (0.29,0.57)
1 0.92 0.73 0.69 0.57 0.91 0.62
(0.77,1.1) (0.63,0.85) (0.54,0.88) (0.51,0.64) (0.78,1.06) (0.46,0.83)
1 1.27 0.97 0.93 0.87 0.89 0.69
(1.1,1.46) (0.85,1.11) (0.74,1.17) (0.77,0.98) (0.77,1.03) (0.51,0.92) Overall... how long did you wait for an appointment?
How long after the stated appointment time did the appointment start?
Did you have confidence and trust in the doctor examining and treating you?
Did the doctor seem aware of your medical history?
Did you have confidence and trust in him or her? (This question is in the 'seeing another professional' section)
Sometimes, a member of staff will say one thing and another will say something quite different. Did this happen to you?
The pattern was similar in the better information, more choice domain. In most areas, experience across all ethnic categories was less positive than the White British baseline. The exception again was responses from White Irish patients, who gave similar responses on most questions. The question on being told about medication side effects also presented a different pattern, with most groups giving similar answers to White British except other white categories where results were more positive, and Asian respondents for whom responses were more negative. This can be seen in Table 6.
Table 6: Results for better information, more choice
White: British White: Irish White: Other Mixed
Asian/Asian British Black/black British Chinese/ other Better information, more choice
1 0.98 0.85 0.83 0.82 0.73 0
(0.85,1.14) (0.75,0.96) (0.67,1.04) (0.73,0.92) (0.64,0.83) (0.56,0.94)
1 1.04 0.67 0.71 0.50 0.56 0
(0.91,1.18) (0.6,0.74) (0.58,0.87) (0.46,0.56) (0.5,0.63) (0.38,0.62)
1 0.93 0.81 0.68 0.66 0.64 0
(0.75,1.16) (0.66,0.98) (0.49,0.93) (0.56,0.78) (0.54,0.77) (0.36,0.77)
1 1.31 1.14 0.71 0.69 1.14 0
(0.98,1.75) (0.88,1.46) (0.49,1.04) (0.57,0.82) (0.9,1.44) (0.32,0.72)
1 1.48 1.22 1.22 0.81 1.07 0
(1.19,1.84) (1,1.51) (0.86,1.72) (0.68,0.96) (0.88,1.29) (0.49,1.13) Were you involved as much as you wanted to be in decisions made
about your care and treatment?
Before the treatment did a member of staff explain any risks and or benefits in a way you could understand?
Did a member of staff explain the purpose of the medications you were to take at home in a way you could understand?
Did a member of staff tell you about medication side effects to watch for?
How much information about your condition or treatment was given to you? .73 .49 .52 .48 .75
The majority of BME groups across all five questions in the building closer
relationships domain were less likely to give positive responses than the White
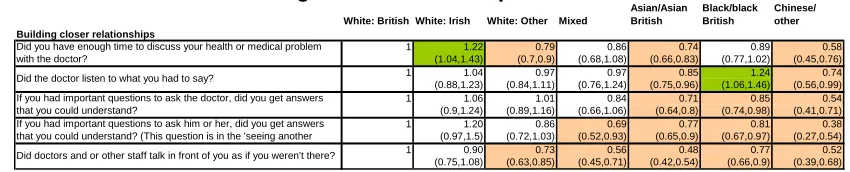
British group. There were two exceptions, with the Black/Black British group significantly more likely to report a positive experience when asked if the doctors listened to what they had to say. People in the White Irish group were more likely to report having enough time to discuss their health problems with the doctor. This can be seen in Table 7.
Table 7: Results for building closer relationships
White: British White: Irish White: Other Mixed
Asian/Asian British Black/black British Chinese/ other Building closer relationships
1 1.22 0.79 0.86 0.74 0.89 0
(1.04,1.43) (0.7,0.9) (0.68,1.08) (0.66,0.83) (0.77,1.02) (0.45,0.76)
1 1.04 0.97 0.97 0.85 1.24 0
(0.88,1.23) (0.84,1.11) (0.76,1.24) (0.75,0.96) (1.06,1.46) (0.56,0.99)
1 1.06 1.01 0.84 0.71 0.85 0
(0.9,1.24) (0.89,1.16) (0.66,1.06) (0.64,0.8) (0.74,0.98) (0.41,0.71)
1 1.20 0.86 0.69 0.77 0.81 0
(0.97,1.5) (0.72,1.03) (0.52,0.93) (0.65,0.9) (0.67,0.97) (0.27,0.54)
1 0.90 0.73 0.56 0.48 0.77 0
(0.75,1.08) (0.63,0.85) (0.45,0.71) (0.42,0.54) (0.66,0.9) (0.39,0.68) Did doctors and or other staff talk in front of you as if you weren't there?
Did you have enough time to discuss your health or medical problem with the doctor?
Did the doctor listen to what you had to say?
If you had important questions to ask the doctor, did you get answers that you could understand?
If you had important questions to ask him or her, did you get answers that you could understand? (This question is in the 'seeing another
.58
.74
.54
.38
.52
Ethnic differences in the clean, comfortable, friendly place to be domain were less
[image:10.595.83.508.408.494.2]pronounced than in the other domains. White Irish respondents were generally more positive, and Black/Black British respondents were more positive on one question. For the question relating to being told how long you would have to wait, patients across all groups responded similarly to the White British baseline, except for White Irish respondents whose responses were more positive. This can be seen in Table 8.
Table 8: Results for clean, comfortable, friendly place to be
White: British White: Irish White: Other Mixed
Asian/Asian British Black/black British Chinese/ other Clean, comfortable, friendly place to be
1 1.29 0.87 1.01 1.27 1.08 0
(1.05,1.57) (0.71,1.05) (0.72,1.4) (1.09,1.48) (0.88,1.32) (0.62,1.35)
1 1.22 0.79 0.92 0.75 1.18 0
(1.08,1.38) (0.71,0.88) (0.76,1.13) (0.67,0.83) (1.05,1.32) (0.41,0.69)
1 1.15 0.91 0.65 0.66 0.97 0
(0.96,1.38) (0.79,1.04) (0.52,0.81) (0.59,0.74) (0.84,1.12) (0.36,0.59) Were you told how long you would have to wait?
In your opinion, how clean was the Outpatients Department? Overall, did you feel you were treated with respect and dignity while you were at the Outpatients Department?
.91
.53
.46
exception, in that their responses showed either no differences from the White British group, or they responded more positively.
Accident and emergency 2004/05
This survey looked at the experiences of people who had recently attended an accident and emergency department. Across all domains, where ethnic differences were apparent they were generally in the less positive direction i.e. patients from minority ethnic groups responded less positively than those from the White British group.
As seen in other surveys, there was some evidence that patients from BME groups
reported worse experiences of access and waiting. The delay between arrival and
first speaking to a doctor or nurse appeared to be a particular issue for all BME groups other than the White Irish. White Other and Asian respondents gave more negative responses across all questions in this domain. This can be seen in Table 9.
Table 9: Results for access and waiting
White: British White: Irish White: Other Mixed
Asian/Asian British Black/black British Chinese/ other Access and Waiting
1 1.17 0.76 0.88 0.68 1.09 0
(0.97,1.41) (0.67,0.86) (0.71,1.09) (0.6,0.76) (0.94,1.26) (0.61,1.13)
1 0.86 0.87 1.07 0.75 1.04 0
(0.72,1.03) (0.77,0.99) (0.84,1.36) (0.66,0.84) (0.89,1.22) (0.65,1.27)
1 1.05 0.76 0.69 0.56 0.79 0
(0.87,1.26) (0.67,0.86) (0.56,0.86) (0.5,0.63) (0.68,0.91) (0.42,0.77) From the time you first arrived at the Emergency Department, how long
did you wait before being examined by a doctor or nurse practitioner? Overall, how long did your visit to the Emergency Department last?
How long did you wait before you first spoke to a nurse or doctor?
.83
.91
.57
In the safe, high quality, co-ordinated care domain, White Irish respondents were
generally more positive than the White British baseline and there were no differences observed in the Mixed group. More negative responses were recorded across
several questions for other ethnic groups. This can be seen in Table 10.
Table 10: Results for safe, high quality, co-ordinated care
White: British White: Irish White: Other Mixed
Asian/Asian British Black/black British Chinese/ other Safe, high quality, coordinated care
1 0.95 0.87 0.81 0.57 1.09 0
(0.77,1.17) (0.75,1.00) (0.64,1.02) (0.5,0.65) (0.92,1.3) (0.41,0.79)
1 1.32 1.05 1.09 0.55 0.69 0
(1.03,1.69) (0.9,1.23) (0.82,1.44) (0.46,0.66) (0.57,0.85) (0.57,1.25)
1 1.21 0.85 0.95 0.82 0.92 0
(1.01,1.46) (0.75,0.96) (0.77,1.18) (0.728,0.92) (0.8,1.06) (0.48,0.87) Sometimes in a hospital, a member of staff will say one thing and
another will say something quite different. Did this happen to you in the Did a member of staff tell you about any danger signals regarding your illness or treatment to watch for after you went home?
Did you have confidence and trust in the doctors and nurses examining and treating you?
.57
.85
.65
Results were more mixed in the better information, more choice domain. White
Irish responses were similar to the White British baseline except for one question where they were more positive. For questions relating to involvement in decisions, or being given information about your condition or treatment, most other groups gave more negative responses than the White British baseline. For other questions in this domain, responses were generally similar across all ethnic categories. This can be seen in Table 11.
Table 11: Results for better information, more choice
White: British White: Irish White: Other Mixed
Asian/Asian British Black/black British Chinese/ other Better information, more choice
1 1.11 0.74 0.82 0.52 0.60 0
(0.94,1.32) (0.66,0.84) (0.67,1.01) (0.46,0.58) (0.53,0.69) (0.28,0.51)
1 1.23 1.04 1.00 0.71 1.10 0
(0.8,1.89) (0.82,1.32) (0.66,1.53) (0.58,0.87) (0.84,1.43) (0.5,1.6)
1 1.64 1.18 1.35 0.85 1.12 0
(1.17,2.31) (0.96,1.47) (0.91,1.98) (0.69,1.05) (0.88,1.42) (0.42,1.31)
1 1.06 0.82 0.68 0.75 0.70 0
(0.88,1.28) (0.72,0.93) (0.55,0.84) (0.66,0.84) (0.61,0.81) (0.37,0.67) Were you involved as much as you wanted to be in decisions about your
care and treatment?
Did a member of staff explain the purpose of the medications you were to take at home in a way you could understand?
Did a member of staff tell you about medication side effects to watch for?
While you were in the Emergency Department, how much information about your condition or treatment was given to you?
.37
.89
.74
.50
In the building closer relationships domain, all minority groups with the exception
were less likely to respond positively to all questions in this domain whilst there were few differences elsewhere. This can be seen in Table 12.
Table 12: Results for building closer relationships
White: British White: Irish White: Other Mixed
Asian/Asian British Black/black British Chinese/ other Building closer relationships
1 0.89 0.64 0.51 0.38 0.74 0
(0.72,1.1) (0.56,0.74) (0.41,0.64) (0.34,0.43) (0.62,0.87) (0.36,0.69)
1 1.17 0.93 0.91 0.73 0.99 0
(0.99,1.38) (0.83,1.04) (0.74,1.12) (0.65,0.82) (0.86,1.13) (0.5,0.88)
1 1.26 0.93 0.89 0.71 0.86 0
(1.05,1.5) (0.83,1.05) (0.72,1.09) (0.63,0.79) (0.75,0.99) (0.42,0.75)
1 1.20 0.97 1.13 0.85 1.13 0
(0.99,1.44) (0.85,1.1) (0.9,1.41) (0.76,0.96) (0.97,1.31) (0.7,1.32)
1 1.13 1.01 1.27 0.82 1.00 0
(0.94,1.36) (0.88,1.15) (1.01,1.6) (0.72,0.93) (0.86,1.16) (0.55,1.04) Did doctors or nurses talk in front of you as if you weren't there?
Did you have enough time to discuss your health or medical problem with the doctor or nurse?
While you were in the Emergency Department, did a doctor or nurse explain your condition and treatment in a way you could understand? Did the doctors and nurses listen to what you had to say?
If you had any anxieties or fears about your condition or treatment, did a doctor or nurse discuss them with you?
.50 .66 .56 .96 .75
As with the inpatient and outpatient surveys, ethnic differences in the clean,
comfortable, friendly place to be domain were less pronounced than in the other
[image:12.595.81.508.328.407.2]domains, with patients from the White Irish, White Other and Black groups showing similar or more positive results compared with patients from the White British group. There were few ethnic differences in terms of cleanliness and pain control but respondents from the Asian group were consistently less positive. This can be seen in Table 13.
Table 13: Results for clean, comfortable, friendly place to be
White: British White: Irish White: Other Mixed
Asian/Asian British Black/black British Chinese/ other Clean, comfortable, friendly place to be
1 1.26 0.93 1.16 0.84 1.14 0
(1.07,1.47) (0.82,1.05) (0.94,1.43) (0.74,0.95) (0.99,1.32) (0.64,1.2)
1 1.38 0.93 0.79 0.83 1.18 0
(1.12,1.71) (0.82,1.06) (0.64,0.98) (0.73,0.94) (1.01,1.39) (0.51,0.95)
1 1.12 0.98 0.89 0.59 0.90 0
(0.91,1.37) (0.86,1.11) (0.71,1.11) (0.53,0.66) (0.77,1.04) (0.49,0.91)
1 1.45 0.93 1.26 0.64 0.86 0
(1.17,1.79) (0.81,1.07) (0.98,1.63) (0.55,0.73) (0.73,1.01) (0.57,1.19) Were you given enough privacy when being examined or treated?
Overall, did you feel you were treated with respect and dignity while you were in the Emergency Department?
Do you think the hospital staff did everything they could to help control your pain?
In your opinion, how clean was the Emergency Department? .88
.70
.67
.83
Overall, as seen with the inpatient and outpatient surveys, patients from the White Irish group were the exception in consistently showing either no difference from patients from the White British group, or responding more positively. On the other hand, patients from the Asian group were less positive across the board, responding less positively than the White British group to all but one question. Among other minority ethnic groups the patterns were more mixed, with patients responding similarly to White British patients on many questions; although where differences were apparent, they were generally in the less positive direction.
Primary care 2004/05
Unlike other national surveys organised by the Healthcare Commission, the national survey of local health services does not select participants on the basis of a recent care episode but rather from GP registration, so it covers the experiences of the community as a whole with respect to a range of issues in primary care.
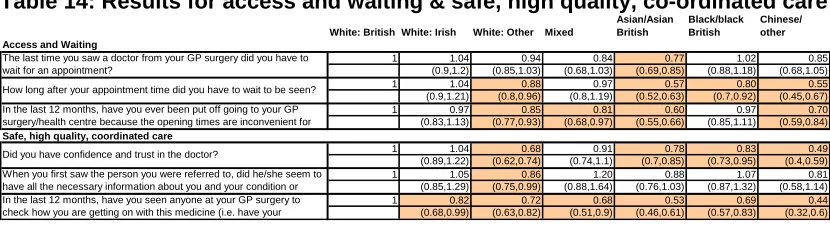
In the access and waiting domain, Asian respondents gave more negative
responses on all questions. The White Irish group showed no differences from the baseline group. All other groups showed some negative differences. The fewest differences were observed in the question about waiting for an appointment to see the doctor, in which only the Asian group gave more negative responses. A similar
pattern was observed in the safe, high quality, co-ordinated care domain. Here
Table 14: Results for access and waiting & safe, high quality, co-ordinated care
White: British White: Irish White: Other Mixed
Asian/Asian British Black/black British Chinese/ other Access and Waiting
1 1.04 0.94 0.84 0.77 1.02 0
(0.9,1.2) (0.85,1.03) (0.68,1.03) (0.69,0.85) (0.88,1.18) (0.68,1.05)
1 1.04 0.88 0.97 0.57 0.80 0
(0.9,1.21) (0.8,0.96) (0.8,1.19) (0.52,0.63) (0.7,0.92) (0.45,0.67)
1 0.97 0.85 0.81 0.60 0.97 0
(0.83,1.13) (0.77,0.93) (0.68,0.97) (0.55,0.66) (0.85,1.11) (0.59,0.84)
Safe, high quality, coordinated care
1 1.04 0.68 0.91 0.78 0.83 0
(0.89,1.22) (0.62,0.74) (0.74,1.1) (0.7,0.85) (0.73,0.95) (0.4,0.59)
1 1.05 0.86 1.20 0.88 1.07 0
(0.85,1.29) (0.75,0.99) (0.88,1.64) (0.76,1.03) (0.87,1.32) (0.58,1.14)
1 0.82 0.72 0.68 0.53 0.69 0
(0.68,0.99) (0.63,0.82) (0.51,0.9) (0.46,0.61) (0.57,0.83) (0.32,0.6) When you first saw the person you were referred to, did he/she seem to
have all the necessary information about you and your condition or In the last 12 months, have you seen anyone at your GP surgery to check how you are getting on with this medicine (i.e. have your The last time you saw a doctor from your GP surgery did you have to wait for an appointment?
How long after your appointment time did you have to wait to be seen? In the last 12 months, have you ever been put off going to your GP surgery/health centre because the opening times are inconvenient for
Did you have confidence and trust in the doctor?
.85 .55 .70 .49 .81 .44
In the next two domains, better information more choice and building closer
relationships, responses from White Other, Asian, Black/Black British and
Chinese/other groups were almost all less likely to be positive than those from the baseline White British group. Patients from Mixed or White Irish groups showed no differences from the White British baseline. This can be seen in Table 15.
[image:13.595.87.506.302.393.2]
Table 15: Results for better information, more choice & building closer relationships
White: British White: Irish White: Other Mixed
Asian/Asian British Black/black British Chinese/ other Better information, more choice
1 1.04 0.70 0.86 0.57 0.75 0
(0.9,1.2) (0.64,0.76) (0.71,1.04) (0.52,0.62) (0.66,0.85) (0.41,0.6)
1 1.05 0.68 0.99 0.55 0.76 0
(0.85,1.31) (0.59,0.77) (0.75,1.31) (0.48,0.62) (0.63,0.9) (0.37,0.64)
1 1.04 0.83 0.87 0.55 0.74 0
(0.87,1.24) (0.73,0.94) (0.67,1.12) (0.49,0.63) (0.62,0.87) (0.38,0.65)
Buildin
.49
.49
.50
g relationships
1 0.99 0.75 0.92 0.62 0.80 0
(0.84,1.16) (0.68,0.82) (0.75,1.14) (0.56,0.68) (0.69,0.91) (0.43,0.64)
1 1.04 0.69 0.92 0.64 0.94 0
(0.89,1.21) (0.63,0.76) (0.76,1.12) (0.58,0.7) (0.82,1.07) (0.44,0.64) Were you given enough information about any side-effects the medicine
might have?
If you had questions to ask the doctor, did you get answers that you could understand?
Were you given enough time to discuss your health or medical problem with the doctor?
Were you involved as much as you wanted to be in decisions about your care and treatment?
Were you given enough information about the purpose of the medicine?
.52
.53
As in the other surveys, responses to questions in the clean, comfortable, friendly
place to be domain showed a slightly different pattern of responses. Responses
were less positive for questions such as the cleanliness of the GP practice/health centre and being treated with respect and dignity by the doctor and the courtesy of the receptionist. However, the generally less positive pattern was reversed in one question. Minority ethnic groups were generally more likely than the White British group to say they had been told how long they would have to wait to see a doctor. This can be seen in Table 16.
Table 16: Results for clean, comfortable, friendly place to be
White: British White: Irish White: Other Mixed
Asian/Asian British Black/black British Chinese/ other Clean, comfortable, friendly place to be
1 1.17 1.26 1.61 1.22 1.36 0
(0.89,1.55) (1.06,1.48) (1.15,2.25) (1.03,1.44) (1.08,1.71) (0.65,1.33)
1 1.11 0.68 0.80 0.53 0.95 0
(0.96,1.28) (0.62,0.74) (0.67,0.95) (0.48,0.58) (0.85,1.08) (0.39,0.54)
1 0.88 0.68 0.82 0.54 0.84 0
(0.68,1.14) (0.59,0.78) (0.62,1.07) (0.48,0.61) (0.7,1.02) (0.27,0.43)
1 0.98 0.83 1.07 0.60 0.96 0
(0.81,1.19) (0.74,0.93) (0.84,1.35) (0.54,0.66) (0.82,1.12) (0.56,0.87) In your opinion, how clean is the surgery/health centre?
Did the doctor treat you with respect and dignity?
When you arrived, how would you rate the courtesy of the receptionist?
Did someone tell you how long you would have to wait? .93
.46
.34
.70
As in the outpatient survey, there was a general pattern for respondents from some black and minority ethnic groups to be less positive than those from the White British group about their experiences across the majority of issues covered. This was especially true of the White Other, Asian and Chinese/Other groups, who responded less positively to most of the 15 questions across the domains.
Respondents from the Black group showed fewer differences, although where they were apparent, the differences were mainly in the less positive direction. The White Irish and Mixed groups showed very few differences from the White British group.
[image:13.595.85.508.527.602.2]repeated across all domains of care in this survey. The only exception was in the question relating to being told how long you would have to wait. On this question the White Other, Asian, Black and Mixed groups all recorded more positive experiences than the White British baseline.
Community mental health 2006/07
The community mental health survey asks about the experiences of service users aged 16-65 registered on the Care Programme Approach (CPA), a group generally receiving long-term mental health care in a community setting. In contrast to some of the other surveys reported here, service users from BME groups reported very similar experiences to White British service users on most questions. Relatively few differences between ethnic groups were detected, although Black/Black British service users were more likely to give positive responses in a number of areas..
There were very few ethnic differences for the access and waiting domain. Service
[image:14.595.87.506.350.397.2]users from the White Other and Black/Black British groups were less likely than those from the White British group to say they received talking therapies if they wanted them, although Black/Black British respondents were more likely to report being able to contact the care co-ordinator. This can be seen in Table 17.
Table 17: Result for access and waiting
White: British White: Irish White: Other Mixed
Asian/Asian British Black/black British Chinese/ other Access and Waiting
1 1.05 0.88 0.85 1.06 1.54 0
(0.69,1.61) (0.64,1.22) (0.59,1.24) (0.76,1.47) (1.13,2.11) (0.33,1.33)
1 0.87 0.73 0.91 0.72 0.66 0
(0.57,1.34) (0.54,0.99) (0.61,1.35) (0.51,1.01) (0.47,0.93) (0.37,1.84) Can you contact your Care Co-ordinator if you have a problem?
In the last 12 months, did you get the talking therapy you wanted?
.67
.82
A few negative differences were observed for the safe, high quality, coordinated
care domain, although they were not consistent in the specific issues that were
highlighted. With only two isolated exceptions, no negative differences were
observed for the better information, more choice and building closer
relationships domains. Most BME service users reported similar experiences to
[image:14.595.90.506.543.735.2]White British users regarding information given to them and their relationships with staff (see Table 18). Notably, Black/Black British patients were more likely to give positive responses to questions about information surrounding their diagnosis and medications than their White British counterparts.
Table 18: Results for other domains in community mental health
White: British White: Irish White: Other Mixed
Asian/Asian British Black/black British Chinese/ other Safe, high quality, coordinated care
1 0.99 0.77 1.07 1.20 1.14 1
(0.71,1.39) (0.6,0.99) (0.78,1.47) (0.93,1.54) (0.89,1.45) (0.62,1.96)
1 0.68 0.82 1.02 0.94 0.87 1
(0.48,0.97) (0.62,1.08) (0.71,1.45) (0.71,1.23) (0.67,1.13) (0.61,2.25)
1 0.96 0.73 0.65 1.18 1.14 0
(0.6,1.55) (0.51,1.05) (0.44,0.94) (0.82,1.68) (0.83,1.56) (0.37,1.52)
1 0.75 0.71 0.96 0.73 0.80 1
(0.54,1.04) (0.55,0.91) (0.71,1.31) (0.56,0.93) (0.64,1.01) (0.57,1.78)
Better information, more choice
1 1.29 0.87 0.85 0.97 0.93 1
(0.95,1.74) (0.68,1.11) (0.64,1.14) (0.76,1.22) (0.75,1.17) (0.67,1.91)
1 0.79 0.82 0.93 0.72 0.84 0
(0.53,1.18) (0.6,1.12) (0.66,1.31) (0.54,0.98) (0.64,1.1) (0.47,2.03)
1 0.99 0.96 0.76 1.06 1.28 0
(0.73,1.34) (0.76,1.21) (0.57,1.02) (0.84,1.34) (1.03,1.59) (0.45,1.31)
1 1.31 1.13 1.10 1.19 1.71 0
(0.8,2.15) (0.77,1.64) (0.69,1.76) (0.82,1.73) (1.15,2.53) (0.39,2.38)
1 1.36 0.94 1.65 0.95 1.63 1
(0.86,2.15) (0.64,1.37) (1.06,2.57) (0.65,1.39) (1.15,2.3) (0.67,3.9)
Building relationships
1 1.04 0.91 0.93 1.18 1.09 1
(0.72,1.51) (0.69,1.18) (0.67,1.3) (0.9,1.54) (0.84,1.42) (0.69,2.43)
1 1.11 0.85 1.07 1.16 0.97 1
(0.71,1.73) (0.63,1.15) (0.73,1.57) (0.85,1.59) (0.73,1.3) (0.57,2.36)
1 0.85 0.61 0.72 0.97 1.20 1
(0.51,1.41) (0.42,0.89) (0.48,1.09) (0.66,1.41) (0.85,1.71) (0.45,2.27) Did you have trust and confidence in the psychiatrist you saw?
The last 2 times you had an appointment with a psychiatrist, was it…[with the same psychiatrist]?
Did you have trust and confidence in the CPN?
Do you have the number of someone from your local NHS Mental Health Service that you can phone out of office hours?
Do you have enough say in decisions about your care and treatment? In the last 12 months have you received any information about local support groups for mental health service users (e.g. MIND, Alzheimer’s
Did the psychiatrist treat you with respect and dignity?
Did the CPN listen carefully to you? Has your diagnosis been discussed with you?
Were the purposes of the medications explained to you?
Were you told about possible side effects of the medications?
Did the psychiatrist listen carefully to you?
Overall, very few ethnic differences were observed across this survey. Responses from the White Irish, Mixed and Chinese/Other groups showed virtually no
differences relative to the White British group. Although service users from the White Other group responded less positively to a few questions, for most questions they showed no difference relative to the White British group. The patterns for service users from the Black group differed to those for other minority ethnic groups, showing significantly more positive responses to four out of the 14 questions assessed.
Summary within each ethnic group, across settings
The pattern of differences between ethnic groups varied across different surveys, settings, and areas of interest, but some overall patterns do emerge. These need to be read with caution in view of the many other differences described, but nonetheless provide an insight into the overarching findings that emerge from the analysis.
On the whole, responses by patients from the White Irish group were either similar
to or more positive than responses by patients from the White British group. They were more likely to report positive experiences in a number of areas and sectors. In particular, they were more likely to respond positively than patients from the baseline White British group in the three surveys of the acute sector, whereas they were near identical to the White British group in the two community based surveys included.
By contrast, patients from the White Other and Asian/Asian British groups were
often less likely to report positive experiences relative to White British respondents on a range of surveys and questions. In comparison to other ethnic groups, they were consistent in reporting problems with the care they received. In each survey, respondents from these groups reported a slightly larger number of negative differences than other groups in the same survey.
For other ethnic groups, results overall were more varied. People of Mixed ethnicity
were likely to give less positive responses on several areas of outpatient care, but in other care settings their results were broadly similar to the White British group. The
Chinese/Other group was frequently less positive than the baseline, but seldom to
the same extent as Asian/Asian British respondents, and they showed few differences in the community mental health and inpatient surveys.
Patients from the Black group showed the most varied patterns across surveys.
Relative to the White British group, they were likely to be less positive in the outpatient, emergency department, and PCT surveys, but have a mixed pattern of positive and negative results in the inpatient survey. They were, furthermore, more likely to report positive experiences of community mental health care than other ethnic groups.
Some consistent patterns were noted across domains of patient care for particular minority ethnic groups. Relative to the White British group, and with the exception of
the White Irish group, responses to questions in the access and waiting domain
were generally less positive across the inpatient, outpatient, A&E and PCT surveys.
Another area that elicited generally less positive responses from patients from BME groups was involvement in decisions about their care and treatment, and the quality
of information given to them in the better information, more choice domain. This
the building closer relationships domain to say that staff talked in front of them as if there weren’t there.
Overall, across all surveys, the clean, comfortable, friendly place to be domain
showed less ethnic variation than some of the other domains. However, inpatients from BME groups were consistently less critical about noise at night than patients from the White British group. Also, BME respondents to the outpatient and PCT surveys were more likely to say they were told how long they had to wait before being seen.
Conclusion
This analysis describes variations by ethnic group in patients’ experience of a range of NHS services. It identifies areas where the experience of BME groups are less likely to be positive than those reported by patients from the White British group. Although there are a number of such areas, the ethnic differences observed do not follow consistent patterns, and in other aspects of care either no differences are apparent, or results are more likely to be positive than for the White British group. A range of factors, including differing perceptions and expectations of the survey respondents, may influence these findings. It is also possible that geographical location influences the results, for example if some ethnic categories are more frequent in particular locations. Readers are advised to consider overall patterns and avoid over-interpretation of the individual odd ratios/results.
Overall, the pattern of results, is consistent with the patterns reported in the
variations reports published by the Healthcare Commission9. Results are mixed for
different ethnic groups. Also, the fewest ethnic differences are found in the mental health survey and most ethnic differences found in the Primary Care survey.
The analysis showed a variety of different patterns across surveys and ethnic groups. Overall, patients from the White Irish group were more likely to give positive
responses compared with the White British baseline, and patients from the Asian group were less likely to give positive responses. Responses from other ethnic groups varied across surveys, between being less positive than the baseline White British group in some questions, and being broadly similar to it in other questions. Perhaps the greatest variance was apparent in the Black/Black British group as they were less likely to give positive responses in the PCT and outpatients surveys, but similar to or more positive than White British patients in the inpatients and particularly the mental health survey.
There were marked differences across surveys in the experiences reported by
patients and service users. Ethnic differences were least frequent in the inpatient and mental health surveys. Conversely, patients from different ethnic groups appear more varied in their responses where the intensity of care required is lower, such as in the primary care and outpatients surveys. One possible interpretation is that patients are more discerning or more varied in their response to ‘softer’ aspects of care in
situations where the intensity of care is lower. This is a generalisation, since some patients in primary care or community mental health settings would require more intense treatment. It may be that ethnic differences in such settings might be more influenced by cultural differences or other factors between groups of respondents, rather than differences in the standards of services. The results presented here do
9
Three such reports are available at:
not, however, allow us to determine precisely what the actual causes of the differences across surveys are.
The survey of community mental health service users, where very few ethnic
differences were apparent, is characterised by respondents with long-term and often multidisciplinary needs. The lack of significant differences observed here could also reflect the responsiveness of mental health services to the needs of service users from BME groups, which have been a policy priority in recent years.
In any survey of this type, people report from their own perspective, and judge experience against their own expectations. The physical experiences they have are not the only factors that influence what they say. Whilst every effort is made to minimise the effect of subjectivity (for example, by carefully testing all questions with people from different backgrounds, focusing on specific reportable events rather than more subjective concepts such as satisfaction) it is inevitable that peoples’ initial expectations regarding the care they receive will help frame their final opinion.
It is possible that there are ethnic and cultural differences in expectations and
perceptions, and some of the results here point towards this. For example, questions about cleanliness in the outpatient survey and about privacy in the A&E survey are assessments of a given situation applying to all patients. We would not expect the ward to be more dirty or the wards less private for patients of different ethnic groups in the same ward. We might expect, therefore, that there would be no difference in response for different patient subgroups. Yet ethnic differences are apparent for these results. Furthermore, there are marked differences in the patterns of
responses between different minority ethnic groups, with some groups consistently more negative, some more positive, and some showing a mixed picture in their responses compared with the White British comparator group. Whilst the physical experience of healthcare in these settings contributes to their responses, it is
possible that some of this variation is related to the particular socio-cultural attributes and perceptions of different ethnic groups.
It is a feature of the present analysis that comparisons over time are not presented. It is not possible to say whether the differences reported have been consistent over different years. Nonetheless, outline analysis of older data suggests that results overall tend to be fairly steady when repeating these surveys, so it is unlikely that the specific timing of the surveys will have heavily affected the outcomes found here.
Improving patient experience and reducing inequalities are key elements of
Government healthcare policy. To provide a service that is tailored to the needs of individual patients we need to take into account variations in attitudes, perceptions and experiences of different groups. The national results presented in this report, and the reports produced by the Healthcare Commission, provide information that helps to identify the areas where the perception of the quality of service provision varies between groups. In some instances this may point to real differences in provision and delivery, but it could also reflect differences in expectations. For improving the
experiences of patients and service users, however, both are equally important considerations: for patients and service users’ experiences to be positive, their expectations must be met by the service being provided.
Annex A – Interpretation of results
This annex focuses on the results of the analysis. It provides more detail on how to interpret the figures in the tables, and provides more detail on the caveats that should be borne in mind when looking at the results.
Interpreting the odds ratios
The aim is to understand whether the odds ratios for a particular ethnic group on a particular question are more positive or less positive than the White British
comparator. We do this by calculating a number called an odds ratio. Our attention focuses on whether the odds ratio is different from 1.
The odds ratio for the White British group is always 1, because this group is used as a baseline against which other groups are compared. If a BME group has an odds ratio greater than one, then we have some evidence that respondents in that group are more likely to give positive answers to that survey question. An odds ratio of less
than one means that members of the particular group are less likely to give a positive
answer.
If the odds ratio is quite close to 1, the difference could be because of random variation (reflecting a small number of respondents answering questions in a
particular way because of their own circumstances, rather than reflecting the reports of the group as a whole). To judge whether the experience of the ethnic group is statistically different to the White British group, we need to look at the confidence interval around the odds ratio. The confidence interval is the range within which we expect the ‘true’ value of the odds ratio to lie. For us to be confident that a result is a ‘real’ difference and not merely caused by random variation – that is, for a result to
be statistically significant – the range of the confidence interval must not cross 1:
both the upper and lower levels shown must be either greater or less than 1.
Some examples
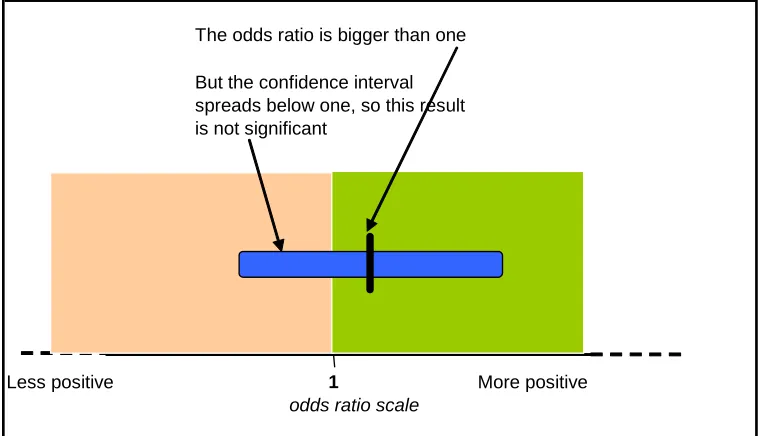
For example, if we look at the question “Were you involved as much as you wanted to be in decisions made about your care and treatment?” from the outpatient 2004/05 survey, the White Irish odds ratio is 1.04 and the confidence interval is 0.91 to 1.18. This shows that respondents who identified themselves as White Irish were slightly more likely to give a positive answer to this question than those who identified themselves as White British. However, the confidence interval overlaps with the value 1 (the value 1 is between 0.91 and 1.18) so we cannot be confident that this result is not simply due to random variation: the result is not statistically significant. This is illustrated in Figure 1.
Figure 1: A small difference, but not enough to be statistically significant
The odds ratio is bigger than one
Less positive 1 More positive
odds ratio scale But the confidence interval spreads below one, so this result is not significant
Figure 2: Example of an odds ratio that is statistically significant
The odds ratio is less than one, suggesting more negative responses
Less positive 1 More positive
odds ratio scale and now the confidence interval is all on the same side of one. This result is significant
The value of the odds ratio is not a measure of how positive the responses were from
a BME group, but a relative measure of how likely people from that group were to give positive responses compared with those of the White British group. A low odds ratio does not necessarily imply that a particular group gave very negative reports of their experience overall, but merely that they were less likely to give positive reports than the White British group.
Caveats to be noted when interpreting the results
The description above explains how to interpret one odds ratio. When interpreting the full set of results there are a number of points to be borne in mind:
• It is important to understand that this analysis has produced a large number of
results, it would not be sensible or appropriate to pick out extreme values. Instead, it is better to examine the overall pattern, looking at the range of ‘odds ratios’ across all questions, or across ethnic groups. The summary of results does this.
• The analyses are of the most recent available survey data for each setting. Some
of the surveys are in different years to each other. Comparisons between surveys cannot be interpreted as changes over time. The analysis for each survey is a ‘baseline’ score for that setting.
• The scores, as reported, do not necessarily imply a difference in patients’
treatment or that there are different standards of service for different groups. A patient’s response can be influenced by a number of factors including their own expectations and perceptions. The physical situation they find themselves in is only one such factor. For instance, some people may have a higher expectation of cleanliness than others. One example from the analyses is that responses are often age-related, with older patients responding more positively than younger patients. While we have adjusted for as many of these “confounding” factors as possible, there could remain differences in subjective factors.
• Results reflect an average profile for each group and the experience of selected
individuals within that group may be different.
Response rates
The response rate, that is the proportion of completed and returned surveys compared to the total number sent out, vary for different ethnic groups. Response rates are consistently lower for minority ethnic patients than they are for white groups across all five surveys for which comparisons were made.
There is a potential risk that different response rates could influence the results, for example if patients who were unhappy with their care were more likely to respond (creating a response bias). This bias tends to be larger if the response rate is lower.
The Acute Co-ordination Centre for the NHS Patient Survey Programme at the Picker Institute, working on behalf of the Healthcare Commission, conducted a review of
BME coverage in the patient survey programme10. It concluded that whole-sample
estimates are unlikely to be affected. However, there is very little information that would allow us to estimate non-response bias arising specifically from the higher levels of non-response amongst minority ethnic group members of the sample. It is possible, therefore, that the results presented in this report are affected slightly by differential response rates, but we do not expect this to have a large impact on the overall pattern of results.
10
The review of BME coverage in the patient survey programme is available at:
Annex B – Description of the analytical approach used to generate the scores
This annex provides more detail on the technical approach used in producing these results. It outlines some of the limitations imposed by the structure of the data and explains why this method of analysis was used.
Background
The surveys within the National Patient Survey Programme have large sample sizes. For example, results from the adult inpatient survey typically include responses from around 80,000 respondents. However, even with samples this large the number of responses from some of the smaller BME groups can be quite low. It is not possible to calculate reliable patient experience scores for each ethnic category, because the confidence intervals on any estimate are too large to make the results meaningful.
A brief summary of scoring methods attempted with these data.
The initial intention was to produce scores for each ethnic group, on exactly the same basis as the overall national patient experience scores. This would require us to produce age-gender standardised scores against each of five domains of care, within each of the five service settings.
We used bootstrapping techniques to assess the size of the confidence intervals on patient experience scores for ethnic groups. We explored a range of possible options for levels of standardisation and grouping of ethnic categories. Even with the age-gender standardization only, and a broad aggregation of ethnic groups (five categories), the confidence intervals were very large. It was clear that this direct approach would not produce useable scores. Some of the ethnic groups were very small and direct standardisation techniques failed, in some cases, because of empty cells or very small numbers in standardization cells.
The central problem was that there was insufficient information in the data to calculate scores on the same basis as the overall patient experience PSA scores. We used a four different approaches to simplify the data and hence to make maximum use of the available information:
a) Focussing on individual questions rather than domain scores. The surveys are structured to include a number of filter questions to guide respondents through sections that are relevant to them. This results in substantial numbers of missing values in some questions, and the missing values occur in different questions for different individuals. Grouping questions together into domains requires us either to impute missing values, or to ignore data from some respondents. Imputation leads to potentially misleading results by increasing the ‘leverage’ of answers from small numbers of individuals, and there are too many missing values for us to rely only on those respondents who answer all questions in a domain. Focussing on individual questions removes this problem and allows us to use all the available responses.
b) Grouping BME categories. Some of the BME categories are particularly small (the Bangladeshi group in particular has very few respondents in some