The Journal of Experimental Biology
ABSTRACT
Physiological and anatomical studies have suggested that alligators have unique adaptations for spatial hearing. Sound localization cues are primarily generated by the filtering of sound waves by the head. Different vertebrate lineages have evolved external and/or internal anatomical adaptations to enhance these cues, such as pinnae and interaural canals. It has been hypothesized that in alligators, directionality may be enhanced via the acoustic coupling of middle ear cavities, resulting in a pressure difference receiver (PDR) mechanism. The experiments reported here support a role for a PDR mechanism in alligator sound localization by demonstrating that (1) acoustic space cues generated by the external morphology of the animal are not sufficient to generate location cues that match physiological sensitivity, (2) continuous pathways between the middle ears are present to provide an anatomical basis for coupling, (3) the auditory brainstem response shows some directionality, and (4) eardrum movement is directionally sensitive. Together, these data support the role of a PDR mechanism in crocodilians and further suggest this mechanism is a shared archosaur trait, most likely found also in the extinct dinosaurs.
KEY WORDS: Auditory, Pressure-receiver, HRTF, Vibrometry, ABR, Archosaur, Dinosaur, Bird, Middle ear
INTRODUCTION
Crocodilians have sensitive tympanic ears (Higgs et al., 2002; Wever, 1971) and behavioral observations support their ability to localize sound (Garrick and Lang, 1977). They are the most vocal of the non-avian reptiles and have a sophisticated repertoire of auditory signals (Burghardt, 1977). Juveniles of several species [including Alligator mississippiensis(Daudin 1802)] perform both low frequency grunts and higher frequency distress calls (Burghardt, 1977), which reliably attract adults (reviewed by Garrick and Lang, 1977). Vocal communication is thought to be important for maternal care and promoting group cohesiveness among the young (Pooley, 1969; Pooley, 1977; Campbell, 1973; Garrick and Lang, 1977; Hunt and Watanabe, 1982; Passek and Gillingham, 1999) and part of courtship in adults (Garrick and Lang, 1977).
Like their sister group, birds, crocodilians exhibit a brainstem circuit based on delay lines and coincidence detection for sound RESEARCH ARTICLE
1Center for Comparative and Evolutionary Biology of Hearing, Department of Biology, University of Maryland College Park, College Park, MD 20742, USA. 2Department of Physiology and Biophysics, Neuroscience Training Program, University of Colorado Medical School, Aurora, CO 80045, USA. 3Department of Physical Therapy, University of Massachusetts Lowell, Lowell, MA 01826, USA. 4Institute of Biology, University of Southern Denmark, Campusvej 55, 5230 Odense M, Denmark. 5Department of Biology, University of Maryland College Park, College Park, MD 20742, USA.
*Author for correspondence (hilaryb@umd.edu)
Received 10 July 2013; Accepted 14 December 2013
localization in the nucleus laminaris (Carr et al., 2009). Further, electrophysiological recordings from the brainstem nucleus laminaris (Carr et al., 2009) reveal a greater range of sensitivity to the interaural time difference (ITD) cue to sound source location than would be expected based on head size, suggesting that these animals may have a unique adaptation for spatial hearing. The experiments in this study examine whether the physiologically recorded range of ITD sensitivity could be the result of the interaural connections of the crocodilian ear.
Internal structures, specifically the acoustic coupling of eardrums (i.e. the transmission of sound from one eardrum to another through internal pathways), can enhance directionality in a frequency-dependent manner (for review, see Christensen-Dalsgaard, 2005). In crocodilians, a pathway connecting the middle ear cavities has been discussed (Colbert, 1946; Owen, 1850; Wever and Vernon, 1957). Results from CT imaging (Witmer and Ridgely, 2008; Witmer et al., 2008) suggested a direct pathway, but the imaging was not carried out at sufficiently high resolution to exclude the presence of membranous barriers. We present anatomical data to confirm the presence of pathways connecting the middle ear cavities, further supporting the hypothesis that acoustic coupling of eardrums may be important for crocodilian sound localization.
Acoustic coupling can (depending on pathway properties and frequency) allow the ear to act as a pressure difference receiver (PDR). First described in insects (Autrum, 1940), PDRs, or internally coupled ears, have been observed in lizards (e.g. Christensen-Dalsgaard and Manley, 2005), frogs (e.g. Feng, 1980; Feng and Shofner, 1981; Jørgensen et al., 1991; Pinder and Palmer, 1983) and birds (Calford and Piddington, 1988; Hill et al., 1980; Hyson et al., 1994; Larsen et al., 2006; Pettigrew and Larsen, 1990; Rosowski and Saunders, 1980) (for reviews, see Christensen-Dalsgaard, 2005; Christensen-Christensen-Dalsgaard, 2011; Grothe et al., 2010; Klump, 2000). In most cases, acoustic coupling is achieved through either an interaural canal or large permanently open Eustachian tubes. Acoustical coupling produces directional responses at the tympanum as sound reaches both the external side of the tympanic membrane and, once filtered by the head and internal structures, the internal side of the tympanic membrane. Eardrum motion is driven by the instantaneous difference in pressure between the sound component on the external and internal side of the membrane (Feng and Christensen-Dalsgaard, 2008) (for models, see Fletcher and Thwaites, 1979; Pinder and Palmer, 1983; Vossen et al., 2010), and the greatest directional effect is thus produced at frequencies where the amplitudes of the internal and external sound components are equal, so their direction-dependent phase changes can produce large differences in eardrum motion.
Even with strong coupling of the eardrums, this condition is only met in a certain frequency range, depending on the acoustics of the ear. At frequencies below this range the phase differences between internal and external components cancel eardrum motion (Pinder
Biophysics of directional hearing in the American alligator
(
Alligator mississippiensis
)
Hilary S. Bierman1,*, Jennifer L. Thornton2, Heath G. Jones2, Kanthaiah Koka2, Bruce A. Young3,
The Journal of Experimental Biology
and Palmer, 1983), while at high frequencies acoustical coupling isreduced. Thus, when frequency increases, the ear becomes more of a pressure receiver, affected by only the pressure wave hitting the external tympanic surface (Moiseff and Konishi, 1981; Pinder and Palmer, 1983). More precisely, the motion of the tympanic membrane is due to a combination of the mechanical resonator properties of the eardrum and the acoustic resonator properties of the internal skull pathways (Pinder and Palmer, 1983).
In pressure receiver ears, such as the typical mammalian ear, the three primary cues for sound localization are ITDs [difference in the timing of sound between the ears], interaural level differences [ILDs; difference in the sound pressure level (SPL) between the ears] and monaural spectral shape cues [frequency-specific changes in SPL gain generated by differential refraction and reflection patterns off the head and pinnae]. ILDs are most relevant for higher frequency sound and ITDs for lower frequency sound (Hafter, 1984; Macpherson and Middlebrooks, 2002). Larger head size or lower frequencies (up to a limit) increase the available range of ITDs (Kuhn, 1977; Tollin and Koka, 2009b). The acoustic shadow of the head, as well as external structures, such as pinnae (Carlile and King, 1994; Carlile and Pettigrew, 1987; Guppy and Coles, 1988; Koka et al., 2011; Koka et al., 2008; Tollin and Koka, 2009a) or a facial ruff (von Campenhausen and Wagner, 2006; Hausmann et al., 2009), can generate ILD cues, and may also affect ITD and monaural spectral shape cues (Koka et al., 2011). However, acoustically coupled ears as described above can lead to ILD and ITD that are larger than expected from head size (Christensen-Dalsgaard and Manley, 2008; Christensen-(Christensen-Dalsgaard et al., 2011b). Cochlear microphonic recordings from a number of birds reveal interaural delays at high frequencies close to those expected from the path length around the head, while delays measured at low frequencies can approach more than three times this expectation (Calford and Piddington, 1988; Hyson et al., 1994; Köppl, 2009; Rosowski and Saunders, 1980; Wagner et al., 2009).
As part of this study, we measured the transformation of sound waves around the head of juvenile alligators to determine what acoustic cues are available within the animal’s hearing range. As the alligators lack a specialized external structure for generating cues, the results should be similar to spherical head model predictions (Duda and Martens, 1998). Because of its ecological relevance, measurements were also made at the water surface to determine whether localization cues were enhanced or degraded.
In addition to passive acoustical and anatomical experiments, two additional sets of experiments, auditory brainstem response (ABR) and laser vibrometry were carried out to test for directionality in the periphery. Peripheral encoding of directionality, expected from a PDR mechanism, was examined at the level of both eardrum movement and the auditory nerve. Laser vibrometry was used to directly measure the directionality encoded in eardrum movement and the transmission and phase gain afforded by interaural coupling, while ABR measurements were used to examine directional
sensitivity in auditory nerve activity. As peak 1 of the ABR is the far-field representation of the negatively oriented peak of the compound action potential (CAP N1) of the auditory nerve (Jewett et al., 1970; Köppl and Gleich, 2007), threshold changes with speaker position test the directional sensitivity of auditory nerve activity.
Together, these experiments provide data to support the role of a PDR mechanism in alligator sound localization. They further allow comparisons with data from birds and fossil dinosaurs and suggest the PDR mechanism is an archosaur synapomorphy.
RESULTS
Morphology of auditory passages
Thick transverse sections of hatchling heads allowed us to examine the interconnected nature of the tympanic cavity and other cranial sinuses previously described (Witmer and Ridgely, 2008; Witmer et al., 2008). The tympanic cavities in these animals are connected by passages both dorsal and ventral to the braincase (Fig. 1). Dorsally, the tympanic cavities are connected via the intertympanic recess. Ventrally, the tympanic cavities are connected through the quadrate sinus, the pharyngotympanic (Eustachian) recess and the median pharyngeal recess. Routing of suture thread through these passages shows that no thin membranes block transmission through dorsal or ventral spaces.
Acoustic filtering by the alligator head
Monaural broadband spectral cues were examined by plotting directional transfer function (DTF) gain across frequency at different azimuth and elevations; positive DTF gain indicates that the presence of the head and ears of the alligator boosted the SPL at the tympanic membrane while negative gain indicates that the head and ears attenuated the SPL. Fig. 2 shows these data for a specimen in the mouth-closed condition. Within the animal’s hearing range (less than approximately 2 kHz) no spectral notches were observed, as wholly expected because of the long wavelengths of low frequency sounds and the sizes of the alligator external ear structures, indicating that there were no sharp drops in gain across frequencies. Similar observations were made in specimens with the mouth open, on the water surface, and with the earlid cut away (data not shown). List of abbreviations
[image:2.630.339.558.505.675.2]ABR auditory brainstem response CAP compound action potential DTF directional transfer function HRTF head-related transfer function ILD interaural level difference ITD interaural timing difference MLS maximum length sequence PDR pressure difference receiver SPL sound pressure level
Fig. 1. Thick coronal slice through the skull of a young alligator. A single piece of brown suture has been threaded through the contiguous
The Journal of Experimental Biology
The data did not depend on session as speaker, microphone, dataacquisition and speaker location, and calibration were constant, and the signal was always well above the noise floor. DTF gain changed progressively with different elevation positions, and greater gains were seen at more positive elevations. The only exceptions were that, close to 1 kHz, gains approached 0 and at around 2 kHz a small deflection and temporary reversal of the relationship between elevation position and gain was observed. The deflection around 2 kHz was observed to a lesser extent in azimuth plots. In either azimuth or elevation plots, this deflection did not exceed 5 dB, with greater variability of measurements in the water surface condition. The deflection at 2 kHz may be an artifact associated with probe tube positioning, despite our best efforts to control for this (see Materials and methods). Room resonances were not a factor in these measurements for frequencies ~200 Hz [see control measurements reported elsewhere (Lupo et al., 2011), p. 33].
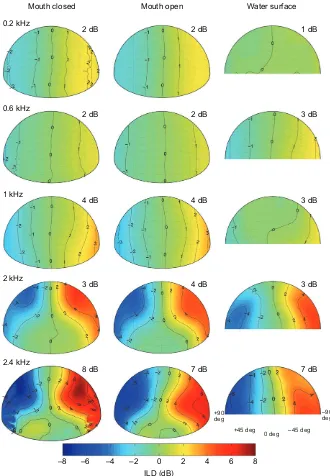
Aitov projections of DTF gain show that for all three experimental conditions there is a small increase in the magnitude of the acoustic gain with increased frequency (Fig. 3). A 4–5 dB difference in maximum DTF gain was observed between 0.2 and 2.4 kHz measurements. A 1 dB increase in maximum gain at 0.2 kHz, compared with 0.6 kHz, may more likely be due to increased noise than to signal. For dry (mouth closed and mouth open) conditions there were some spatial locations showing modest and very localized directionality. In the water surface condition, the area in which this low level directionality was found has been expanded. However, in no condition does the gain exceed 8 dB, far less than observed in pinnate animals even for these frequencies (e.g. Tollin and Koka, 2009a; Tollin and Koka, 2009b; Koka et al., 2011), and at 1000 Hz, the animal’s best hearing frequency, maximum DTF gains were measured at 5–6 dB.
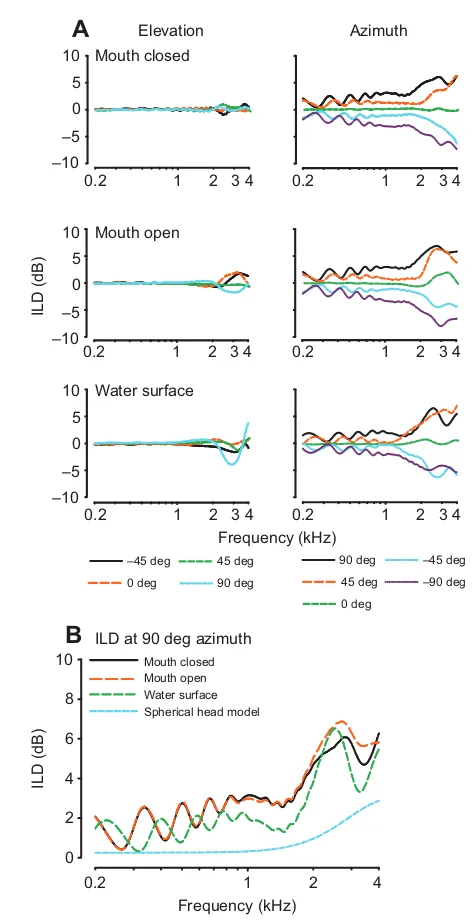
ILD cues were calculated as the difference between left- and right-ear DTFs for a given frequency and spatial location (Fig. 4A). Positive ILD values reflect a higher gain at the left ear than at the right ear. In all three conditions, ILD gain is relatively flat at all positions for frequencies below 2 kHz. Even above 2 kHz, ILD gain does not vary much with changes in elevation, generally varying by only 1–2 dB with relatively greater variability in the water surface condition. Though magnitude differences are small, ILD gain increases across azimuth positions and with higher frequencies for all azimuth positions. Aitov projections show that the maximum
ILD gain increases with frequency (5–6 dB difference measured between 0.2 and 2.4 kHz), but is less localized in the water surface condition, and at 2 kHz and below never exceeds 4 dB (Fig.5). The largest ILDs are found in elevated positions; the water condition slightly decreased the maximum gain (~1 dB) and made the head map appear more spherical. Comparison of our data with those produced by a spherical head model with the diameter of the alligator head as input, at 90 deg azimuth for all three conditions, shows that the alligator head increased ILD by less than 2 dB over that expected from a spherical model head with the same linear dimensions as the alligators measured here (Duda and Martens, 1998) (Fig. 4B). Maximum ILD gains, and greatest deviations from the spherical head model, were observed at the upper edge of the animal’s hearing range.
Interaural timing cues were measured using both maximum length sequences (MLS) and tone stimuli, yielding analogous results. Both Aitov projections (constructed from MLS stimulus data; Fig. 6A) and plots of ITD across azimuth position (constructed from tone stimulus data; Fig. 6B), are comparable across mouth-closed and mouth-open conditions and show slightly greater variability in the water surface condition. Maximum ITDs ranged from 100μs (mouth closed) to 120μs (water surface). Note, that across-condition variance may be considered negligible because of the 10μs sampling period. Plots of ITD across azimuth (Fig. 6B) do not show frequency-dependent variability.
In order to determine the physiological relevance of our acoustic ITD measurements, we plotted them alongside previous ITD coding measurements made from best-frequency neurophonic and single-unit nucleus laminaris recordings (Carr et al., 2009). Neurophysiological studies were carried out in similarly sized animals of the same species [mean ± s.d. earflap to earflap head width: 32.8±3.5 mm (Carr et al., 2009) compared with 37.2±2.1 mm (current study)]. The magnitude of the empirically measured acoustical ITDs observed here (Fig. 7) cannot account for the much larger observed range of neurophysiological sensitivity and tuning to ITDs. Also, compared with neurophysiological data, acoustical ITD measurements were less frequency dependent.
Directionality of ABR
In a population of alligators of similar age and size to those used in the neurophysiological study, examination of ABR peak 1 thresholds
DTF gain (dB)
–15 –10 –5 0 5 10 15
Left EL –15 deg
0 deg 15 deg 30 deg 45 deg
Right EL
Frequency (kHz) –15
–10 –5 0 5 10 15
Left AZ Right AZ –30 deg
–15 deg 0 deg 15 deg 30 deg
1
[image:3.630.54.337.68.280.2]0.2 2 34 0.2 1 2 3 4
Fig. 2. Monaural broadband spectral shape cues. Plots of directional transfer function (DTF) gains from a single animal (0006F264B5), for left and right ears, across elevation (EL) and azimuth (AZ) during the mouth-closed condition. No systematic changes in spectral notches were observed across frequency while increasing elevation or azimuth. Within the animal’s hearing range,
approximately ≤2 kHz, gains were close to zero and relatively flat
The Journal of Experimental Biology
for a 1000 Hz masker tone revealed directional sensitivity at thelevel of the auditory nerve (Fig. 8). When the direction of the masker input changed relative to the recording ear, the normalized differential ABR (the difference between the response to a modified click stimulus in the presence and absence of a background masker) threshold is lower when the masker speaker is ipsilateral to the stimulus speaker and the recording ear (Fig. 8A). This threshold difference was ~10 dB, and was significant across the nine animals used (ipsilateral threshold 28.6±3.3 dB, contralateral threshold 38.1±3.9 dB, two-tailed t-test P=0.0001) (Fig. 8C). Overlay of the polar plots of data from all nine animals at all eight recording positions (Fig. 8B) shows a consistent ovoidal directionality with lower thresholds at ipsilateral directions and a median directionality of 10 dB.
Directionality of eardrum movement
We used laser Doppler vibrometry to measure the tympanic membrane motion in response to free-field sound stimuli. Cylinder
surface plots (Christensen-Dalsgaard and Manley, 2005) were constructed from the eardrum movements and show the eardrum vibration transfer function amplitude as a color contour (Fig. 9A). Similar to the Aitov projection plots, the nose of the animal is positioned at zero, the animal’s tail is at 180 deg, and negative numbers represent contralateral space. In all five animals tested, directional sensitivity of the eardrum is largest around 1 kHz. The maximal ipsilateral–contralateral difference for all animals ranged from 10 to 18 dB at the best directional frequency, which was found from 870 to 1370 Hz in the five animals. The directivity of the eardrum at these frequencies was generally ovoidal with strongest responses from ipsilateral angles. The average ipsilateral– contralateral difference at 1 kHz was approximately 10 dB, as shown by the averaged polar plot in Fig. 9Ci. The phase of the eardrum vibration transfer function also varied systematically with frequency and direction. At 1 kHz, the ipsilateral–contralateral average phase difference was 1.8 rad, corresponding to an average maximal ITD on the eardrum of 286μs (Fig. 9Cii). In order to determine whether
Mouth closed Mouth open Water surface
0.2 kHz
3 dB 3 dB 2 dB
DTF gain (dB)
–8 –6 –4 –2 0 2 4 6 8
+90 deg
–90 deg +45 deg
0 deg –45 deg
0.6 kHz
2 dB 2 dB 4 dB
1 kHz
6 dB 5 dB 6 dB
2 kHz
8 dB 8 dB 6 dB
2.4 kHz
[image:4.630.55.379.66.541.2]7 dB 7 dB 7 dB
The Journal of Experimental Biology
the measured directionality was generated by binaural interaction ofthe two ears, we made free-field measurements with the contralateral ear blocked with Gold Velvet ear mold material (Fig. 9Aii,B). The polar plot of the response of the unblocked ear at 1 kHz has an ovoidal characteristic with highest sensitivity to ipsilateral sound. Blocking of the contralateral ear produce a more omnidirectional (i.e. less directional) directional response.
We measured the interaural transmission by comparing eardrum vibrations with ipsilateral and contralateral coupler stimulation (see Materials and methods for details). Interaural transmission amplitude gain, the ratio of the sound level at the inside of the ipsilateral eardrum compared with the sound level just outside the contralateral eardrum, was measured as the ratio of eardrum
vibration transfer functions under contralateral and ipsilateral stimulation and found to be approximately −5 dB (i.e. a ratio of 0.56) at behaviorally relevant frequencies, around 1 kHz (Fig. 10A). Arithmetical addition of internal and external sound at the eardrum would then result in a directionality of approximately 11 dB [ranging from 0.44 (destructive interference) to 1.56 (constructive interference) times the response to sound outside the eardrum] (Christensen-Dalsgaard and Manley, 2008). Fig. 10B shows the interaural transmission gain phase for the same animal. Across animals, the slope of the phase gain corresponds to an interaural transmission delay of 200–250μs.
The nares may provide an additional pathway for sound waves to reach the internal surface of the tympanic membrane (Owen, 1850). To explore this hypothesis, we repeated the transmission gain experiments, placing the coupler sound source at the nose. Unlike the case where the coupler was placed near the ear, these measurements showed that the transmission gain was small and in most cases close to or below the cross-talk. Additionally, in a control experiment we placed a small reflector on the jaw of the animal to measure head vibration. The vibration at the eardrum was approximately 20 dB greater than the head vibration (data not shown).
DISCUSSION
Paucity of localization cues in the alligator’s acoustical space
The present measurements of directionality, both eardrum and ABR, show that acoustical coupling of the eardrums facilitates directional sensitivity at frequencies up to 1.5 kHz, with up to 18 dB difference in thresholds and eardrum vibrations between contralateral and ipsilateral stimulus directions. In contrast, ITD and ILD cues produced by sound diffraction and arrival time differences are too small, at the frequency hearing range of alligators (approximately <2 kHz), to account for physiological measurements. These data suggest that another mechanism, potentially a PDR, could generate larger neurophysiological ITDs. Our data support the role of a PDR mechanism in alligators by demonstrating (1) the presence of pathways for intertympanic cavity communication, (2) that auditory cues generated acoustically by the head and ears cannot account for physiological measurements of sound localization, (3) strong directionality at 1 kHz with ABR measurements, (4) that eardrum coupling occurs at relevant frequencies, where the high transmission gain can account for the measured 10–18 dB directionality and (5) increased ITD produced by the interaural transmission.
Sound localization strategy of crocodilians
Studies of neural coding mechanisms for sound localization have generated debate over the differences and similarities between mammals and birds, specifically the role of evolutionary constraints versus optimal coding (Carr et al., 2009; Harper and McAlpine, 2004; Schnupp and Carr, 2009). Studies in crocodilians – a sister group to birds with different body form and lifestyle, and low frequency hearing (Higgs et al., 2002; Wever, 1971) – inform this debate. Modeling studies (Harper and McAlpine, 2004) suggest that the optimal neural coding strategy for ITDs is determined by the physiological range of ITDs (the ITDs generated by the periphery); thus, the magnitudes and ranges of acoustic cues available to the animal must be considered when evaluating mechanisms for sound localization across species.
Similar to birds, crocodilians have binaural coincidence detector cells for ITD computation in the CNS (Carr et al., 2009). In these cells, systematic variation in the peak ITD response of individual neurons is caused by neural delay lines and forms a local place code Azimuth
ILD (dB)
Mouth closed
Frequency (kHz) 1 2 3 4
0.2 –10
–5 0 5 10
1 2 3 4 0.2
90 deg 45 deg 0 deg
–45 deg –90 deg –45 deg
0 deg
45 deg 90 deg
Mouth open
Water surface Elevation
A
ILD at 90 deg azimuth
Frequency (kHz) 1
ILD (dB)
0 2 4 6 8
10 Mouth closed Mouth open Water surface Spherical head model
4 2 0.2
B
1 2 3 4 0.2
1 2 3 4 0.2
–10 –5 0 5 10
1 2 3 4 0.2
–10 –5 0 5 10
[image:5.630.57.295.61.521.2]1 2 3 4 0.2
The Journal of Experimental Biology
for the sound source (the Jeffress model). The head-related transferfunction (HRTF) data we measured suggest that the peak ITD responses of nucleus laminaris neurons could not readily create a place code in the alligator, as the maximum spike rates of most recorded nucleus laminaris neurons (Carr et al., 2009) are associated with ITDs greater than the empirically measured acoustic ITDs, i.e. many best ITDs could not be generated by arrival-time differences at the ears. By comparison, barn owls, which localize higher frequency sounds, have best ITDs generally within their acoustically available range (Vonderschen and Wagner, 2009; Wagner et al., 2007). Like alligators, small mammals often have best ITDs that are greater than their acoustically available range of ITDs (for reviews, see Grothe et al., 2010; McAlpine, 2005). In these mammals, the distribution of response peaks outside the physiological range has been used to support a model based on detection of the slope of the ITD function, which generally conveys the most information (Harper and McAlpine, 2004; Butts and Goldman, 2006; Skottun et al., 2001).
Despite the presence of many best ITDs outside the acoustically available range, the organization of the auditory brainstem in alligators is otherwise consistent with a Jeffress-like circuit (Carr et al., 2009). The auditory nerve and neurons of the nucleus magnocellularis phase-lock to the auditory stimulus, and the target neurons of the nucleus magnocellularis in the nucleus laminaris act as coincidence detectors for both tones and noise (Carr et al., 2009; Smolders and Klinke, 1986). Locations of best ITD responses in the nucleus laminaris are consistent with a place code, with best ITDs near 0μs located more medially than recordings with more contralateral best ITDs. Furthermore, characteristic phase measurements of most nucleus laminaris neurons clustered near zero, indicating they were peak-type coincidence detectors (Batra et al., 1997; Yin and Kuwada, 1983). Some units were recorded with characteristic phases closer to 0.5, suggesting ‘the presence of additional inhibitory interactions (see Tollin and Yin, 2005), either at the periphery or in the projections to [nucleus laminaris]’ (Carr et
Mouth closed Mouth open Water surface
0.2 kHz
2 dB 2 dB 1 dB
ILD (dB)
–8 –6 –4 –2 0 2 4 6 8
+90 deg
–90 deg +45 deg
0 deg –45 deg
0.6 kHz
2 dB 2 dB 3 dB
1 kHz
4 dB 4 dB 3 dB
2 kHz
3 dB 4 dB 3 dB
2.4 kHz
[image:6.630.53.383.68.544.2]8 dB 7 dB 7 dB
The Journal of Experimental Biology
al., 2009). Nevertheless, alligators have a large range of neural bestITDs (median value ~450μs), when compared with chickens [~90μs (Köppl and Carr, 2008)] and gerbils [173μs (Pecka et al., 2008)]. Given support for both a place code and the presence of ITDs outside the range measured here, it seems likely that at least the small alligators used in these studies could use the slope of the ITD functions to localize sound, in addition to using ITD maxima to guide orientation.
The acoustic measurements presented here demonstrate that the large range of neurophysiological sensitivity to ITDs could not be generated by the acoustical ITDs produced by the alligator’s external anatomy (i.e. the size of the head). We show that a greater range of ‘acoustical’ ITDs may be afforded by additional acoustic processing at the periphery through a PDR mechanism. There is anatomical support (this study and others) for coupling, and such mechanisms function at low frequencies in birds (Calford and Piddington, 1988; Klump and Larsen, 1992) (for reviews, see Grothe et al., 2010; Klump, 2000).
Anatomy and function
As previously suggested by Witmer and Ridgely (Witmer and Ridgely, 2008), our thick tissue slice preparation (Fig. 1) shows that the intertympanic recess, quadrate sinus and pharyngeal recesses connect the two middle ears both dorsally and ventrally to the brain case. These large, patent anatomical connections support the hypothesis that alligator ears could function as pressure-gradient receivers, which could contribute to the increased range of ITDs (Carr et al., 2009) and to the directional sensitivity (Bierman et al., 2011) observed physiologically and not in our measurements of acoustic space.
Our laser vibrometry measurements show that at least one of these pathways functions to couple the eardrums at sound frequencies in the range of alligator hearing. Both ABR and vibrometry measurements (Figs 8, 9) demonstrated gains of ~10 dB around 1 kHz, while similar passive acoustical recordings at 1 kHz show about half that amount, with a maximum 4 dB ILD gain. Phase analysis of vibrometry data generated maximum ITD
estimates of ~300μs (Fig. 10), while ITDs measured from HRTF were ~100μs. Thus, these additional delays are most likely caused by the sound transmission through the interaural canal (delays of up to 250μs as measured from the transmission gain, Fig. 10B). Though these additional gains are modest (about a factor of three), they clearly demonstrate an increase over the passive acoustic baseline, and support the contribution of a PDR mechanism to increasing the magnitude of the binaural cues for localization.
The PDR mechanism proposed is fundamentally similar to that described in lizards but, based on differences in anatomy, more Mouth closed Mouth open Water surface
110 µs 100 µs
400 Hz
1 kHz
1.5 kHz 600 Hz
1.2 kHz 2 kHz
–90 –60 –30 0 30 60 90
ITD (µs)
–200 –100 0 100 200
Azimuth (deg)
–90 –60 –30 0 30 60 90 –90 –60 –30 0 30 60 90
B
A
120 µs100
50
0
–50
–100 +90
deg
–90 deg
+45 deg
0 deg –45 deg
ITD (µs)
–200 0 200 400 600 800 1000 1200 1400
0.5 1 1.5 2
ITD (µs)
Frequency (kHz)
Neurophonic Single NL unit Mouth closed Mouth open Water surface
*
*
*
*
*
*
*
Fig. 7. Comparison of acoustically measured ITDs with
neurophysiologically recorded ITDs. Acoustical ITD measurements come from tone stimulus data presented in Fig. 6B. ITD values from neurophonic and single-unit nucleus laminaris (NL) recordings have been reproduced from Carr et al. (Carr et al., 2009).
Fig. 6. Distribution of ITD across spatial locations. (A) Spatial plots of ITD, measured using a maximum length sequence (MLS), across azimuth and elevation for the three conditions. The color bar indicates the range of ITD. The maximum ITD is noted in the upper right corner of each plot. (B) ITDs
The Journal of Experimental Biology
limited. For frequencies between 2 and 5 kHz, the acousticinteraction of the eardrums in lizards produces up to a 40 dB difference in eardrum vibration in response to directional sound stimulation (Christensen-Dalsgaard and Manley, 2008; Vossen et al., 2010). This coupling of the middle ear cavities is achieved via the mouth cavity and large permanently open Eustachian tubes (Christensen-Dalsgaard, 2005; Christensen-Dalsgaard et al., 2011b). In alligators, the interaural pathway is narrower and, therefore, there is less coupling and thus less directional sensitivity.
Floating on the air–water interface
Our data do not support the hypothesis that alligators exclusively use external head structures to filter sound directionally. As predicted from their hearing range, which is dominated by low frequencies (Higgs et al., 2002), we found no differences in measurements made with the earflap intact compared with when it was removed. Our data do show, however, that floating on the water surface may enhance monaural broadband spectral cues (the area of greatest DTF gain was shifted and enlarged) and/or cause ILD cues to deteriorate. In this way, crocodilians may use their environment to increase directional sensitivity. This is similar to bat ‘trawling’ behavior, where the bats use the acoustic properties of the water surface to increase the area in which they can detect prey (Siemers et al., 2005). Other mammalian
predators can adjust foraging behavior so that olfactory cues are enhanced by wind direction (Ruzicka and Conover, 2011). Further studies, performed in larger alligators, which are more likely to float, may be useful to determine the significance of any water–surface cue enhancement. Very recent work by Dinets (Dinets, 2013), has shown that floating adult alligators display selective locomotion toward an underwater sound source, but the role of the auditory system in this behavior is unknown.
The Archosaur condition
The earliest reptiles (including anapsida and diapsida) are though to have lacked tympanic hearing (Lombard and Bolt, 1979; Christensen-Dalsgaard, 2005; Clack, 1993; Lombard and Bolt, 1979). Sauria, containing Archosaurs and Lepidosaurs (lizards and snakes), diverged from each other to independently develop tympanic hearing in the Triassic (Clack, 2002). Tympanic hearing also arose in Anura and mammalian lineages in the Triassic, interestingly timed with the emergence of sound-producing insects (for review, see Christensen-Dalsgaard, 2005). Crocodilians are thought to have diverged from other archosaurs (including dinosaurs) in the late Triassic (Clack, 2002; Janke and Arnason, 1997). Questions remain about the structure of the ancestral archosaur ear and the sound frequencies to which it was sensitive.
12 10 8 6 4 2 0 70 dB SPL
60 dB SPL
55 dB SPL
50 dB SPL
45 dB SPL
40 dB SPL
35 dB SPL
30 dB SPL
25 dB SPL
20 dB SPL
12 10 8 6 4 2 0 Time (ms)
Ipsilateral (90 deg) Contralateral (270 deg)
0 10 20 30 40
Threshold (dB SPL)
Ipsilateral 90 deg
Contralateral 270 deg
A
C
B
*
−10
0 10 20
−20
−10 0 10 20
0 30
60
90
120
150
180
210 240
[image:8.630.53.361.67.483.2]270 300 330
The Journal of Experimental Biology
Hearing in large dinosaurs is thought to be limited to lowfrequencies (Gleich et al., 2005; Kundrát and Janáček, 2007; Starck, 1995; Witmer et al., 2008). Gleich et al. (Gleich et al., 2005) used a regression analysis of extant archosaurs to support this hypothesis, and showed that body mass and size of the basiliar papilla are correlated, and that body mass is inversely correlated to best auditory frequency. This conclusion is also consistent with anatomical reconstructions in palaeognathous birds (Starck, 1995) and tyrannosaurs (Witmer et al., 2008), which show extensive middle ear pneumaticity. Increased pneumaticity (also achieved through venting) decreases elastic stiffness, which would otherwise attenuate responses to low frequency sounds (Pickles, 1988). As elasticity allows for overcoming rigidity, low frequency sound pressures are able to produce comparatively large tympanic membrane and columella displacement (Pickles, 1988; Witmer et al., 2008). Kundrát and Janáček (Kundrát and Janáček, 2007) further note that sensitivity to low best frequencies is correlated with the low frequencies of the calls of most palaeognathous birds. Also, lowering the resonance frequency of the air spaces in the skull by increasing its size would produce optimal directionality at lower frequencies by the PDR mechanism.
In mammals, the air spaces of the skull roof and braincase typically derive from the paranasal sinuses, while in archosaurs this is rare and the braincase is pneumatized by extensions of the paratympanic sinues (Witmer and Ridgely, 2008). Witmer and Ridgely (Witmer and Ridgely, 2008) show, through CT scan reconstructions for alligator, ostrich and tyrannosaur, that ‘the paratympanic air sinuses encircle the bones of the brain cavity’. Anatomical studies of the oviraptorid dinosaur Conchoraptorsuggest ‘enhanced acoustic abilities at the lower-frequency registers’ (Kundrát and Janáček, 2007). Kundrát and colleagues further describe, as in alligators, a dorsal and ventral
pathway connecting the two middle ears, allowing them to function as PDR. Starck (Starck, 1995) also describes an interaural pathway, composed of the anterior tympanic recess connecting middle ear cavities, in palaeognathous birds. Note, that as discussed in the Introduction, the inherent directionality derived from these connections is limited to low frequencies.
The ventral pathway is present in other troodontid (Currie and Zhao, 1993) and oviraptorid (Clark et al., 2002) fossils, and is argued to be present in all recent and mesozoic birds (Starck, 1995). The pathway provides ventral contralateral communication between the middle ears and the pharyngotympanic tubes (Hill et al., 1980; Saiff, 1988; Starck, 1995). In birds, the function of coupled middle ear cavities has focused on the ventral interaural pathway, the so-called interaural canal (Calford and Piddington, 1988; Feng and Christensen-Dalsgaard, 2008; Hill et al., 1980; Larsen et al., 2006; Moiseff and Konishi, 1981).
The dorsal (supraencephalic) pathway further couples the middle ear cavities and has been hypothesized to amplify the directionality afforded by the ventral (interaural pathway) (Kundrát and Janáček, 2007). Minimally, a second pathway would also serve an additional ‘vent’, increasing pneumaticity and thus low frequency sensitivity. In addition to its presence in Conchoraptor, the dorsal supraencephalic pathway has been observed in fossil Citipati(Clark et al., 2002), Struthioand Casuarius(Starck, 1995) and suggested in Troodon (Currie and Zhao, 1993). Variation was found in the degree of trabeculation between Conchoraptorand Citipati(Kundrát and Janáček, 2007), perhaps highlighting the plasticity of this system and hinting toward the modern avian condition where dense trabeculation is common.
Measures in crocodilians (here and elsewhere) show that low frequency hearing and a two-pathway pressure difference
180 120 60 0 –60 –120
Frequency (Hz)
500 1000 1500 2000 2500 3000 3500
4000 –50
–40 –30 –20 –10 0 10 20
180 120 60 0 –60 –120
500 1000 1500 2000 2500 3000 3500 4000
Direction
Ai
B
Aii
0 30
60
90
120
150
180
−90 deg
–60
–30
–40–30–20–10 0 10 20
–120
–150
0 –20
0
0 30
60
90
120
150
180 –150 –120
–90 deg –60 –30
–40 –30 –20 –10 –40 –10
Delay, 1000 Hz
300 0 300 500
0 30
60
90
120
150
180 –150
–120
–90 deg
–60
–30
500 0 100 100
Amplitude, 1000 Hz
Ci
[image:9.630.55.433.67.397.2]Cii
–30Fig. 9. Eardrum vibration in response to free-field sound stimuli.(Ai) Cylindrical surface plot of the eardrum vibration transfer function showing eardrum vibration velocity transfer function (color scale, in dB
re. 1 mms–1Pa–1) as a function of direction
(x-axis, positive angles are ipsilateral, negative contralateral, the animal facing 0 deg) and frequency (y-axis). (Aii) Plot in same animal following blockage of the contralateral eardrum shows altered sensitivity. (B) Polar plot of eardrum vibration velocity transfer function at 1 kHz with (red) and without (blue) blockage of the contralateral eardrum. Blockage of the contralateral ear significantly alters ipsilateral eardrum vibration amplitude except when the sound is presented adjacent to the ipsilateral ear (60, 90 and 120 deg). For all panels, the snout is at 0 deg, the tail is at 180 deg, the left/ ipsilateral ear corresponds to positive degrees and the right/contralateral ear to negative degrees. (C) Polar plots of the averaged eardrum vibrations (transfer functions) to 1 kHz directional sound in five alligators. (Ci) Eardrum vibration
amplitudes. (Cii) Eardrum transfer function phases relative to the 90 deg (ipsilateral) direction are converted to delays by multiplying the phase difference by
(2π×0.001 s). The delay at 90 deg was set
The Journal of Experimental Biology
mechanism for sound localization may have been the ancestralarchosaur condition. The dorsal intertympanic pathway is less visible in some modern birds (Willis et al., 2013), as it is filled with trabeculated bone. How the interactions between the two pathways and the extreme scaling of the system (comparing extinct dinosaurs with modern species) affect the frequency response, directionality and sensitivity of the system awaits further study.
MATERIALS AND METHODS
For acoustic, ABR and anatomical experiments, hatchling and juvenile American alligators were obtained from the Rockefeller Wildlife Refuge (Grand Chenier, LA, USA). Housing and experimental procedures complied with IACUC standards and were approved by the University of Maryland Animal Care and Use Committee; acoustical measurements complied with
the University of Colorado School of Medicine Animal Care and Use Committee. For vibrometry experiments, five juvenile American alligators were obtained on loan from the Department of Zoophysiology at Aarhus University, Denmark. Vibrometry methods complied with Danish government approved animal care and use. See Fig. 11A and Table 1 for sample size and morphological measurements.
Acoustic space measurements
Animals were euthanized via intramuscular (i.m.) injection of Euthasol (Virbac, Fort Worth, TX, USA). Each animal was initially injected with the equivalent of 100 mg kg–1pentobarbital sodium; additional doses were given
every 10–30 min until reflexes, breathing and heart beat ceased. The average total dose of Euthasol was 1.5±0. 3 ml kg–1(195±31.8 mg kg–1pentobarbital
sodium). Post-mortem, the gut and internal organs were removed from the body cavity and replaced with polyester stuffing material and the body was
B
A
–40 –20 0 20 40
0.5 1 1.5 2 2.5 3 3.5 4 4.5
Gain amplitude (dB) –12
–8 –4 0 4
Phase gain (rad)
8
0.5 1 1.5 2 2.5 3 3.5 4 4.5 Frequency (Hz)
F
C
sel
ABR threshold (dB SPL)
40 60 80 100
0.1 1 10
E
B
d ia
l
A
D
tm
[image:10.630.66.495.70.167.2]Frequency (kHz)
Fig. 10. Vibrometry measurements of amplitude (A) and phase (B) transmission gain through the head.For both A and B, three ipsilateral and three contralateral trials (10 averages/trial) were averaged, giving a sum of 30 ipsilateral and 30 contralateral averages used for the ratio calculation. (A) The moving 10-point average (black line) is higher than the amplitude gain measured using a probe microphone adjacent to the ipsilateral ear (red). (B) Phase gain
measurements are shown for relevant frequencies and can be fitted to a line with slope of −0.001 (R2=0.82).
[image:10.630.66.513.402.674.2]The Journal of Experimental Biology
resealed to retain the initial body shape. Prior to measurements, specimens were kept chilled but not frozen. Specimens were transported from the University of Maryland to the University of Colorado School of Medicine for acoustic measurements. Acoustical cue measurements have similarly been made with frozen (Koka et al., 2008; Obrist et al., 1993; Wotton et al., 1995), formalin-fixed (Aytekin et al., 2004; Firzlaff and Schuller, 2003; Fuzessery, 1996; Koay et al., 1998), alcohol-fixed (Obrist et al., 1993) and cadaver (Chen et al., 1995; Coles and Guppy, 1986; Day et al., 2012; Harrison and Downey, 1970; Maki and Furukawa, 2005; Martin and Webster, 1989; Middlebrooks and Pettigrew, 1981; Moore and Irvine, 1979) animals. As we were specifically not looking for effects of sound transmission through the head, post-mortem specimens were suitable for examining the passive acoustical properties of the alligators.
The tip of a 50 mm-long flexible silicone probe tube (Brüel and Kjær, Nærum, Denmark, part no. AF-0555, 1.65 mm outer diameter) was inserted, using a needle, through the caudal portion of the superior earlid so that it sat in the meatal cavity, just lateral to the tympanic membrane (Fig. 11C,D). Tubes were inserted bilaterally so measurements could be made from both ears. Under most natural conditions there is a several millimeter-long slit left open between the superior and inferior earlids (Wever, 1978; Wever and Vernon, 1957). To obtain this position in our post-mortem specimens, we used fine dissecting scissors to trim the inferior earlid (Fig. 11C).
Methodology for acoustic measurements followed Koka et al. (Koka et al., 2011). Experiments were performed in a ~3×3×3 m double-walled sound-attenuating chamber (IAC, Bronx, NY, USA). Acoustic stimuli were presented from 25 calibrated loudspeakers (Morel, Elmont, NY, USA, MDT-20) attached to a custom-built horizontally oriented semicircular boom with a 1 m radius. The 25 loudspeakers were spaced in azimuth along the boom, 7.5 deg apart, from −90 deg (left) to +90 deg (right). The animal was placed in the arc (in the center of the room) and its interaural axis was aligned in the center of the arc using two lasers attached to the two poles of the speaker boom. Movement of the boom allowed free-field eardrum acoustic impulse responses to be recorded from a total of 527 different locations, covering azimuth (−90 deg to +90 deg) and elevation (−45 deg low elevations in the frontal hemisphere to +180 deg directly behind the animal). An initial short broadband noise was used to test for probe microphone function and alignment of the animal at the center position, as evidenced by a 0μs ITD.
Two types of acoustic measurement stimuli were used, 11th order MLS (Rife and Vanderkooy, 1989) and pure tones. MLS signals are broadband stimuli, and were 20.96 ms in length and presented from each loudspeaker 128 times without interruption, at full 24 bit resolution at a rate of 97,656.25 Hz (Tucker-Davis Technologies, RP2.1, TDT, Alachua, FL, USA). Measurements using pure tone frequencies relevant to the auditory capabilities of this species (0.2, 0.4, 0.6, 1, 1.2, 1.5, 2, 4 kHz; Fig. 11B) were also done independently to provide supporting data. Tone stimuli were 10 ms in duration (including 2.5 ms ramps) and presented 25 times at ~80 dB SPL from each loudspeaker with a 40 ms interstimulus period.
The resulting acoustic waveforms at the level of the left and right tympanic membranes were recorded through two probe tube microphones (Brüel and Kjær, Type-4182), amplified, and collected using two analog-to-digital converter channels sampling each at 97,656.25 Hz (TDT RP2.1) and stored on a PC hard disk for later processing. Acoustic calibration measurements, in the absence of the animal, were made to account for the spectral characteristics of the loudspeakers, microphones and probe tubes. Calibration of the recording microphones was done using Sound Calibrator Type 4231 (Brüel and Kjær).
Measurements were taken under several conditions: (1) the animal in its ‘normal rest state’ with the mouth closed (Fig. 11C), (2) the animal in its normal rest state with the mouth propped open, with a 2 mm wooden dowel, to a gape angle of ~23 deg (Fig. 11E), (3) the animal in its normal rest state with earlids mostly removed (Fig. 11D), (4) the decapitated head of an animal in its normal rest state placed in a 192×19×20 mm plastic container filled with water (Fig. 11F). The head was arranged such that it was in the center of the container and the water level approached the level of the temporal mandibular joint. Gauze padding was used to insure the head was horizontally level. This positioning was considered a good first approximation of a naturalistic position. With the exception of the water surface condition, all measurements were done with the full body of the animal intact. The water surface condition also required that longer probe tubes (150 mm) be used, and corresponding calibration of these tubes was done post hocto ensure proper analysis. The longer tubes did not have much impact on the very low sound frequencies (<4 kHz) being recorded in this study.
Acoustical data processing and analysis
Circular cross-correlation of the original MLS stimulus and the probe-microphone recordings were used to calculate the acoustic impulse responses for each ear and each location (Koka et al., 2011; Rife and Vanderkooy, 1989). As in Koka et al. (Koka et al., 2011), in order to get rid of small-amplitude reflections (resulting from room size), impulse responses were truncated to 514 points (5.24 ms) using a Hanning window centered approximately on the point of maximal amplitude. The results presented here did not change when impulse responses were truncated to a longer 10.48 ms instead of 5.24 ms. The truncated impulse responses were computed into HRTFs by dividing the frequency response of the probe-tube recording by that of the relevant loudspeaker calibration (e.g. Koka et al., 2011). The resulting HRTF function then represents the acoustical gain and delay introduced by the head. In order to normalize for the effect of exact placement position of the tip of the probe microphone, the HRTF at each location was divided by the geometrical mean of all the measured HRTF functions at all spatial locations for that ear. As described by Middlebrooks (Middlebrooks, 1999), this normalization procedure yields so-called directional transfer functions (DTFs); DTFs are simply the sound source direction-dependent components of the HRTFs. As described elsewhere (Koka et al., 2011), DTFs were passed through a bank of band-pass filters to remove small-amplitude fluctuations (i.e. noise) in the resulting DTFs. The amplitude spectra of the DTFs were then calculated using a 512-point fast Fourier transform. Spatial plots of the acoustical data were produced using Aitov projections (Bugayevskiy and Snyder, 1995), where the nose of the animal is considered to project in the 0 deg position. These projects are simply heat plots showing gain (relative dB change) across a sphere due to the animal’s external head morphology. For water surface condition data, the lower portion of auditory space was excluded from spatial plots to avoid effects of the plastic container.
Anatomy
Three hatchling animals (~1 week of age) were used for anatomical dissection. Each animal was first anesthetized with isoflurane (Halocarbon Products Corporation, River Edge, NJ, USA), then injected with an overdose of Euthasol (390 mg pentobarbital sodium, 50 mg phenytoin sodium per ml; Vibrac). Preservation was achieved through an intracardial perfusion of 0.01 mol l−1 phosphate buffer followed by 4% paraformaldehyde in
[image:11.630.61.573.81.140.2]phosphate buffer. Post-perfusion, the specimen was decapitated and the head
Table 1
N Mass (g) Interaural distance (cm) Head width (cm) Head length (cm)
Acoustic space measurements 4 345.6±85.5 2.25±0.2* 3.72±0.2
Anatomy 2 Hatchling
Auditory brainstem response 9 305±69 2.3±0.3
Laser vibrometry 5 1100±300 3.19±0.1 5.48±0.4 10.3±0.4
Values are given as means ± s.d.
The Journal of Experimental Biology
placed in chilled 4% paraformaldehyde. Heads were soaked for 5 weeks in Cal-Ex (Fisher Scientific, Pittsburgh, PA, USA), and then sectioned transversely at 2 mm with a disposable microtome blade.
Directional masking ABR
A directional masking ABR paradigm was used to test the directional sensitivity to a 1 kHz tone (N=9). All recordings were done inside a large walk-in anechoic chamber (~2.7×4.6 m) kept between 24 and 30°C. As the temperature remained stable across a single experiment, threshold levels were not adjusted for temperature.
We used custom-made software (QuickABR) (Brandt et al., 2008; Christensen-Dalsgaard et al., 2011a). As illustrated in Fig. 12, ABRs were recorded in response to a brief broadband click stimulus in the presence and absence of an ongoing masker tone. The difference between the masked and unmasked response is a measure of sensitivity to the tone, and the continuous nature of the masker allows for frequency specificity at low frequencies. Stimuli were presented in trains of eight clicks with alternating polarity. Responses from 400 presentations were averaged for both the stimulus and stimulus plus masker conditions. Sensitivity to the masker tone was then computed by subtracting the averaged signals (Fig. 12B). The resulting differential signal is normalized to the amplitude of the unmasked click response. The resulting signals are relatively robust to small movements of electrodes and over long recording sessions. Repeated trials with adjusted masker tone amplitude were used to determine an auditory threshold for the masker tone frequency. Sound production and signal recordings were controlled with custom-written QuickABR software via a TDT RM2 processor and low-impedance Medusa Digital Biological Amplifier System. Calibration was performed with the custom-written software and a ¼ in microphone (G.R.A.S. Sound and Vibration Type 26AC, Holte, Denmark).
The click stimulus was designed as a short broadband signal, where the power spectrum of the audible signal was relatively flat over the test frequencies (Fig. 12C,D). The amplitude of the stimulus was set at the lowest level needed to evoke the maximum amplitude ABR (~77 dB SPL). Directional sensitivity was measured as the directional release from masking, measured by emitting the click from the ipsilateral direction and the masker from other directions. The animal was restrained on a foam plank
and placed on a rotating table, so the heading direction of the animal could be rotated with respect to the masker sound source (Fig. 12E). Attached to the table was an arm holding a 5¼ in cup mid-range speaker (Pioneer, Kanagawa, Japan), 0.6 m from the center of the animal’s head. This speaker was used to emit the stimulus. A second, larger speaker (Eminence Speaker, Eminence, KY, USA, BassLite 10 in woofer with custom-built speaker box), placed 3 m from the animal’s head, was used to play the masker tones. Recordings were made with the animal facing eight positions at 45 deg intervals. The order of positions during recordings was randomized and coded so that analysis could be done blind. ABR thresholds were determined using visual inspection (Boettcher et al., 1993; Walsh et al., 1986). Comparison of analysis methods by Brittan-Powell et al. (Brittan-Powell et al., 2002) supports visual inspection as an accurate technique.
Laser vibrometry
Animals were anesthetized by forelimb i.m. injection of ketamine (10 mg kg–1) and dexmedetomidine (Dexdomitor; Pfizer, Owings Mill, MD,
USA; 0.2201 mg kg–1). If the animal remained alert after 20 min, a
supplemental dose of 5 mg kg–1 ketamine and 0.08 mg kg–1
dexmedetomidine was administered. A small piece of Gold Velvet ear molding material (All American Ear Mold Laboratories, Oklahoma City, OK, USA) was used to prop open the earlid, to allow the laser beam access to the tympanic membrane. Care was taken to ensure that the ear molding material did not directly touch the eardrum. Upon completion of the experiment, animals received IM injections of atipamezole (Antisedan; Pfizer) in a dosage equivalent to the final dexmedetomidine volume administered.
Experiments were performed in a 4×4 m chamber tested to be anechoic to below 200 Hz. Eardrum motion was measured by focusing a Polytec laser (Irvine, CA, USA) on the surface of the eardrum and monitoring deflections of the beam’s reflection. To minimize variation we consistently focused the beam as close as possible to the conical apex of the tympanic membrane. Following Christensen-Dalsgaard and Manley (Christensen-Dalsgaard and Manley, 2008), stimulation and data recording was done using Tucker-Davis 2 hardware and customized software (DragonQuest). Stimuli consisted of frequency sweeps (150 ms, 200–7500 Hz, 20 averages, sound levels of
0 0.5 1 1.5 2 2.5
Time (s)
S M
16 14 12 10 8 6 4 2 S
S+M Normalized differential
ABR
2 µV
Time (ms)
3 m 0.6 m
X X
X X
X
X X
X
3000 5000 7000 –100
–90 –80 –70
Frequency (Hz)
Relative power (dB)
1000
60 mV 150 µs
C
A
D
B
E
M
[image:12.630.56.381.70.381.2]S
Fig. 12. Directional masking ABR methodology.
(A) ABRs are recorded in response to a brief broadband stimulus (S) in the presence and absence of a continuous tone masker (M, dark blocks). Stimuli are presented in trains of eight clicks with alternating polarity. (B) Responses from 400 presentations are averaged for both the stimulus (S) and stimulus plus masker (S+M) conditions. Sensitivity to the masker tone is computed by subtracting the averaged signals. The resulting differential signal is normalized to the amplitude of the stimulus response. (C,D) Digital recording (C) and power spectrum (D) of positive polarity modified click spectrum. The stimulus has been optimized so that the power spectra of the audible signal was relatively flat over the test frequencies and the amplitude was at the lowest level needed to produce a maximal response.
The Journal of Experimental Biology
70–93 dB SPL). For free-field recordings, stimuli were emitted from 12 JBL 1G loudspeakers placed at 30 deg intervals around the animal, each at 1 m distance. Transmission measurements utilized a brass coupler containing a Beyer 48.0A earphone placed 5 mm from the eardrum. Sound levels at the eardrum were measured by a Brüel and Kjær 4182 probe microphone fixed to the preparation stand. The following combinations were measured: coupler and probe ipsilateral to laser, coupler and probe contralateral to laser, and coupler contralateral and probe ipsilateral to laser. A Brüel and Kjær ½ in microphone was used to calibrate the speakers. Analysis was done using custom-written software, Microsoft Excel and SigmaPlot. Transmission amplitude and phase gains were calculated as the ratio of eardrum vibration in response to the sound source coupled to the ipsilateral and contralateral ear. Ratios were calculated using the average of 30 ipsilateral and 30 contralateral measurements (averaging 3 trials of 10 measurements).
Acknowledgements
We thank G. Ashida for commenting on this manuscript, Tobias Wang (Aarhus University) for lending us the alligators for the vibrometry measurements and Daphne Soares (University of Maryland) and Ruth Elsey (Rockefeller Wildlife Refuge) for procurement of the alligators used for audiogram, passive acoustic measurements and anatomy. We also thank D. Soares for the submitted cover art.
Competing interests
The authors declare no competing financial interests.
Author contributions
H.S.B. was involved in all aspects of the project and was primarily responsible for manuscript preparation. Acoustic measurements were performed in laboratory of D.J.T. D.J.T., H.G.J., J.L.T. and K.K. were involved in the design, performance, analysis and figure production for acoustic measurements. D.J.T. was also involved in manuscript drafting and editing. B.A.Y. was responsible for the anatomical study. C.B. wrote the software used for ABR measurements. Vibrometry measurements were performed in the laboratory of J.C.D. J.C.D. provided support for ABR measurements, was instrumental in performing and analyzing vibrometry data, and was involved in manuscript editing. ABR experiments were carried out in the laboratory of C.E.C. C.E.C. was involved in experimental design, provided financial support and aided in manuscript editing.
Funding
This work was supported by National Institute on Deafness and Other Communication Disorders Grant [grant number DC-00436] to C.E.C., National Institutes of Health [grant number P30 DC-04664] to the University of Maryland Center for the Evolutionary Biology of Hearing (H.S.B.), National Institute on Deafness and Other Communication Disorders Grant [grant number DC-011555] to D.J.T., Danish National Science Foundation [grant DFF1323-00132 ] and Carlsberg Foundation grants to J.C.D. and National Science Foundation grant [grant number 0817208] to D. Soares. Deposited in PMC for release after 12 months.
References
Autrum, H.(1940). Über lautäusserungen und schallwahrnehmung bei arthropoden II.
Z. Vgl Physiol.28, 326-352.
Aytekin, M., Grassi, E., Sahota, M. and Moss, C. F.(2004). The bat head-related
transfer function reveals binaural cues for sound localization in azimuth and elevation. J. Acoust. Soc. Am.116, 3594-3605.
Batra, R., Kuwada, S. and Fitzpatrick, D. C.(1997). Sensitivity to interaural temporal
disparities of low- and high-frequency neurons in the superior olivary complex. I. Heterogeneity of responses. J. Neurophysiol.78, 1222-1236.
Bierman, H. S., Carr, C. E., Brandt, C., Young, B. A. and Christensen-Dalsgaard, J.
(2011). Evidence for low-frequency sound localization in the American alligator (Alligator mississippiensis). In 2011 Neuroscience Meeting Planner. Washington, DC: Society for Neuroscience. Online.
Boettcher, F. A., Mills, J. H. and Norton, B. L.(1993). Age-related changes in
auditory evoked potentials of gerbils. I. Response amplitudes. Hear. Res.71, 137-145.
Brandt, C., Andersen, T. and Christensen-Dalsgaard, J.(2008). Demonstration of a
portable system for auditory brainstem recordings based on pure tone masking difference. In1st International Symposium on Auditory and Audiological Research, pp. 241-247. Holbæk, Denmark: Centertryk.
Brittan-Powell, E. F., Dooling, R. J. and Gleich, O.(2002). Auditory brainstem
responses in adult budgerigars (Melopsittacus undulatus). J. Acoust. Soc. Am.112, 999-1008.
Bugayevskiy, L. M. and Snyder, J. P.(1995). Map Projections. A Reference Manual.
Philadelphia, PA: Taylor and Francis.
Burghardt, G. M. (1977). Of iguanas and dinosaurs: social behavior and
communication in neonate reptiles. Am. Zool.17, 177-190.
Butts, D. A. and Goldman, M. S.(2006). Tuning curves, neuronal variability, and
sensory coding. PLoS Biol.4, e92.
Calford, M. B. and Piddington, R. W. (1988). Avian interaural canal enhances
interaural delay. J. Comp. Physiol. A162, 503-510.
Campbell, H. W.(1973). Observations on acoustic behavior of crocodilians. Zoologica
58, 1-11.
Carlile, S. and King, A. J.(1994). Monaural and binaural spectrum level cues in the
ferret: acoustics and the neural representation of auditory space. J. Neurophysiol.
71, 785-801.
Carlile, S. and Pettigrew, A. G.(1987). Directional properties of the auditory periphery
in the guinea pig. Hear. Res.31, 111-122.
Carr, C. E., Soares, D., Smolders, J. and Simon, J. Z.(2009). Detection of interaural
time differences in the alligator. J. Neurosci.29, 7978-7990.
Chen, Q. C., Cain, D. and Jen, P. H.(1995). Sound pressure transformation at the
pinna of Mus domesticus. J. Exp. Biol.198, 2007-2023.
Christensen-Dalsgaard, J.(2005). Directional hearing in nonmammalian tetrapods. In
Sound Source Localization(ed. A. N. Popper and R. R. Fay), pp. 67-123. New York, NY: Springer.
Christensen-Dalsgaard, J.(2011). Vertebrate pressure-gradient receivers. Hear. Res.
273, 37-45.
Christensen-Dalsgaard, J. and Manley, G. A.(2005). Directionality of the lizard ear.
J. Exp. Biol.208, 1209-1217.
Christensen-Dalsgaard, J. and Manley, G. A.(2008). Acoustical coupling of lizard
eardrums. J. Assoc. Res. Otolaryngol.9, 407-416.
Christensen-Dalsgaard, J., Brandt, C., Wilson, M., Wahlberg, M. and Madsen, P. T.
(2011a). Hearing in the African lungfish (Protopterus annectens): pre-adaptation to pressure hearing in tetrapods? Biol. Lett.7, 139-141.
Christensen-Dalsgaard, J., Tang, Y. and Carr, C. E.(2011b). Binaural processing by
the gecko auditory periphery. J. Neurophysiol.105, 1992-2004.
Clack, J. A.(1993). Homologies in the fossil record: the middle ear as a test case.
Acta Biotheor.41, 391-409.
Clack, J. A.(2002). Gaining Ground. Bloomington, IN: Indiana University Press.
Clark, J. M., Norell, M. A. and Rowe, T.(2002). Cranial anatomy of citipati osmolskae
(Theropoda, Oviraptorosauria), and a reinterpretation of the holotype of Oviraptor philoceratops. American Museum Novitates3364, 1-24.
Colbert, E. H.(1946). The Eustachian tubes in the Crocodilia. Copeia1946, 12-14.
Coles, R. B. and Guppy, A.(1986). Biophysical aspects of directional hearing in the
tammar wallaby, Macropus eugenii. J. Exp. Biol.121, 371-394.
Currie, P. J. and Zhao, X.-J. (1993). A new troodontid (Dinosauria, Theropoda)
braincase from the Dinosaur Park Formation (Campanian) of Alberta. Can. J. Earth Sci.30, 2231-2247.
Day, M. L., Koka, K. and Delgutte, B.(2012). Neural encoding of sound source
location in the presence of a concurrent, spatially separated source. J. Neurophysiol.
108, 2612-2628.
Dinets, V. (2013). Underwater sound locating capability in the American alligator
(Alligator mississippiensis). J. Herpetol.47,521-523.
Duda, R. O. and Martens, W. L.(1998). Range dependence of the response of a
spherical head model. J. Acoust. Soc. Am.104, 3048-3058.
Feng, A. S.(1980). Directional characteristics of the acoustic receiver of the leopard
frog (Rana pipiens): a study of eighth nerve auditory responses. J. Acoust. Soc. Am.
68, 1107-1114.
Feng, A. S. and Christensen-Dalsgaard, J.(2008). Interconnections between the
ears in non-mammalian vertebrates. In The Senses: A Comprehensive Reference (ed. A. I. Basbaum, A. Kaneko, G. M. Shepherd, and G. Westheimer), pp. 217-224. San Diego, CA: Elsevier.
Feng, A. S. and Shofner, W. P. (1981). Peripheral basis of sound localization in
anurans. Acoustic properties of the frog’s ear. Hear. Res.5, 201-216.
Firzlaff, U. and Schuller, G.(2003). Spectral directionality of the external ear of the
lesser spear-nosed bat, Phyllostomus discolor. Hear. Res.181, 27-39.
Fletcher, N. H. and Thwaites, S.(1979). Acoustical analysis of the auditory system of
the cricket Teleogryllus commodus(Walker). J. Acoust. Soc. Am.66, 350-357.
Fuzessery, Z. M.(1996). Monaural and binaural spectral cues created by the external
ears of the pallid bat. Hear. Res.95, 1-17.
Garrick, L. D. and Lang, J. W.(1977). Social signals and behaviors of adult alligators
and crocodiles. Am. Zool.17, 225-239.
Gleich, O., Dooling, R. J. and Manley, G. A.(2005). Audiogram, body mass, and
basilar papilla length: correlations in birds and predictions for extinct archosaurs. Naturwissenschaften92, 595-598.
Grothe, B., Pecka, M. and McAlpine, D.(2010). Mechanisms of sound localization in
mammals. Physiol. Rev.90, 983-1012.
Guppy, A. and Coles, R. B.(1988). Acoustical and neural aspects of hearing in the
Australian gleaning bats, Macroderma gigas and Nyctophilus gouldi. J. Comp. Physiol. A162, 653-668.
Hafter, E. R.(1984). Spatial hearing and the duplex theory: how viable is the model. In
Dynamic Aspects of Neocortical Function.(ed. G. M. Edelman, E. W. Gall and W. M. Cowan), pp. 425-448. New York, NY: John Wiley and Sons.
Harper, N. S. and McAlpine, D. (2004). Optimal neural population coding of an
auditory spatial cue. Nature430, 682-686.
Harrison, J. M. and Downey, P.(1970). Intensity changes at the ear as a function of
The Journal of Experimental Biology
Hausmann, L., von Campenhausen, M., Endler, F., Singheiser, M. and Wagner, H.(2009). Improvements of sound localization abilities by the facial ruff of the barn owl (Tyto alba) as demonstrated by virtual ruff removal. PLoS ONE4, e7721.
Higgs, D. M., Brittan-Powell, E. F., Soares, D., Souza, M. J., Carr, C. E., Dooling, R.
J. and Popper, A. N. (2002). Amphibious auditory responses of the American
alligator (Alligator mississipiensis). J. Comp. Physiol. A188, 217-223.
Hill, K. G., Lewis, D. B., Hutchings, M. E. and Coles, R. B.(1980). Directional
hearing in the Japanese quail (Coturnix coturnix japonica): I. Acoustic properties of the auditory system. J. Exp. Biol.86, 135-151.
Hunt, R. H. and Watanabe, M. E.(1982). Observations on maternal behavior of the
American alligator, Alligator mississippiensis. J. Herpetol.16, 235-239.
Hyson, R. L., Overholt, E. M. and Lippe, W. R.(1994). Cochlear microphonic
measurements of interaural time differences in the chick. Hear. Res.81, 109-118.
Janke, A. and Arnason, U.(1997). The complete mitochondrial genome of Alligator
mississippiensis and the separation between recent archosauria (birds and crocodiles). Mol. Biol. Evol.14, 1266-1272.
Jewett, D. L., Romano, M. N. and Williston, J. S.(1970). Human auditory evoked
potentials: possible brain stem components detected on the scalp. Science167, 1517-1518.
Jørgensen, M. B., Schmitz, B. and Christensen-Dalsgaard, J.(1991). Biophysics of
directional hearing in the frog Eleutherodactylus coqui. J. Comp. Physiol. A168, 223-232.
Klump, G. M.(2000). Sound localization in birds. In Comparative Hearing: Birds and
Reptiles(ed. R. J. Dooling, R. R. Fay and A. N. Popper), pp. 249-307. New York, NY: Springer.
Klump, G. M. and Larsen, O. N.(1992). Azimuthal sound localization in the European
starling (Sturnus vulgaris): I. Physical binaural cues. J. Comp. Physiol. A170, 243-251.
Koay, G., Kearns, D., Heffner, H. E. and Heffner, R. S.(1998). Passive
sound-localization ability of the big brown bat (Eptesicus fuscus). Hear. Res.119, 37-48.
Koka, K., Read, H. L. and Tollin, D. J.(2008). The acoustical cues to sound location
in the rat: measurements of directional transfer functions. J. Acoust. Soc. Am.123, 4297-4309.
Koka, K., Jones, H. G., Thornton, J. L., Lupo, J. E. and Tollin, D. J.(2011). Sound
pressure transformations by the head and pinnae of the adult chinchilla (Chinchilla lanigera). Hear. Res.272, 135-147.
Köppl, C.(2009). Evolution of sound localisation in land vertebrates. Curr. Biol.19,
R635-R639.
Köppl, C. and Carr, C. E.(2008). Maps of interaural time difference in the chicken’s
brainstem nucleus laminaris. Biol. Cybern.98, 541-559.
Köppl, C. and Gleich, O.(2007). Evoked cochlear potentials in the barn owl. J. Comp.
Physiol. A193, 601-612.
Kuhn, G. F.(1977). Model for the interaural time differences in the azimuthal plane. J.
Acoust. Soc. Am.62, 157.
Kundrát, M. and Janáček, J.(2007). Cranial pneumatization and auditory perceptions
of the oviraptorid dinosaur Conchoraptor gracilis(Theropoda, Maniraptora) from the Late Cretaceous of Mongolia. Naturwissenschaften94, 769-778.
Larsen, O. N., Dooling, R. J. and Michelsen, A.(2006). The role of pressure
difference reception in the directional hearing of budgerigars (Melopsittacus undulatus). J. Comp. Physiol. A192, 1063-1072.
Lombard, R. E. and Bolt, J. R.(1979). Evolution of the tetrapod ear – analysis and
reinterpretation. Biol. J. Linn. Soc. Lond.11, 19-76.
Lupo, J. E., Koka, K., Thornton, J. L. and Tollin, D. J.(2011). The effects of
experimentally induced conductive hearing loss on spectral and temporal aspects of sound transmission through the ear. Hear. Res.272, 30-41.
Macpherson, E. A. and Middlebrooks, J. C.(2002). Listener weighting of cues for
lateral angle: the duplex theory of sound localization revisited. J. Acoust. Soc. Am.
111, 2219-2236.
Maki, K. and Furukawa, S.(2005). Acoustical cues for sound localization by the
Mongolian gerbil, Meriones unguiculatus. J. Acous