Solar-Electric Boat
Giuseppe Schirripa Spagnolo, Donato Papalillo, Andrea Martocchia, Giuseppe Makary
Department of Electronic Engineering, University “Roma Tre”, Roma, Italy Email: [email protected]
Received February 4, 2012; revised March 2, 2012; accepted March 15, 2012
ABSTRACT
The aim of this paper is the design of a Solar-Electric Boat for tourists’ transport along the coast, in the rivers, in the lakes. Our idea is to define the project guidelines for the realization of a zero impact boat. This paper illustrates the practical new technologies (naval architecture small craft design, mechanical and electrical design), rational design and engineering approach, safety and reliability methods used in solar boats. In our project, the boat is powered by lith- ium-ion batteries that can be charged at any time by the photovoltaic generator placed on a flat top structure. The pro- ject is designed for brief trip around coast, where the public transport becomes very polluting during summer. Starting from the consideration that this boat is used during sunny weather, it is possible to know the boat’s energy demand and proceed with the design of a suitable electric boat and of the energy storage/management system. It is also proposed an innovative management of charge/discharge of the batteries. With this management, we have optimized the use and prolonged the time of life of the batteries during the navigation and the control of the real autonomy of it.
Keywords: Solar-Electric Ship; Electric Propulsion; Photovoltaic; Lithium-Ion Batteries
1. Introduction
Many protected areas in the world are facing the growth of tourism pressure; the same problem is present in the areas of naturalistic interest. Tourism is seen as a viable financial option for protected areas with the tourism concessions, through private sector partnerships, that per- mitted to gaining momentum and that allows the over- arching goal of preservation and conservation to remain with the state. However, without appropriate planning or best practices in place, tourism concessions can lead to such problems as waste, habitat destruction and the dis- placement of local people and wildlife. In other words, tourism brings economic benefits to countries, but there are usually substantial socio-economic and environmen- tal costs associated with it. The inherent conflict between protecting ecosystems and cultural heritage on one hand and providing public use programs and related infra- structure and visitor services in protected natural and cultural areas on the other hand is as old as the modern conservation movement [1]. Similar problems exist with the tourism on coastal environments [2].
Tourists’ transport along the coast, in the rivers, in the lakes, can be performed on route well-defined and car- ried out with boats that sail at low speed. Therefore, starting from the design of a hull that minimizes the drag, In this paper it will be illustrate a “system” for tourist navigation with an “exclusively” electric boat propelled [3-5]. The ship is powered by direct solar energy. Our
boat uses solar cells that transform the solar energy into electrical energy, which is stored temporarily in lith- ium-ion batteries, and used to drive the boat through electric motors (permanent magnet synchronous motors) and drive systems [6,7]; electric propulsion offers effect- tive maneuverability, precise and smooth speed control, reduced engine room, low noise and low pollution rates.
Solar-electric boats are recommended solution for tourist navigation in areas where combustion engines are prohibited (lake, protected areas, etc.).
Actually many solar-electric boats are available [8-10], unfortunately these boats have a sporadic use.
This paper wants to represent a base to design a so- lar-electric boat. It desires to be a reference for control- ling of the charge-discharge batteries and for checking the real autonomy of navigation.
2. Ship Environment
2.1. The Catamaran
For our project we consider a ship with the following characteristics.
Catamaran
Maximum speed: 15 km/h (~8 kts) Cruising range: 5 hours
Length over all: 14.00 m Width: 5.50 m
The ship is equipped with two 8 kW permanent magnet synchronous motors;
Normal cruising speeds equal to 8 km/h (~4 kts); Boat travels for about 200 days per year (about 1000
hours of navigation for year);
Average electrical power required during the cruise 11 kW (average electrical energy consumption for year 11 MWh).
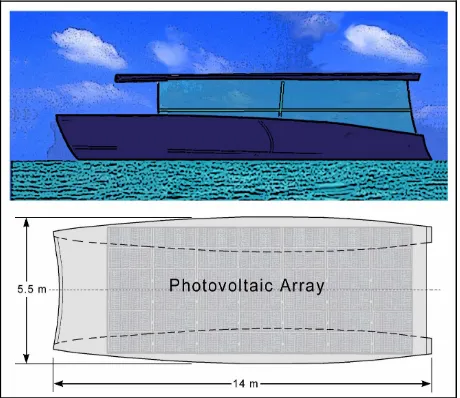
Not all ships are suitable targets for the integration with photovoltaic generating system. A solar-electric ship must have sufficient deck space. For the project we have chosen a catamaran. In our boat a flat top structure is proposed (see Figure 1) in order to maximize the area available for putting up a photovoltaic array.
2.2. Batteries
For our ship, we assume that the average electrical power necessary during the cruise is 11 kW and the maximum peak power is 22 kW.
To get a system that can ensure a reliable transport, we must assume that the energy, used during the cruise (5 h), must be entirely taken from the batteries; for designing in safety, we have to hypothesize that the photovoltaic sys- tem doesn’t supply energy. Therefore, the daily energy consumption that the batteries have to provide is equal to the average power (11 kW) for half cruise time (2.5 hours), while in the other half, we consider an emergency situation during which, is required the maximum power (22 kW) to ensure the fastest return journey to the harbor. With all these hypotheses, the total storage battery ca- pacity has to be >82 kWh. Figure 2 shows the electrical load during a typical day without return in emergency.
[image:2.595.309.537.85.209.2]Furthermore, we have to hypothesize the necessity to charge the batteries during the docking time. To fulfill
[image:2.595.308.538.297.433.2]Figure 1. Caramaran boat and available area for photo- voltaic array.
Figure 2. Daily load.
this task, an access to the industrial grid connection (400 V), on the pier, is necessary. Rectifying the grid tension is possible to ensure an effective DC voltage of 550 V.
For our project, we have chosen the batteries Valence U27-36XP model.
Specifications ofBattery model U27-36XP
Voltage (Vo) 38.4 V
Normal Capacity 45 Ah
Weight 19.6 kg
Dimension 306 × 172 × 225 mm
Standard discharge (Vcoff , Id) 30 V, 90 A
Standard charge (Vch, Ich) 43.8 V , 45 A
DC internal resistance 25 mΩ
If, we consider a system structure of four battery banks (BM1, BM2, BM3 and BM4), as mentioned earlier, the BMx bank must be compatible with the charging voltage
of 550V, so we need a series of N batteries:
Batt 550 ch 13
N V
Bus o Batt
DC V N 499
The maximum necessary current for a return in emer- gency of the boat is:
Bus
22 kW/DC 44 A.
In conclusion we have considered a system made by 52 batteries (four battery banks), with these features: Total weight: 52 × 19.6 kg ≈ 1020 kg
Volume: 0.306 × 0.172 × 0.225 × 52 ≈ 0.6 m3 Maximum electrical energy storage ≈ 90 MWh.
[image:2.595.58.288.511.710.2]pending on the assumptions of fuel, or the same. Not surprisingly, since the technology is not being manufac- tured in high volume, the first cost of the electric system, including installation is higher than the equivalent diesel one, for about 30%, but it must be considered that prices are very likely to come down with time.
Another advantage of the electric system is to have “instant power”. There is no need to wait for the engine to warm up; there is no gearbox to engage, it’s sufficient to turn on and go. Instant reverse is available too; one can go from full power forward to full reverse in an in- stant for a very abrupt emergency stop.
2.3. Photovoltaic Generating System
In our boat the area available for laing a photovoltaic array is about 55 m2. On this area, it is possible to install 42 Sanyo’s HIT Power 225 A solar module; every single panel has a dimensions of 1.580 mm × 798 mm × 46 mm, Maximum Power Voltage (Vmp) 43.4 V, Maximum
Power Current (Imp) 5.21 A, which leads to a Maximum
Output Power (WPmax) 225 W in Standard Test Condi- tions.
We configure the connection of the panels in this way: 6 strings of 7 panels in series, providing an output maximum power voltage of 304 V, and maximum power current of 31.26 A.
The yearly average electrical energy from photovoltaic array is given by the following equation
DC m N 1 2 3 4
P Q W K K K K (1)
PDC is the photovoltaic energy [kWh/year].
WN is the photovoltaic array energy output at
stan-dard radiation; in our case:
max max
0.225 kWP 42 panels 9.450 kW P .
Qm is the yearly average flux of solar radiation; in this work we consider a global horizontal irradiation of 1500 kWh/m2/year.
K1 is a coefficient for compensating temperature effect. Operating temperature increases when module where placed in the sun. When operating temperature increases, power output decreases (due to the proper- ties of the conversion material—this is true for all so- lar modules). For our photovoltaic panel K10.9 is
a good approximation.
K2 is the coefficient that take account of the stain and wear, factor that worsen with the passage of time. A typical value of K2 can be estimated with 0.96. K3 is the coefficient that take account of DC circuit
losses. Typical solar electric systems require more than one module to be connected to another one. The wires used to connect the modules create a slight re- sistance in the electrical flow, that decrease the total power output of the system, similar to low pressure
water flowing through a long water hose. In addition, slight differences in power output from module-to- module reduce the maximum power output available from each module. A typical value of the losses is 0.95.
K4 is the coefficient that take account of the losses of the DC-DC converter, in order to be converted for the DC power from the solar modules to the usable one (battery charge, motors, etc.). The conversion DC-DC decreases approximately of 0.95.
With these considerations, the energy from our 42 Sanyo’s HIT Power 225 A solar module will be about 11 MWh; the photovoltaic array is able to furnish all the energy necessary to the navigation. In other words, the boat is driven by two electric motors powered “exclu- sively” with rechargeable batteries. The energy stored in the batteries derives through renewable energy sources. The photovoltaic array is sized to provide, on average in a year, all the energy required by the boat.
The boat is grid connected to a harbor; it can put in grid the energy produced in excess and to furnish, when necessary, the energy for the recharge of the batteries.
3. Power Management System (PMS)
The PMS is used for the right managing of the energy aboard. Our idea is to provide the master with the real autonomy of navigation and the real power from the bat- tery.
[image:3.595.323.523.584.717.2]In our system, a storage device (battery bank) is used for balancing the mismatch between the available energy by the photovoltaic array and power required by motors and ship instruments. Both the powers that flow in and out of the storage device have to be designed accurately and controlled for a global energy management strategy. In particular, since the lithium-ion batteries decrease the storage capacity with aging, is not possible for the cap- tain to know the instant energy available for the naviga- tion, by measuring the output voltage of the battery.
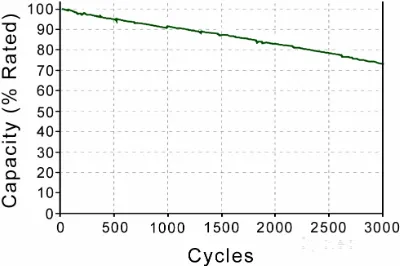
Figure 3 shows the battery capacity changes with the charge/discharge cycles.
For a safety and reliable navigation, it is necessary to know the real autonomy of navigation, which means to know the real energy storage within the battery banks.
[image:4.595.79.262.190.720.2] [image:4.595.312.535.534.709.2]It is often important in fact to provide accurate infor- mation regarding the remaining capacity of the battery. Some batteries provide a “fuel gauge” that gives an indi- cation of the charge level of the battery [11].
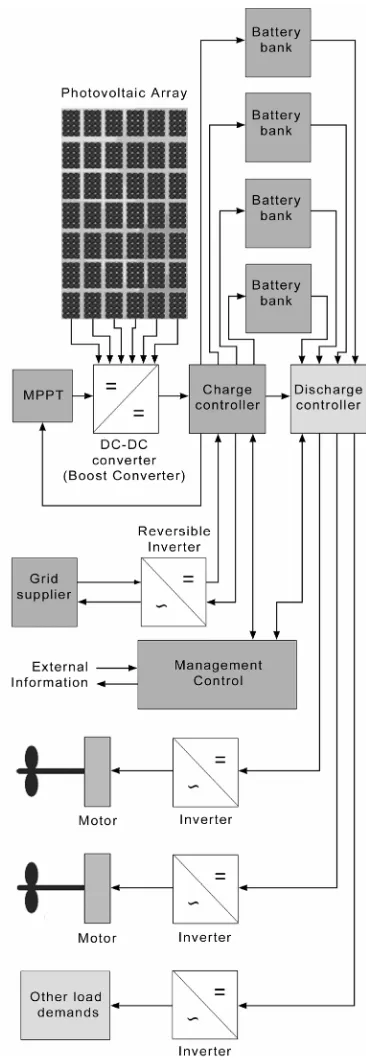
Figure 4 shows the setup of solar-electric boat. The
Figure 4. Topology of solar-electric boat.
proposed system is composed by a photovoltaic array, four battery banks, a boost converter, a reversible in- verter, three inverters, a charge control, a discharge con- trol, and a computer to manage the energy flows (energy management controller).
In our system, the maximum necessary current is about 44 A. This current can be supplied by a single battery bank for one hour. Our chosen battery can be fully dis- charged without damage [12]. To know the real stored energy, we fully discharge a package of batteries. Sub- sequently, the energy for the load it is provided by an- other package of batteries. In this way, while a battery bank supplies the necessary power, the discharged bat- teries are under charge by the photovoltaic array or by the grid. Measuring the energy flow toward the batteries and from the batteries, cycle for cycle, it is possible to determine the real stored energy.
3.1. Photovoltaic MPPT Control
MPPT control technology is widely used in the applica- tion of solar power generation [13]. As shown in Figure 5, the output voltage of photovoltaic array can be deter- mined in such way that the corresponding power is the maximum out-power. If the working point is on the left of the maximum power point: d dP V 0; and if the
working point is on the right of the maximum power point: d dP V 0.
According the characteristics of Figure 5, the control process of the perturb and observe method is that: First, set up a photovoltaic array operation voltage, then gener- ate some periodic disturbance to the photovoltaic cell by adjusting the duty cycle of the boost converter, then compare the photovoltaic output power with the previous one, if the output power increases, that means it works on the left of maximum power point, and we should con- tinue to maintain the disturbance direction to increase the
output voltage; otherwise, if the output power decreases, that means it works on the right of the maximum power point, the disturbance direction will be away from the maximum power point, thus it should change the distur- bance direction to decrease the output voltage of photo- voltaic array. When the cycle is complete the system is adjust, so finally, the maximum power point will be found [14].
3.2. Charge and Discharge Controllers
Charge controller, through the information received by the management control, sends the energy that comes from the photovoltaic array, to the fully discharged bat- tery bank. During the charge process, charge controller measures the flow of incoming energy in the battery bank. When the battery bank is completely charged, the energy flow is sent to another fully discharged battery bank. In the eventuality that there are no fully discharged battery banks the energy flow is sent to the loads through the discharge controller; in alternative, the energy flow is sent to the grid if it is connected. The discharge control carries to discharge fully a single battery bank at a time. During the discharge process the discharge control measures the energy flow and management control com- pares this with one memorized during the preceding charge. Through this comparison is possible to establish the aging of the battery and to determine the real storable energy.
3.3. Management Control
The principal assignment of the management control system is to determine the real available energy for the navigation and to furnish information on the ship auton- omy. To realize this assignment, the system preserves information of the flows of energy and manages the complete discharge/charge of the battery banks.
The performances of all electrical systems are moni- tored by the management control. It manages the dis- charge of the single battery bank one at a time. With this management strategy we check the battery life and limit the number of charge/discharge. In our system, the sizing of battery capacity has been select in such a way that, with an opportune control, at most only one cycle of charge/discharge could be done during the navigation. Considering that our batteries bear 2000 complete dis- charges with a loss within the 20% (see Figure 3), the time life of the batteries will be greater than 10 years.
4. Conclusions
The design of a Solar-Electric Boat for tourists’ transport along the coast, in the rivers, in the lakes has been pre- sented. With our system, it is possible to replace the standard fuel engine with an electric one, by accepting a
loss in power, and without changing the weight and the dimension of the boat.
Our boat has greater price in comparison to an equiva- lent boat equipped with traditional propulsion. Currently to manufacture a solar-electric boat there are extra cost due to photovoltaic plant, battery bank and management control system. These additional costs are partially com- pensated by reduction of operation costs; in solar-electric boat there is no consumption of fuel and the costs of maintenances are relatively lower. In our boat, the initial additional cost is about of 50,000$. On the other hand, the annual saving on the exercise is estimable in 5000$; within ten years the extras costs are amortized. Besides, the great advantage of the use of renewable energy pro- duces indirect socio-economic advantages; ecosystem preservation, reduction of CO2, NOx and SOx emission,
etc.
In this paper we have proposed an innovative man- agement of charge/discharge for battery. With this man- agement, we have optimized the batteries life, and during the navigation we have a real time control of the naviga- tion autonomy. Besides we have designed ship with zero pollution and very low running costs; all the necessary energy for the navigation has origin by renewable.
Electricity produced by photovoltaic is safer and more environmentally benign than conventional sources of energy production. However, there is environmental, safety, and health issues associated with manufacturing, using, and disposing of photovoltaic equipment. The manufacturing of electronic equipment is energy inten- sive.
The electricity produced is higher than the one neces- sary to manufacture the photovoltaic modules and the energy break-even point is usually reached in a period from three to six years.
REFERENCES
[1] M. Wyman, J. R. Barborak, N. Inamdar and T. “Stein, Best Practices for Tourism Concessions in Protected Areas: A Review of the Field,” Forests, Vol. 2, No. 4, 2011, pp. 913-928. doi:10.3390/f2040913
[2] J. Davenport and J. L. Davenport, “The Impact of Tour- ism and Personal Leisure Transport on Coastal Environ-ments: A Review Estuarine,” Coastal and Shelf Science, Vol. 67, No. 1-2, 2006, pp. 280-292.
doi:10.1016/j.ecss.2005.11.026
[3] J. L. F. Soto, R. G. Seijo, J. A. Formoso, G. Iglesias and L. C. Couce, “Alternative Sources of Energy in Shipping,” Journal of Navigation, Vol. 63, No. 1-2, 2010, pp. 435- 448. doi:10.1017/S0373463310000111
[4] K. Hochkirch and V. Bertram, “Options for Fuel Saving for Ships,” Mare Forum 2010: Maritime Transportation of Energy, Houston, 19 February 2010.
“Eco friendly Electric Propulsion Boat,” 10th Interna-tional. Conference on Environment and Electrical Engi-neering, Rome, 8-11 May 2011, pp. 1-4.
doi:10.1109/EEEIC.2011.5874699
[6] P. Letellier, “High Power Permanent Magnet Machines for Electric Propulsion Drives,” Proceedings of 3rd Interna-tional Symposium on All Electric Ship, Paris, 27 October 2000, pp. 126-132.
[7] F. Gieras and M. Wing, “Permanent Magnet Motor Technology,” Marcel Dekker Inc., New York, 1997. [8] S. D. Sudhoff, “Currents of Change Electric Ship
Propul-sion Systems,” IEEE Power & Energy Magazine, Vol. 9, No. 4, 2011, pp. 30-37. doi:10.1109/MPE.2011.941319 [9] http://oceanshaker.com/2010/07/07/suncat-46-the-first-ser
ial-luxury-catamaran-powered-by-100-solar-energy [10] http://www.solarnavigator.net/transatlantic_21.htm [11] R. A. Dunstan, “Smart Battery Providing Battery Life and
Recharge Time Prediction,” US Patent No. 5565759, 1996.
[12] M. C. Smart, B. V. Ratnakumar, K. B. Chin, L. D. Whit-canack, E. D. Davies, S. Surampudi, M. A. Manzo and P. J. Dalton, “Lithium-Ion Cell Technology Demonstration for Future NASA,” 37th Intersociety Energy Conversion En-gineering Conference 2002, Washington DC, 29-31 July 2002, pp. 297-304. doi:10.1109/IECEC.2002.1392029 [13] X. Weidong, N. Ozog and W. G. Dunford, “Topology Study
of Photovoltaic Interface for Maximum Power Point Tracking,” IEEE Transactions on Industrial Electronics, Vol. 42, No. 3, 2007, pp. 1696-1704.
doi:10.1109/TIE.2007.894732