ISSN Online: 2151-4844 ISSN Print: 2151-481X
DOI: 10.4236/sgre.2018.912018 Dec. 29, 2018 285 Smart Grid and Renewable Energy
Improvement of the Silicon Solar Cell
Performance by Integration of an Electric Field
Source in the Solar Cell or Solar Module System
Adama Ouedraogo
1,2*, Serge Dimitri Y. B. Bazyomo
2, Salifou Ouedraogo
2, Abdoul Razakou
1,
Dieudonné Joseph Bathiebo
21National Authority for Radiation Protection and Nuclear Safety, Ministry of Environment of Burkina Faso, Ouagadougou,
Burkina Faso
2Laboratory of Thermal and Renewable Energies, Department of Physics, Unit of Training and Research in Pure and Applied
Sciences, University of Ouaga 1 Prof. Joseph KI-ZERBO, Ouagadougou, Burkina Faso
Abstract
This manuscript is about a theoretical modelling of conversion efficiency im-provement of a typical polycrystalline Si solar cell in 1D assumptions. The improvement is brought by the increase of the collection of the minority car-riers charge in excess. This increase is the consequence of the influence of an electric field provided by the use of the open circuit photovoltage of another silicon solar cell. We assume that it is integrated two silicon solar cells to the system. The first solar cell provides the open circuit photovoltage which is connected to two aluminum planar armatures creating a planar capacitor. The second solar cell is placed under the uniform electric field created be-tween the two aluminum armatures. This work has shown an improvement of the output electric power leading to the increase of the conversion effi-ciency. We observe an increase of 0.7% of the conversion efficiency of the second silicon solar cell.
Keywords
Open Circuit Photovoltage, Planar Capacitor, Electric Field, Conversion Efficiency, Monochromatic Illumination and Silicon Solar Cell
1. Introduction
The photovoltaic energy presents
more opportunities to energy access by its easy implementation. Since the first solar cell presented by Bell Laboratory in 1954 [1], the solar cell has known a lot of improvements. After, the conventionalHow to cite this paper: Ouedraogo, A., Bazyomo, S.D.Y.B., Ouedraogo, S., Raza-kou, A. and Bathiebo, D.J. (2018) Im-provement of the Silicon Solar Cell Per-formance by Integration of an Electric Field Source in the Solar Cell or Solar Module System. Smart Grid and Renewable Energy, 9, 285-298.
https://doi.org/10.4236/sgre.2018.912018
Received: November 23, 2018 Accepted: December 25, 2018 Published: December 29, 2018
Copyright © 2018 by authors and Scientific Research Publishing Inc. This work is licensed under the Creative Commons Attribution International License (CC BY 4.0).
DOI: 10.4236/sgre.2018.912018 286 Smart Grid and Renewable Energy
DOI: 10.4236/sgre.2018.912018 287 Smart Grid and Renewable Energy
of the source of generation of the electric field in the photovoltaic device. This integration can reduce the amount of material used. We propose in the present paper, a planar capacitor created to integrate the production source of the elec-tric field in the solar cell or solar module system. This integration of the elecelec-tric field source in the solar cell can bring the increase of the conversion efficiency and can reduce the use of the semiconductor mater’s quantity. One-dimension (1D) approach (following only x axe photogeneration of the minority carriers in excess) is used to develop theoretically the modelling of this integration and to observe the behavior of the photocurrent, the photovoltage, the electric power and the conversion efficiency. For the next, the first section will give the me-thods and the different theories. The second section will present the results and the discussion. The last section of this work will provide the conclusion of the effect of this integration of the electrical source on the second solar cell perfor-mances.
2. Theory
2.1. Creation of the Electrical Field
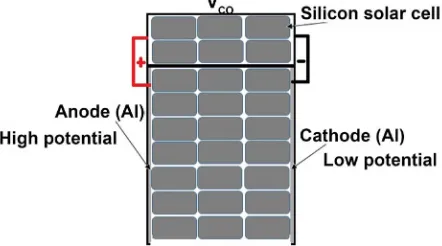
The electric field is created using the planar capacitor principle. Two aluminum conductors are used to be connected to the first silicon solar cells as presented on the Figure 1.
The both aluminum conductors connected to the first solar cells become the cathode and the anode of the planar capacitor. When the external solar cells are illuminated, they give the open circuit photovoltage expressed by the Equation (1) [16].
( )
0
lim
f
CO S ph f
V = → V S (1)
where V Sph
( )
f in Volt (V) depending of the junction dynamic velocity (Sf )in cm∙s−1, is the photovoltage given by the first solar cells.
f
S will be defined in the next. By this open circuit photovoltage, the electric field is created in the va-cuum (air) presents between both aluminum conductors. The first solar cells are kept only in open circuit state. It has not contribution in the photocurrent and photovoltage of the final system. The main role of the fist solar cells is to provide the electrical field. The expression of this electric field is:
( )
, n VCOE d n d
×
= (2)
where d(cm) is the distance between the both aluminum conductors, n the numbers of the solar cells used to create the electric field and E(d, n) in V.m−1
the electrical field depending of the distance d(cm), of the number of the solar cells and of the different intrinsic parameters of the solar cell. The Figure 2 illu-strates a schematic representation of the installation of the silicon solar cells un-der the uniform electrical field created between the both aluminum conductors.
DOI: 10.4236/sgre.2018.912018 288 Smart Grid and Renewable Energy
Figure 1. Integration of the electrical field production source into so-lar cell or soso-lar module.
Figure 2. Installation of solar cells under uniform electrical field.
aluminum conductors is chosen for the kind where the internal electric field between p-n junction and external electrical field will give a resulting component. This assumption is based on the study developed by Zerbo et al.[10] about elec-tromagnetic field. One solar cell will be placed between the two aluminum con-ductors for one solar cell chosen for the creation of the external electric field. To solve the illumination problem of the solar cell and to avoid the perpendicularity between internal electrical field of the space charge region and external electrical field created, the height of the anode will be greater than the height of the ca-thode. It will be added a tilt of the solar cell between anode and caca-thode. These all means will put an angle between the both electrical fields. The variation of this angle allows to choose a better position giving an optimum output of the second solar cell. Some other work will study the real quantity of external elec-trical field which will influence the second solar cell. In the present work it will be assumed that the external electrical field which will be provided to the solar cells between anode and cathode will be optimum. The following subsection is going to provide the calculations of the density of the photocurrent, the photo-voltage and the electric power.
[image:4.595.264.485.271.394.2]alu-DOI: 10.4236/sgre.2018.912018 289 Smart Grid and Renewable Energy
minum conductors are obtained by solving of the transport equation of the ex-ceeding minority carriers. It is given by the Equation (3) [17]
( )
( )
n =eDn⋅
δ
x e+ ⋅µ
n⋅δ
xJ grad E (3)
(
cm s2)
n
D ⋅ − is the electron diffusion coefficient,
(
cm V s2 1 1)
nµ ⋅ − ⋅ − is the
electron mobility coefficient caused by the electrical field E, e is the electronic charge and
δ
( )
x in cm−3 which is the density of the exceeding minoritycarri-ers charge. This equation is solved in 1D approach. The assumptions of the 1D theory are described by Zerbo et al.[18], Zerbo et al. (2014) [8] and Zoungrana
et al. (2012) [12]. The resolution of this equation allows to find the different components of the Equation (3) [8][18]. The equation 3 leads to the calculation of the equation of conservation of exceeding minority carriers charge called con-tinuity equation presented in the Equation (4) [7]. This equation is calculated for the structure of the polycrystalline silicon solar cell considered as n+− −p p+
[8].
( )
1( )
( )
( )
n n n
x div G x R x
t e
δ ∂
= + −
∂ J (4)
With G xn
( )
in carriers∙s−1∙cm−3 giving the exceeding minority carrierscharge generation rate. To analyze the influence of the different light, this study will be done under the monochromatic illumination. R xn
( )
in carriers∙s−1∙cm−3is the exceeding minority carriers charge recombination rate after the genera-tion.
( )
( )
n n
G x R x− provides the quantity of the exceeding minority carriers charge which are conserved during the cross of the solar cell junction without being recombined [7]. The expression of the recombination rate is given by
( )
( )
n x
R x δ
τ
= [19].
This study is led under monochromatic illumination because this illumination allows to evaluate the effect of any light wavelength where photovoltaic conver-sion takes place only between 0.4 μm - 1.1 μm. The expresconver-sion of G xn
( )
formonochromatic illumination is given by Mathieu H. [7] and Moliton A. [6].
( )
( )
( )
( )0 1 e x
n
G x =α λ φ −ρ λ −α λ
(5)
( )
α λ
andρ λ
( )
are respectively absorption and reflection coefficient at the wavelengthλ
( )
µm and(
2)
0 W m
φ ⋅ − is the incident photon flux. The
mo-nochromatic illumination parameters are provided by Green M. A. (2008) [20]. This work is realized in steady state conditions, the carriers charge density is not function of the time. Then,
( )
0t x δ ∂
∂ = . Defining δ(x) as the exceeding minority
carriers charge at x position which across the p n− + junction of the solar cell,
the relevant differential equation is simple.
( )
( )
( )
( )
2
2 n 2 n
n n n
x E x x G x
D x D
x L
δ µ δ δ
∂ ∂
+ − = −
∂
DOI: 10.4236/sgre.2018.912018 290 Smart Grid and Renewable Energy
With Ln the minority carrier length. The solution of Equation (6) is the sum of
two members as shown by the Equation (7)
( )
x O( )
x I( )
xδ
=δ
+δ
(7)where
δ
O( )
x is the density of minority carriers charge in excess for a solar cellat obscurity because it is calculated without illumination and its expression is
( )
e x cosh( )
sinh( )
O x β A x B x
δ = γ + γ . With A and B are found by the solar cell
boundaries conditions given by Zerbo et al. (2011, 2014) [8][18]: - At the solar cell p-n junction
( )
( )
0 0 n f x x D S x δ δ = = ∂∂ (8)
- At the rear face
( )
( )
n b x H D S x x H δ δ = = − ∂∂ (9)
where Sb provides the rear face recombination velocity. Sf gives the
expres-sion of the junction dynamic velocity. It is the sum of two contributions: Sf0
which is the intrinsic junction recombination velocity related to the losses of carriers at the junction interface and Sfj which is the junction dynamic
veloc-ity imposed by an external load resistance and defining the operating point of the cell [21][22][23], therefore Sf =Sf0 +Sfj. To carry out this study, the ideal
case will be assumed. Hence, Sf0 =0.
The second member of the Equation (7) is the contribution under solar illu-mination. Its expression is
( )
e ( )xI x k α λ
δ = − with
( )
( )
( )
2 0 2 2 1 1 n n n R L k D Lα λ φ λ
α λ − = − −
. The density of the carrier’s
minority in excess will be depending of the S Sf, , , ,b
λ
x d and the otherintrin-sic parameters of the silicon semi-conductor. The calculation of the exceeding minority carrier charge allows to find the electrical parameters. These electric parameters of the solar cells are presented in the next subsection.
2.3. Electrical Parameters for a Solar Cell under Electrical Field
The first electrical parameter of the silicon solar cell is the density of photocur-rent. By application of the Fick law, it is expressed as [8]:(
)
(
)
(
)
0
, , ,
, , , , f 0, , , ,
ph f n n f
b
b b
x
x S
J S e D E S
x
S d
S λ d δ λ µ δ S λ d
= ⋅ ⋅ ∂ = + ∂ (10)
The second electric parameter is the photovoltage which is expressed in Equa-tion (11) by applicaEqua-tion of the Boltzmann law [8].
(
)
(
)
0
, , , 0,
1
, , , ln f
ph T
b
f b
S S d
S
V S d V
n
λ
λ
= δ
+
DOI: 10.4236/sgre.2018.912018 291 Smart Grid and Renewable Energy
where VTis the thermal photovoltage. At T = 300 K, VT = 0.026 V, 0 2B i
N n
n
=
with 10 cm17 3
B
N = − , the doping level and 1.45 10 cm10 3
i
n = × − , the intrinsic
carriers’ density at thermal equilibrium. This subsection will finish by the elec-tric power which is the arithmetical multiplication between the density of pho-tocurrent and the photovoltage.
(
, , ,)
(
, , ,)
(
, , ,)
ph f Sb d ph f Sb ph f b
P S λ =V S λ d ×J S S λ d (12)
The maximum electric power is found by using the curves of the electric pow-er in function of the junction dynamic velocity obtained with Mathcad 15 soft-ware. The conversion efficiency is the ratio of the maximum electric power (
(
W m 2)
MPP
P ⋅ − ) by the incident power (
(
W m 2)
abP ⋅ − ) from solar illumination
absorbed in the base of the solar cell. The conversion efficiency for monochro-matic is expressed by the Equation (13) [7]
MPP
ab
P P
η= (13)
With ab
( )
0 1( )
R hc
P α λ φ λ
λ −
= where h=6.632 10 J s× −34 ⋅ is the Planck
constant and c= ×3 10 cm s10 ⋅ −1 is the vacuum light speed. The next section
will be concerned to the results and discussions of this work.
3. Results and Discussion
3.1. Evolution of the Electrical Field Created between Both
Conductors
The electrical field created between the both aluminum conductors is depending of solar wavelength, the distance between the cathode and the anode, the num-ber of the silicon solar cells which are using to create the open circuit voltage and the intrinsic parameters of the solar cell. The Figure 3 presents the behavior of the electrical field in function of the number of the silicon solar cells.
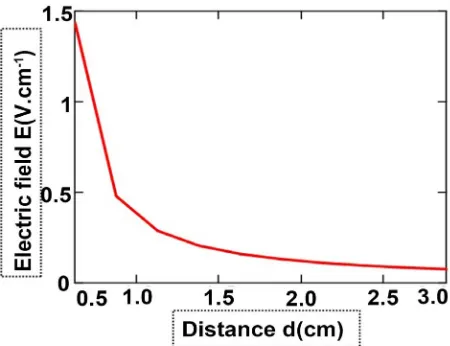
The electrical field increases for the increase of the solar cells number. In fact, the increase of the solar cells number causes the increase of the open circuit photovoltage. One of the purposes of this work is to provide an improvement of the conversion efficiency by reducing of the silicon matter. Consequently, the creation of the electrical field must use less solar cells reducing the semiconduc-tor matter used for the manufacture of the solar cells. The Figure 4 gives the evolution of the electrical field in function of the distance between the both alu-minum conductors.
DOI: 10.4236/sgre.2018.912018 292 Smart Grid and Renewable Energy
Figure 3. Electrical field in function of the silicon solar cells number. (λ = 0.70 μm, Sb = 104 cm∙s−1, Ln = 150 μm, Dn = 26
cm2∙s−1, μ
n = 1000 cm2∙V−1∙s−1).
Figure 4. Electrical field in function of the distances between anode and cathode. (λ = 0.70 μm, Sb = 104 cm∙s−1, Ln = 150
μm, Dn = 26 cm2∙s−1, μn = 1000 cm2∙V−1∙s−1, n = 1).
The evolution of the electric field in function of the solar illumination wave-length has the solar spectrum characteristic because of the solar illumination atmospheric absorption. The short wavelength causes more storage of the gen-erated electronic near the junction i.e. p side. Moreover, the electrical field is de-creasing with the increase of wavelength. Hence, to simulate the electrical field effect on the silicon solar cells installed into influence area of this electrical field, one solar cell is chosen for the illumination wavelength of 0.70 μm with the vari-ation of the distances. The following subsection will present the influence of the electrical field on one silicon solar cell’s electrical parameters in 1D approach.
[image:8.595.261.486.297.470.2]DOI: 10.4236/sgre.2018.912018 293 Smart Grid and Renewable Energy
Figure 5. Electrical field in function of the wavelengths of the solar illumination. (n = 1, Sb = 104 cm∙s−1, Ln = 150 μm, Dn =
26 cm2∙s−1, μ
n = 1000 cm2∙V−1∙s−1).
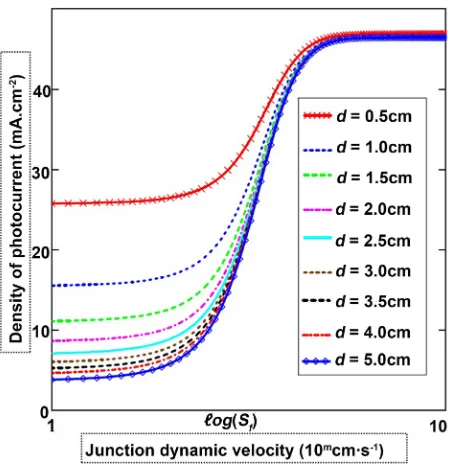
Figure 6. Photocurrent density in function of the dynamic junction velocity for different distances. (λ = 0.70 μm, Sb =
104 cm∙s−1, L
n = 150 μm, Dn = 26 cm2∙s−1, μn = 1000 cm2∙V−1∙s−1,
n = 1).
graphic representation of the density of photocurrent in function of the dynamic velocity and the variation of the distances.
[image:9.595.262.487.311.543.2]DOI: 10.4236/sgre.2018.912018 294 Smart Grid and Renewable Energy
operating point of the solar cell. The photocurrent at this state is improving also for the short distance i.e. for the high value of the electrical field. But the impor-tant value obtained at the open circuit state can cause the heating by Joule effect of the junction of the solar cell. It will be better to minimize this open circuit photocurrent which presents only the loss of the generated exceeding minority carriers at the junction. The photovoltage is represented on the Figure 7 in function of the junction dynamic velocity for different distances.
The photovoltage is greatest in the open circuit state. It decreases when the solar cell is operating in short circuit. The photovoltage is slightly insensitive to the electric field. But the values of the photovoltage is decreasing with the short distances between the both aluminum conductors. This reduction is the conse-quence of the crossing of the p - n junction by the surplus minority carriers. We observe that the increase of the photocurrent is more important than the de-crease of the photovoltage. The electric power is presented on the Figure 8 for different distances when the junction dynamic velocity varies.
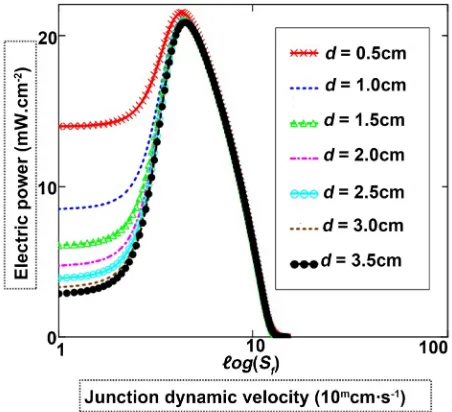
For the short circuit situation, the solar cell does not deliver the electric power. But for the open circuit situation there is an electric power. This power increases for the short distances between the both aluminum conductors. The electric power in open circuit causes the heating of the junction p-n of the solar cell by Joule effect. So, for this dispositive of improvement of the solar cell efficiency, the air free convection can be used to evacuate the heat coming from this open circuit electric power. Then, the maximum electric power (PMPP) is improving
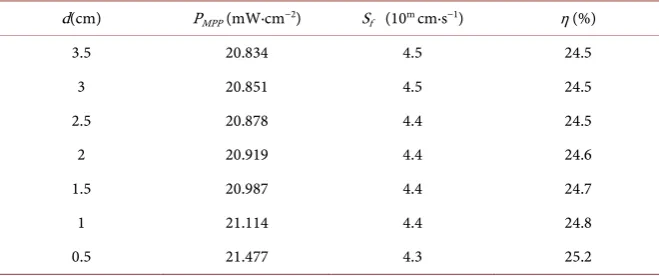
for the short distances. The Table 1 presents the PMPP collected from the Figure
8 and the conversion efficiency calculated using the Equation (11).
From 3.5 cm to 0.5 cm i.e. the electric field passes from 0.198 V∙cm−1 to 1.387
V∙cm−1, the electric power increases from 20.834 mW∙cm−2 to 21.477 mW∙cm−2
and the conversion efficiency increases from 24.5% to 25.2%. In experimental study, E. Serafettin [13] finds in red color wavelength of a monochromatic illu-mination that the open circuit voltage decreases with the increase of the electric field but the short circuit current does not change. However, we observe an in-crease of 0.7% about conversion efficiency. This efficiency is better improved compared at efficiency of the silicon polycrystalline solar cell which does not in-fluence by the electric field [7]. This increase can improve with the reduction of distance between the both aluminum conductors. It can also improve by the in-crease of the number of the solar cells used for the creation of the electrical field and choosing the good angle between internal and external electric fields. Moreover, the short distances values bring the operating point of the solar cell in vicinity of the open circuit state.
4. Conclusions
DOI: 10.4236/sgre.2018.912018 295 Smart Grid and Renewable Energy
Figure 7. Photovoltage in function of the dynamic junction velocity for different distances. (λ = 0.70 μm, Sb = 104 cm∙s−1, Ln
= 150 μm, Dn = 26 cm2∙s−1, μn = 1000 cm2∙V−1∙s−1, n = 1).
Figure 8. Electric power in function of the dynamic junction velocity for different distances. (λ = 0.70 μm, Sb = 104 cm∙s−1, Ln
= 150 μm, Dn = 26 cm2∙s−1, μn = 1000 cm2∙V−1∙s−1, n = 1).
[image:11.595.261.487.327.533.2]DOI: 10.4236/sgre.2018.912018 296 Smart Grid and Renewable Energy
Table 1. Conversion efficiency for different dynamic junction velocities and for different distances. (λ = 0.70 μm, Sb = 104 cm∙s−1, Ln = 150 μm, Dn = 26 cm2∙s−1, μn = 1000
cm2∙V−1∙s−1, n = 1).
d(cm) PMPP (mW∙cm−2) Sf (10m cm∙s−1) η (%)
3.5 20.834 4.5 24.5
3 20.851 4.5 24.5
2.5 20.878 4.4 24.5
2 20.919 4.4 24.6
1.5 20.987 4.4 24.7
1 21.114 4.4 24.8
0.5 21.477 4.3 25.2
the low-cost solar cells and solar modules. That is a contribution for develop-ing countries accessibility to the energy and a reduction of the global climate change.
Conflicts of Interest
The authors declare no conflicts of interest regarding the publication of this pa-per.
References
[1] Michaud, J.G. (2005) La fabuleuse histoire de l’nergie solaire. INCA Productions, Californie, E-U.
[2] Siert, P. (1979) Nouvelles techniques de réalisation de photopiles au silicium. Revue de Physique Appliquee, 14, 169-192.
https://doi.org/10.1051/rphysap:01979001401016900
[3] Green, A.M., Yoshihiro, H., Hishikawa, Y., Warta, W., Ewan, D.D., Dean, H.L., Jochen, H.E. and Anita, W.Y.H. (2017) Solar Cell Efficiency Tables (Version 50).
Progress in Photovoltaics: Research and Applications, 25, 668-676.
https://doi.org/10.1002/pip.2909
[4] Green, A.M., Yoshihiro, H., Hishikawa, Y., Warta, W., Ewan, D.D., Dean, H.L., Jochen, H.E. and Anita, W.Y.H. (2018) Solar Cell Efficiency Tables (Version 51).
Progress in Photovoltaics: Research and Applications, 26, 3-12.
https://doi.org/10.1002/pip.2978
[5] Priyanka, S. and Ravindra, N.M. (2012) Temperature Dependence of Solar Cell Performance—An Analysis. Solar Energy Materials & Solar Cells, 101, 36-45.
https://doi.org/10.1016/j.solmat.2012.02.019
[6] Moliton, A. (2009) Electronique et photo - électronique des matriaux et composants 2: Photo - electronique et composants. Hermes Science.
[7] Mathieu, H. and Fanet, H. (2009) Physique des semiconducteurs et des composants électroniques. Dunod, 6e Edition.
DOI: 10.4236/sgre.2018.912018 297 Smart Grid and Renewable Energy
[9] Ouedraogo, A., Barandja, V.D.B., Zerbo, I., Zoungran, M., Ramde, E.W. and Bathiebo, D.J. (2017) A Theoretical Study of Radio Wave Attenuation through a Polycrystalline Silicon Solar Cell. Turkish Journal of Physics, 41, 314-325.
https://doi.org/10.3906/fiz-1703-16
[10] Zerbo, I., Saria, M., Zoungrana, M., Ouedraogo, A. and Bathiebo, D.J. (2017) Effect of Incidence Angle Varying from 0 Rad to π/2 Rad and Intensity of Radio Waves on the Performance of a Silicon Solar Cell. Advances in Science and Technology Re-search Journal, 11, 68-75. https://doi.org/10.12913/22998624/80090
[11] Zerbo, I., Zoungrana, M., Sourabie, I., Ouedraogo, A., Zouma, B. and Bathiebo, D.J. (2015) External Magnetic Field Effect on Bifacial Silicon Solar Cell’s Electric Power and Conversion Efficiency. Turkish Journal of Physics, 39, 288-294.
https://doi.org/10.3906/fiz-1505-10
[12] Zoungrana, M., Dieng, B., Lemrabolt, O.H., Toure, F., Ould El Moujtaba, M.A., Sow, M.L. and Sissoko, G. (2012) External Electric Field Influence on Charge Carri-ers and Electrical ParametCarri-ers of Polycrystalline Silicon Solar Cell. Research Journal of Applied Sciences, Engineering and Technology, 4, 2967-2972.
[13] Serafettin, E. (2008) Comparing the Behaviours of Some Typical Solar Cells under External Effects. Teknoloji, 11, 233-237.
[14] Serafettin, E., Mustafa, A., Gazi, K.E. and Veli, C. (2006) The Behaviour of a Typical Singlerystal Si Solar Cell under High Intensity of Electric Field. Solar Energy Mate-rials & Solar Cells, 90, 582-587. https://doi.org/10.1016/j.solmat.2005.04.038
[15] ICNIRP (1998) ICNIRP Guidelines for Limiting Exposure to Time-Varying Electric, Magnetic and Electromagnetic Fields (up to 300 GHz). Health Physics, 74, 494-522. [16] Madougou, S., Made, F., Boukary, M.S. and Sissoko, G. (2007) I - V Characteristics
for Bifacial Silicon Solar Cell Studied under a Magnetic Field. Advanced Materials Research, 18-19, 333-312.
[17] Betser, Y., Ritter, D., Bahir, G., Cohen, S. and Sperling, J. (1995) Measurement of the Minority Carrier Mobility in the Base of Heterojunction Bipolar Transistors us-ing a Magnetotransport Method. Applied Physics Letters, 67, 1883.
https://doi.org/10.1063/1.114364
[18] Zerbo, I., Zoungrana, M., Sere, A.D., Ouedraogo, F., Sam, R., Zouma, B. and Zougmore, F. (2011) Influence d’une onde électromagnetique sur une photopile au silicium sous éclairement multispectral en regime statique. Revue des Energies Re-nouvelables, 14, 517-532.
[19] Shockley, W. and Read Jr., W.T. (1952) Statistics of the Recombinations of Holes and Electrons. Physical Review, 87, 835-842.
https://doi.org/10.1103/PhysRev.87.835
[20] Green, A.M. (2008) Self-Consistent Optical Parameters of Intrinsic Silicon at 300 K Including Temperature Coefficients. Solar Energy Materials & Solar Cells.
https://doi.org/10.1016/j.solmat.2008.06.009
[21] Zerbo, I., Zoungrana, M., Sere, A.D. and Zougmore, F. (2012) Silicon Solar Cell Under Electromagnetic Wave in Steady State: Effect of the Telecommunication Source’s Power of Radiation. IOP Conference Series: Materials Science and Engi-neering, 29, 12-19.
[22] Zerbo, I., Zoungrana, M., Ouedraogo, A. and Bathiebo, D.J. (2017) Effect of Junc-tion Quality on the Performance of a Silicon Solar Cell. Journal of Fundamental and Applied Sciences, 9, 1012-1026. https://doi.org/10.4314/jfas.v9i2.26
Sili-DOI: 10.4236/sgre.2018.912018 298 Smart Grid and Renewable Energy