ISSN Online: 2152-2219 ISSN Print: 2152-2197
DOI: 10.4236/jep.2019.102017 Feb. 19, 2019 289 Journal of Environmental Protection
Soil Carbon Dioxide Emission: Soil Respiration
Measurement in Temperate Grassland, Nepal
Deepa Dhital
1*, Suman Prajapati
2,3, Sanu Raja Maharjan
2, Hiroshi Koizumi
41Nepal Academy of Science and Technology (NAST), Khumaltar, Nepal 2Department of Environmental Science, Khwopa College, Dekocha, Nepal 3Sanima Hydro and Engineering Pvt. Ltd., Dhumbarahi, Nepal
4Faculty of Education and Integrated Arts and Sciences, Waseda University, Shinjuku, Japan
Abstract
Soil carbon dioxide emission: soil respiration is representing a major contri-butor of accumulating carbon dioxide in the atmosphere that aids to accele-rate global warming and altering the climate. Soil temperature, soil water content, sun light and vegetation are considered most common regulators of soil respiration variations in ecosystem. The soil respiration was measured in grassland intended to examine how the soil respiration changed with varying climatic factors, for two years (2015 and 2016) in temperate grassland of An-napurna Conservation Area (ACA), Nepal. In the study, soil temperature ac-counted exponential function of soil respiration variation at 42.9%, 19.1% and 23.3%, and temperature sensitivity of the soil respiration (Q10) was
ob-tained at 6.2, 1.4 and 1.8 in October 2015 and April 2016 and both the mea-surements were combined, respectively. Significant negative (R2 = 0.50, p <
0.05, October 2015) and positive (R2 = 0.084, p < 0.05, April 2016)
exponen-tial function of soil respiration and soil water content were determined, where high soil respiration values were always measured between 30% and 35% of the soil water content. However, linear significant relationship was deter-mined (R2 = 0.376, p < 0.05) between soil respiration and photosynthetic
photon flux density (PPFD). Soil respiration value averaged in October 2015 was 357 mg CO2 m−2 h−1 and in April 2016 it was 444.6 mg CO2 m−2 h−1.
Above- and below-ground plant biomasses were obtained at 231.1 g d w m−2
and 1538.8 g d w m−2 in October, and at 449.9 g d w m−2 and 349.0 g d w m−2
in April, respectively. This study showed variation of soil respiration in rela-tion to the factors such as soil temperature, soil water content and photosyn-thetic photon flux density signifying their importance in governing ecosystem function and carbon balance of the temperate grassland ecosystem.
How to cite this paper: Dhital, D., Praja-pati, S., Maharjan, S.R. and Koizumi, H. (2019) Soil Carbon Dioxide Emission: Soil Respiration Measurement in Temperate Grassland, Nepal. Journal of Environmen-tal Protection, 10, 289-314.
https://doi.org/10.4236/jep.2019.102017
Received: January 5, 2019 Accepted: February 16, 2019 Published: February 19, 2019
Copyright © 2019 by author(s) and Scientific Research Publishing Inc. This work is licensed under the Creative Commons Attribution International License (CC BY 4.0).
http://creativecommons.org/licenses/by/4.0/
DOI: 10.4236/jep.2019.102017 290 Journal of Environmental Protection
Keywords
Soil Respiration, Soil Temperature, Soil Water Content, Photosynthetic Photon Flux Density, Temperate Grassland
1. Introduction
Soil is a good resource to human kinds as it is dynamic to accumulate more car-bon than atmosphere and vegetation [1][2]. However, multiple factors in asso-ciation with soil degradation result in significant soil carbon losses [3] that affect overall carbon dynamics [4]. The efforts of soil restoration help prevent soil de-gradation with increase in soil organic carbon and mitigate climate change through sequestration [5] [6] [7] [8]. Soil carbon storage provides favorable conditions for increasing net primary productivity growth in grassland [9][10]. Soil carbon storage helps reduce soil erosion through a permanent soil cover with dense rooting systems and carbon input [11], coupling elemental cycles [12] [13] and overall carbon balance as sink/source capacity of the ecosystem [14][15].
The level of carbon in the atmosphere has increased exponentially (275 - 285 ppm [16] to 400 ppm [17]) and this continuous process is expected to go even higher (490 - 1370 ppm) by 2100 depending on representative concentration pathways [18]. The majority of additional atmospheric carbon dioxide comes naturally from soil through soil respiration. This phenomenon is a combined metabolic activity of roots and microorganisms generated mainly from soil sur-face by respiration and decomposition, respectively and it is considered the larg-est component of carbon cycling in grassland ecosystems [19][20][21][22]. The soil carbon dioxide emission in respiration, as much as 50% - 90% of the annual gross primary productivity returns back to the atmosphere [23] depending on biotic and abiotic factors [24][25][26][27][28]. Thus, magnitude of soil respi-ration can turn the carbon budget from a net sink into a net source in altered environmental conditions of increased temperature and drought [29] [30][31] [32]. However, the soil respiration response to these drivers varies among eco-systems, forest, grassland and tundra [22], and eco-regions [33].
The evidence shows that a small increase in terrestrial soil respiration can re-sult in higher atmospheric carbon dioxide (CO2) concentration, and ultimately
DOI: 10.4236/jep.2019.102017 291 Journal of Environmental Protection and significantly exacerbate in mitigating climate change [8] [37] [38] [39]. However, soil carbon pool dynamics can be altered with the factors like climate change [40], land use [41] [42] [43] and management practices [21] [44] [45] [46]. Research indicated that global soil carbon dioxide emissions are in the range of 98 ± 12 Pg∙y−1 (1 Pg = 1015 g), with annual increases of 0.1 Pg that is
suggested to be temperature-associated [47]. The storage of carbon in soil de-pends upon the carbon inputs, rate of decomposition of soil organic matter, soil texture and climate [48].
Multiple researches proved that the temperature, soil moisture, light intensity and plant growth affects on soil respiration, and the measurement of the soil respiration were conducted to reveal the effect of these factors to the variation of soil respiration, and overall change in the climate [20][21][32][49][50]. Scien-tific studies in terrestrial ecosystem have indicated that the temperature is di-rectly interrelated to the warming climate of global change, which has high re-sponse to the variations of soil respiration i.e. to the rising label of atmospheric carbon [20][23][33][36][51]. The precipitation, soil water content, light inten-sity and vegetation growth have very common effect on soil respiration varia-tions, and increasing soil respiration that ultimately depends on variability of measurement time/length and the existing climate during measurement period [22].
Geographical distribution of grassland is expansive throughout the world [38] and it is one of the principal ecotypes in the terrestrial ecosystem situated mostly in areas with more severe eco-environment where neither the forest growth nor the farmland reclamation is appropriate. Carbon in grasslands originates from below-ground biomass [14] [21] [52], primarily roots [53] [54] that increase with the age [55] and micro-organisms [43]. Approximately above 40% land area of the global terrestrial ice-free surface is covered by grasslands [56]. Globally, the grassland varies from sub-tropical, tropical and temperate region to the al-pine meadow with variation of altitudinal gradient from North to the South. The temperate regions are the common eco-regions of Asia and are most common in Nepal, which occupies 20% to 29% of the total land area, covered by the grass-land and is distributed from east to the larger area in the west (Source: [57]).
DOI: 10.4236/jep.2019.102017 292 Journal of Environmental Protection
2. Materials and Methods
2.1. Study Site
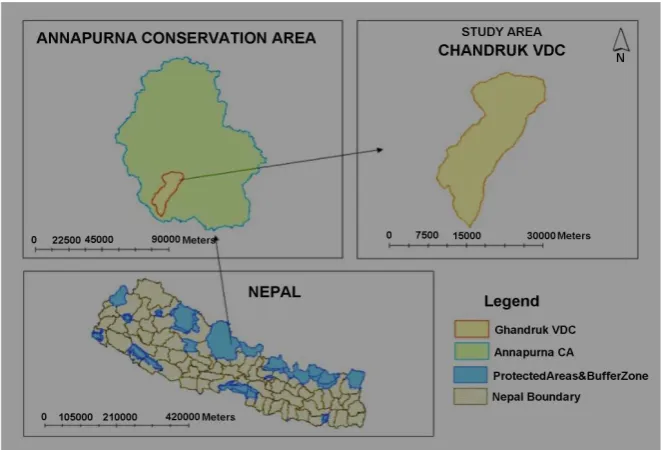
The study was conducted in grassland located at 2160 m a.s.l. in Annapurna Conservation Area of west central region (N 28˚22'23.7'', E 083˚48'18.0'') in Nep-al (Figure 1). The grassland covers an area of 10,872 m2. The Annapurna
Con-servation Area is a largest protected area of Nepal covering 7629 km2 which is
situated at the Annapurna range of Himalayas across Manang, Mustang, Kaski, Myagdi and Lamjung districts. The area ranges in altitude from 790 m a.s.l. to the peak of Annapurna I at 8091 m a.s.l. Climate of the study area is warm tem-perate with much less rainfall in winter than the summer. The annual mean temperature and rainfall from 2005 to 2014 were 16.5˚C and 441.21 mm, respec-tively (recorded at Lumle, Department of Hydrology and Meteorology, DHM 2016). The region has higher rainfall than the eastern region, and most rainfall occurred in July and August, whereas less rainfall and in some years no rainfall events occurred from November to December. The temperatures were recorded highest from July to August and lowest from January to December (DHM).
The study area was primarily dominated by Digitaria species (e.g. Digitaria
ischaemum, Digitaria sanguinalis and Digitaria flaccida) and Potentilla fulgens
but Centella asiatica, Geranium species and Anaphalis margaritaceae were also
common. The grassland area was surrounded by a dense Daphniphyllum hima-lense forest which was the habitat of wild animals, birds, etc and grazed with domestic and wild herbivores.
2.2. Environmental Factors
Air temperature and precipitation from 2005 to 2014 of the study area were re-ceived from the records available at the Department of Hydrology and Meteor-ology (DHM), Nepal. Soil temperatures and soil water content at 5 cm soil depth were measured at three different points near the chamber, during each soil res-piration measurement. The soil temperature was measured with a digital lab stem thermometer (AD-5622, A&D, Japan). Similarly, the soil water content was measured with TRIME-FM (Imko, Germany). Photosynthetic Photon Flux Den-sity (PPFD, light) was measured by using a data logger with LI-190SA quantum sensor (LI-COR Inc.) placed on top of the chamber at three points during each soil respiration measurement. The PPFD was measured in October 2015 and the measurement was not possible to make in April 2016 due to some technical glitch.
2.3. Soil Respiration
DOI: 10.4236/jep.2019.102017 293 Journal of Environmental Protection Figure 1. Map of Nepal, Annapurna Conservation Area and study area (Ghandruk).
and a body. This lid was equipped with an IRGA for the measurement of CO2
and gas temperature of the chamber (body). Vaisala CARBOCAP CO2 probe
GMP343 was used for the measurement of CO2 concentration and gas
tempera-ture inside the chamber. This method involves placing a chamber over the soil surface and increase in concentration of CO2 within the chamber is measured as
a function of time and logger (VAISALA humicap hand held device) was used to record the measured data. The chambers were randomly placed in the study area and they were inserted at 2 cm soil depth one day prior to the soil respiration measurements in order to avoid the installation effect and prevent instability of data records during the measurements. All living vegetations above the soil sur-face inside the chamber were clipped at the time of chamber installation to avoid above-ground plant respiration. Soil respiration was measured in the morning between 7:00 am and 9:00 am, afternoon between 11:00 am and 1:00 pm and evening between 3:00 am and 5:00 pm on 27th, 28th and 29th in October 2015 and
19th, 20th and 21st in April 2016. Three replications of soil respiration
measure-ments were made in each chamber. All measuremeasure-ments were conducted at 2 hours of time intervals within a day, on different dates and seasons in order to relate the soil respiration with varying temperature, soil moisture and light, and plant biomasses, and observe the effect of these factors on soil respiration.
2.4. Plant Biomass
DOI: 10.4236/jep.2019.102017 294 Journal of Environmental Protection each size 20 cm × 10 cm. The root samples were extracted up to 15 cm soil depths. The roots from the soil were manually separated, sieved and washed properly in order to remove all associated soil in the root. Both above-ground and below-ground parts were then oven dried at 70˚C for 48 h, and weighed with an electronic balance. The dry weights of the biomasses were then calcu-lated.
2.5. Data Analysis
Calculation of soil respiration was made from Equation (1) [58] as follows:
(
)(
)
F = V A ∆ ∆c t (1);
where, F is the soil respiration (mg CO2 m−2 h−1).
V is the volume of air within the chamber (m3).
A is the area of the soil surface within the chamber (m2).
∆c & ∆t is the time rate of change of the CO2 concentration in the air within
the chamber (mg CO2 m−3 h−1).
When the CO2 concentration is plotted against time, relationships of linear
regression can be ascertained [58][59]. The ∆c/∆t is calculated using this linear regression coefficient.
The soil respiration was estimated with the relation of soil temperature; an equation of exponential regression [14][24][33], which were used as follows:
( )
exp(
)
F T = ×a b T× (2); where F (𝑇𝑇) is the estimated soil respiration rate (mg CO2 m−2 h−1) at soil
tem-perature (T˚C) at 5 cm soil depth.
a represents the intercept of soil respiration rate when ST is zero. b represents the temperature sensitivity of soil respiration.
The bvalue was used to calculate a coefficient of temperature sensitivity (res-piration quotient, Q10), which describes the change in soil respiration over a
10˚C increase in soil temperature by Equation (3).
(
)
10 exp 10
Q = b× (3)
Soil samples for calculating bulk density of the soil were extracted using a soil core sampler. Soil samples (n = 5) were oven dried at 80˚C for 48 h and it was calculated dividing dried soil by volume of the core.
3. Results
3.1. Environmental Factors
DOI: 10.4236/jep.2019.102017 295 Journal of Environmental Protection precipitation was 1469.3 mm in July, and annual mean air temperature and pre-cipitation were recorded at 16.5˚C and 441.2 mm, respectively (Figure 2).
The maximum and minimum soil temperatures of the study area were meas-ured at 21.3˚C and 12.1˚C in October 2015, and 33.9˚C and 13.6˚C in April 2016, respectively. Maximum values of soil temperatures were measured at 15.9˚C, 21.3˚C and 20.2˚C in the morning, afternoon and evening, respectively, in October 2015. Similarly, the minimum values of soil temperatures were measured at 12.1˚C, 12.9˚C and 17˚C in the morning, afternoon and evening, respectively. The measurements in the evening on 29th October 2015 were not
conducted due to unfavorable weather condition with cold wind and heavy rain. Likewise, in April 2016 the maximum and minimum values of soil temperatures measured were 17.40˚C, 24.67˚C, 33.93˚C, and 13.57˚C, 17.23˚C, 22.33˚C in the morning, afternoon and evening, respectively (Figure 3).
The maximum and minimum soil water content (SWC) was measured at 59.6% and 23.4% in October 2015, and 42.2% and 15.6% in April 2016, respec-tively. The average soil water content measured on 29th October was found
highest (50.1%) because of the heavy rainfall in the previous night and day of measurements (Figure 4).
3.2. Soil Respiration and Soil Temperature
The soil respiration measured as a function of time calculated with the increase in concentration of CO2 within the chamber (Equation (1)) showed an
exponen-tial relationship (Equation (2)) that was obtained between soil respiration and soil temperature at 5 cm soil depth (Figure 3). The soil temperature accounted 42.9% of soil respiration variability and the relationship was statistically signifi-cant (p < 0.05), in October 2015 (Figure 3(a)). And the temperature sensitivity of soil respiration (Q10) value was obtained at 6.2. Whereas the soil temperature
accounted 19.1% of soil respiration variability in April 2016 (Figure 3(b)), and the relationship was statistically significant (p < 0.05). The temperature sensitiv-ity of soil respiration (Q10) value was obtained at 1.4. The variation of soil
respi-ration with the change in soil temperature by combining both measurements in October and April also showed significant (p < 0.05) exponential relationship, and the soil temperature accounted 23.3% of the soil respiration variability. In that case temperature sensitivity of soil respiration (Q10) value (Equation (3))
obtained at 1.8 (Figure 3(c)).
3.3. Soil Respiration and Soil Water Content
DOI: 10.4236/jep.2019.102017 296 Journal of Environmental Protection Figure 2. Monthly mean precipitation (bars) and air temperature (filled triangle) of the study area from 2005 to 2014 (Source: Department of hydrology and meteorology (DHM), Lumle).
[image:8.595.278.468.257.669.2]DOI: 10.4236/jep.2019.102017 297 Journal of Environmental Protection Figure 4. Relationship between soil respiration (mg CO2 m−2 h−1)
and soil water content (SWC %) at 5 cm soil depth (a) October 2015, (b) April 2016 and (c) Combined (a) and (b).
In these cases, changes in soil water content ranged from 23.3% to 59.6%. A pos-itive exponential relationship between soil respiration and soil water content was observed during the measurements in April 2016 and it was statistically signifi-cant (R2 = 0.084, p < 0.05) and the changes in soil water content ranged from
15.6% to 42.2% (Figure 4(b)). During that period of measurements the soil wa-ter content did not cross above its higher limit (35%) so as to significantly sup-press the soil respiration and the relationship was positive exponential upward trend. However, soil respiration and soil water content showed negative signifi-cant exponential function (R2 = 0.20, p < 0.05) when both measurements in
DOI: 10.4236/jep.2019.102017 298 Journal of Environmental Protection was recorded between 30% and 35% of the soil water content measured throughout the study period.
3.4. Soil Respiration and Photosynthetic Photon Flux Density
(PPFD)
Significant linear relationship was established (R2 = 0.376, p < 0.05) between soil
respiration and photosynthetic photon flux density (PPFD, Figure 5). Therefore, light (PPFD) accounted 37.6% of the soil respiration variability in this study. The maximum PPFD value was recorded at 1526.0 μ mol m−2 s−1 and minimum was
recorded at 51.68 μ mol m−2 s−1 in October.
3.5. Soil Respiration of the Grassland
Maximum and minimum soil respiration values recorded at different time schedule in the morning, afternoon and evening in October 2015 showed that the values were comparatively lower in the morning gradually increased in the afternoon, and then slightly decreased in the evening. The evening values of soil respiration were higher than the morning in a clear day (Table 1). However, on 29th October the values decreased from the morning towards afternoon due to
unfavorable weather condition with cold wind and heavy rainfall. Daily average soil respirations on 27th, 28th, and 29th October were 517.0, 430.5 and 123.4 mg
CO2 m−2 h−1, respectively. Lowest average daily soil respiration was obtained on
29th October due to unexpected bad weather condition. The seasonal soil
respi-ration in October was estimated (Equation (2)) at 356.97 mg CO2 m−2 h−1 in
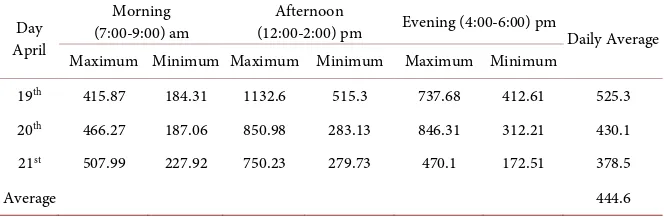
Oc-tober 2015. Similar trend of rising maximum and minimum soil respiration val-ues from morning towards afternoon, and then decreased valval-ues in the evening were observed during measurements in April 2016 (Table 2), except on 20th
April because the minimum value of the soil respiration was higher in the even-ing than the afternoon. Daily average soil respirations on 19th, 20th and 21st April
2016 were 525.3, 430.1 and 378.5 mg CO2 m−2 h−1, respectively. The seasonal soil
[image:10.595.263.487.522.681.2]respiration in April was estimated (Equation (2)) at 444.6 mg CO2 m−2 h−1.
DOI: 10.4236/jep.2019.102017 299 Journal of Environmental Protection Table 1. Maximum and minimum respiration with respect to the time, and daily average soil respiration (mg CO2 m−2 h−1) in October 2015 (n = 10).
Day October
Morning
(7:00-9:00) am (12:00-2:00) pm Afternoon (4:00-6:00) pm Evening Daily Average Maximum Minimum Maximum Minimum Maximum Minimum
27th 555.71 305.22 963.42 483.4 656.5 339.44 517
28th 465.8 275.46 661.83 351.5 584.55 300.2 430.5
29th 201.66 65.82 184.27 45.3 NA NA 123.4
Average 357.0
[NA = Not Available].
Table 2. Maximum and minimum respiration with respect to the time, and daily average soil respiration (mg CO2 m−2 h−1) in April 2016, n = 10.
Day April
Morning
(7:00-9:00) am (12:00-2:00) pm Afternoon Evening (4:00-6:00) pm Daily Average Maximum Minimum Maximum Minimum Maximum Minimum
19th 415.87 184.31 1132.6 515.3 737.68 412.61 525.3
20th 466.27 187.06 850.98 283.13 846.31 312.21 430.1
21st 507.99 227.92 750.23 279.73 470.1 172.51 378.5
Average 444.6
The diurnal changes in soil respiration and the soil temperature of the grass-land were very clear (Figure 6). Soil respirations were recorded higher during afternoon between 12:00 am and 2:00 pm than the morning and evening, and the values of soil respiration were always higher in the evening than the values observed in the morning (Figure 6(a)). The soil temperatures were recorded lower in the morning than the values observed in the afternoon, and there were not much difference in soil temperatures in the afternoon and evening (Figure 6(a)). The soil respiration measured on 20th April 2016 was higher in the evening
than it was measured in the afternoon (Figure 6(b)), and the soil temperature as well was recorded high in that day of the measurement. This shows that the soil below the surface took some hours to cool down. The PPFD was recorded higher in the afternoon than the morning and evening at the time of higher soil respira-tion in clear day (Figure 6(c)). In evening PPFD was higher than the morning and lower than the afternoon measurements. Highest value of PPFD was ob-tained in the afternoon at 1230.8 µ mol m−2 s−1 on 27th and the lowest value was
obtained in the evening at 118.0 µ mol m−2 s−1 on 28th October 2015.
This study showed clear daily variations of the soil respiration and soil tem-perature (Figure 7(a)). Daily soil respirations were comparatively higher at the time of higher soil temperatures, and the respiration was decreased on the day when soil temperature was remarkably low i.e. on 29th October 2016. However,
[image:11.595.207.539.271.380.2]DOI: 10.4236/jep.2019.102017 300 Journal of Environmental Protection (a)
(b)
[image:12.595.208.538.71.557.2](c)
Figure 6. Diurnal changes in soil respiration (mg CO2 m−2 h−1) and soil temperature (˚C) at 5 cm soil depth (n = 10), (a) October, 27th, 28th and 29th in 2015, (b) April, 19th, 20th and 21st in 2016 (c) diurnal changes in soil respiration and Photosynthetic Photon Flux Density (PPFD, µ mol m−2 s−1) on 27th and 28th October in 2015, n = 10. Bar, soil respi-ration; filled circle, soil temperature; filled square, PPFD; Mor, morning; Aft, afternoon; Eve, evening.
respiration and soil water content were observed in this study (Figure 7(b)). Slight difference in soil respiration and nearly equal soil water content values were obtained in the different days of the measurements. But, lowest soil respi-ration value was recorded on 29th October 2016 when soil water content was
DOI: 10.4236/jep.2019.102017 301 Journal of Environmental Protection Figure 7. Daily Variations in (a) soil respiration (mg CO2 m−2 h−1) and
soil temperature (˚C) at 5 cm soil depth and (b) soil respiration (mg CO2 m−2 h−1) and soil water content (%) in October, 2015 and April, 2016. Average of measurements is taken during morning, afternoon and evening. Bar, soil respiration; filled circle, soil temperature; open circle, soil water content.
3.6. Plant Biomass
Above-ground and below-ground plant biomasses were 231.1 g d w m−2 and
1538.8 g d w m−2 in October 2015, and 449.9 g d w m−2 and 349.0 g d w m−2 in
April 2016, respectively (Figure 8). The dry weight of the above-ground plant biomass in October 2015 was half of the dry weight of above-ground plant bio-mass in April 2016. But, the dry weight of below-ground plant biobio-mass in Octo-ber 2015 was more than 4 times of its dry weight in April 2016. The bulk density of the grassland was calculated at 0.8 g cm−3. The relationships between soil
res-piration and plant biomasses of the grassland were not observed in the study.
4. Discussion
4.1. Soil Respiration and Soil Temperature
DOI: 10.4236/jep.2019.102017 302 Journal of Environmental Protection Figure 8. Above and below-ground biomass (n = 5) in October 2015 and April 2016.
temperature accounted 42.9% of soil respiration variability in October 2015 (Figure 3(a)) was much higher in comparison to the measurements (19.1%) in April 2016 (Figure 3(b)) was owing to the variation of the weather conditions i.e. very fine days with higher soil temperature to cloudy and rainy days with much lower soil temperature observed during the measurements period in Oc-tober 2015. This showed that the temperature effect on soil respiration varies with the seasons. The physiological seasonal stability of the ecosystem during late growing season of the year in October showed due to observe the clear rela-tionship between soil respiration and soil temperature than the ecologically ac-tive early growing season in April. The ecological activities of the grassland might be varying and readily fluctuating in early growing season in order to quote the growing period of the plants. Difference between maximum (21.3˚C) and minimum (12.1˚C) soil temperature in October was comparatively lower, and was half of the range than that was obtained (33.9˚C and 13.6˚C) in April 2016 but the variability of soil respiration in October 2015 was much higher than the variability of soil respiration in April 2016. This proved that soil respiration becomes more accountable and responsive to the change in soil temperature within lower range of soil temperature variation.
The lower (R2 = 0.191) variability of soil respiration with the effect of soil
temperature in April (Figure 3(b)) was owing to the dry soil condition and some rainfall events occurred few days before the measurements date after long dry days which might have caused an evident fluctuation in soil respiration of 1132.6 mg CO2 m−2 h−1 at 21.4˚C and low soil respiration of 488.5 mg CO2 m−2 h−1
at 33.9˚C. The periodic drying and wetting of soil has a pronounced influence in soil CO2 evolution. When the soil is rewetted the activity of the microbes that
tem-DOI: 10.4236/jep.2019.102017 303 Journal of Environmental Protection perature, and then starts emitting high CO2 after the pores are reopened when
the soil water evaporates. Apart from this, in April, some of the chambers also showed higher soil respiration throughout the measurements period that may cause the overlapping of the actual temperature effect on soil respiration, which was not clearly visible from the measurements. This could be solved with conti-nuous digitalized measurements of soil respiration, soil temperature and preci-pitation for longer period of time to effectively determine the temperature and soil moisture effects on soil respiration. Our measurements provided an appro-priate result to understand the temperature effect of soil respiration and seasonal water availability. Liebig et al. [67] observed that it could not established the correlation between soil respiration and soil temperature in summer due to the effect of stable soil temperature, and variations were found only in spring and autumn caused by rapid growth and senescence in semiarid grazing grassland, United States. This proved that this study was better enough to understand the overall soil respiration trend to the variations of its influencing factors in the temperate grassland.
The temperature sensitivity of the soil respiration (Q10) values (Equation (3)),
also defined as change in soil respiration at an interval of 10˚C soil temperature were estimated at 6.2, 1.4 and 1.8 in October, April and in combined measure-ments relatively varied with each other. However, the values were comparable to global carbon cycle research from 1.3 to 3.3 in the forests [68], 3.4 to 5.6 in tem-perate forests, USA [49], 2.23 in temperate grasslands [19], and 4.2 in beech for-est [69]. The temperature sensitivity of soil respiration (Q10) was lower in dry
soil condition than in increased soil water availability and the effect was compa-ratively much pronounced in temperate region which was similar to previous observation [70], hence it might be the cause of variation in Q10 in our study.
The soil water content was higher (59.9%) in October 2015 than in April 2016 (Figure 4(a); Figure 4(b)). Besides, the soil respiration is more fluctuating at higher temperature range than the lower temperature range in grazing grassland [71]. The reason for relatively lower Q10 (1.4) and variation of soil respiration
with the soil temperature (19.1%) was owing to the higher temperature range (13.6˚C - 33.9˚C) occurred in April 2016. Recent global data model had also re-vealed that temperate or cold region grassland vegetation had low effect of tem-perature on soil respiration rather than tropical region [67][72]. High range (1 - 10) of Q10 values was reported in European forests; hence Q10 depends on
eco-system types, geographic location [73] and even on latitude for the same eco-types [75]. Thus, comparison of Q10 values is quite difficult, it is a very
in-formative index and ecologically complicated for predicting soil carbon dynam-ics [76]. And it increases with soil drying and wetting due to below-ground ac-tivity of carbon mineralization and microbial cycle [20][66][76]. Not only soil temperature and soil moisture, Q10 values often are confounded with
DOI: 10.4236/jep.2019.102017 304 Journal of Environmental Protection
4.2. Soil Respiration and Soil Moisture
The effect of soil moisture on soil respiration was analyzed in this study for the account to evaluate its effect in ecosystem. Many studies have revealed that tem-perature and soil moisture are the major ecological abiotic factors, regulating determinants of soil respiration in terrestrial ecosystems from regional to the global scale [20][43][61][62][79]. The negative relationship (Figure 4(a)) be-tween soil respiration and soil water content observed in October 2015 was liable to the rain events in first measurements day, after few days of clear weather. This type of negative relationship between soil respiration and soil water content with consequent restriction on soil respiration was observed in tropical rain forest of French Guiana [80]. Normally, the suppression of soil respiration due to rain events is caused by capillary effect where excess water in the soil limited gas production and transport. The soil respiration was generally increased with the increasing soil moisture up to some limit of soil moisture level. The upper limit of soil moisture to which the soil respiration increased was 35% and above that limit the soil respiration began to drop until the soil water content decreased and the negative curve was determined in October (Figure 4(a)). Similarly, in April 2016 lower soil moisture caused to suppress the soil respiration and that began to rise with increase in soil water content up to 35% that caused to result the positive exponential relationship between soil respiration and soil water content (Figure 4(b)). Reducing and enhancing of soil respiration under drought condi-tion and high soil water level was observed in semiarid temperate grassland [81]. This showed that soil water availability has not only positive effect on soil respi-ration but also has negative effect with the decrease in rate of respirespi-ration, as ob-served in this study. Many studies have also obtained the results showing lower soil water availability reducing soil respiration [20] [31] [82]. However, com-bined effect of soil water content and soil temperature is more responsive to the variation of soil respiration [32][61]. Soil respiration had minor sensitivity to temperature under low soil moisture level and it was more responsive to the temperature under high moisture level which was observed in this study (Figure 4), that was very much comparable to the previous studies [61][82][83]. How-ever, the practical way of confounding soil respiration with soil moisture was de-rived using different equation indifferent ecosystems [79]. Therefore, when soil moisture is adequate to support biological activity; soil temperature becomes an important determinant for soil respiration as observed by Carbone et al. [25].
4.3. Soil Respiration and PPFD
DOI: 10.4236/jep.2019.102017 305 Journal of Environmental Protection lower relationship between soil respiration and PPFD. The relationship observed in this study was nearly consistent with the research observed in an apple orc-hard in Northern Italy [84] i.e. in both scenarios less than 50% variability has been obtained. According to research conducted by Tang et al. [85] and Liu et al. [86], the effect of PPFD was likely due to the control of photosynthesis on car-bon availability at the root system and soil respiration whose contribution to to-tal soil respiration increases with light regimes, GPP, NPP and temperature. More detailed study might help to understand eco-physiological perspectives of soil respiration in temperate grassland.
4.4. Seasonal and Diurnal Change in Soil Respiration
The average soil respiration obtained during the measurements were 357.0 mg CO2 m−2 h−1 and 444.6 mg CO2 m−2 h−1 in October 2015 and April 2016,
respec-tively, which represents the seasonal soil respiration in autumn and spring sea-son of the grassland. The seasea-sonal soil respiration value 444.6 mg CO2 m−2 h−1 of
this study is comparable to the value (417 mg CO2 m−2 h−1) obtained from the
study conducted in Japanese Zoysia grassland in April [87] and also comparable to relatively high value (622 mg CO2 m−2 h−1) in May and (611 mg CO2 m−2 h−1)
in October obtained from the study conducted in Zoysia grassland [14]. The variations seen in soil respiration during different seasons of this study might be comparable with the result of the study conducted in a perennial grassland for several years that showed lower soil respiration in the first four months (Jan.-Apr.) at lower soil temperature and soil respiration started increasing with increase in temperature until the temperature again started decreasing from au-tumn (October) towards winter [88]. The temperature response of soil respira-tion was obviously proven by the diurnal changes of soil respirarespira-tion with lower values of soil respiration in the morning and evening at lower temperatures (Figure 6(a); Figure 6(b)) and higher values of soil respiration in the afternoon with higher temperatures (Table 1; Table 2). The values obtained in this study were comparable to the soil respiration measured (49 - 358, 55 - 378 and 55 - 448 mg CO2 m−2 h−1) in tropical grassland, India [89] but lower maximum value (200
mg CO2 m−2 h−1) was reported in mixed grassland [90]. Therefore, the rate of
respiration and its maximum and minimum values are mostly determined by temperature, soil moisture, light intensity, and mostly the seasonal factors, and they are the common and very sites specific for the variation of soil respiration.
4.5. Soil Respiration and Plant Biomass
DOI: 10.4236/jep.2019.102017 306 Journal of Environmental Protection have revealed that below-ground plant productivity and soil moisture have di-rect common effects on soil respiration [95][96]. According to Geng et al. [95], the variation in soil respiration with below-ground biomass was attributed at 80% among different sites, and below-ground biomass was directly correlated with root respiration of 31% - 51% in C3/C4 grassland [97], 14.5% - 62.62 % in rape field [96], 33% - 71% in perennial grassland [14] which is the major con-tributor of soil respiration in grassland. Limitations of research fund and the remoteness of the study area made it difficult to establish animal exclusion to measure the plant biomass and soil respiration with short measurement intervals throughout the year. The lower above-ground biomass in October 2015 (231.1 g d w m−2) than in April 2016 (449.9 g d w m−2) was attributed due to the seasonal
variation, as October is the late growing season just after high grazing period following growing season and April is the early growing season with beginning of growing period with mild grazing effect. But, below-ground biomass was higher in October (1538.8 g d w m−2) than April (349 g d w m−2) (Figure 8). The
below-ground plant biomass began to increase from early plant growing season (May) and reached its peak in autumn (October), then decreased throughout the winter as obtained in a perennial temperate Japanese grassland [9]. The plant biomass effect on soil respiration and in relation to the climatic factors could be the further research objective of this temperate grassland.
5. Conclusion
Soil temperature accounted 42.9%, 19.1% and 23.3% of soil respiration variabili-ty in October 2015 and April 2016 and both the measurements. The temperature sensitivity of soil respiration (Q10) obtained was comparatively high in October
(Q10 = 6.2) at lower range of soil temperature than the higher range in April (Q10
= 1.4) which showed that the temperature sensitivity of soil respiration de-creased with increasing temperature range. Significant negative (R2 = 0.50, p <
0.05) and positive (R2 = 0.084, p < 0.05) exponential function were observed
be-tween soil respiration and soil water content in October 2015 and April 2016. Maximum soil respiration was observed between 30% and 35% of soil water content. Soil respiration showed significant linear relationship (R2 = 0.376) with
photosynthetic photon flux density (PPFD). Lower value of soil respiration measured during the morning and the higher value in the afternoon than in the evening were owing to the lower soil temperature in the morning and evening. Seasonal average soil respirations in October 2015 (357.0 mg CO2 m−2 h−1) were
lower than April 2016 (444.6 mg CO2 m−2 h−1). The above-ground plant biomass
in October 2015 (231.1 g d w m−2) was half of its dry weight than April 2016
(449.9 g d w m−2) and the dry weight of below-ground biomass in October
(1538.8 g d w m−2) was more than 4 times of its dry weight than in April (349.0 g
d w m−2). This study showed soil respiration variation in relation to the factors
DOI: 10.4236/jep.2019.102017 307 Journal of Environmental Protection governing ecosystem function and carbon balance of the temperate grassland ecosystem.
Acknowledgements
We thank Nepal Academy of Science and Technology (NAST) for equipments and field visit, and Resources Himalaya Foundation, Nepal for the research grant. We thank the Department of National Park and Wildlife Conservation (DNPWC), Government of Nepal, National Trust for Nature Conservation and Annapurna Conservation Area Project (ACAP) for providing permission to conduct this research. We are thankful to the local people of Ghandruk, ACA for their cooperation.
Conflicts of Interest
The authors declare that they have no competing interests regarding this re-search.
References
[1] Brevik, E.C., Cerdà, A., Mataix-Solera, J., Pereg, L., Quinton, J.N., Six, J. and Van Oost, K. (2015) The Interdisciplinary Nature of Soil. Soil, 1, 117-129.
https://doi.org/10.5194/soil-1-117-2015
[2] Keesstra, S.D., Bouma, J., Wallinga, J., Tittonell, P., Smith, P., Cerdà, A., Montana-rella, L., Quinton, J.N., Pachepsky, Y., van der Putten, W.H., Bardgett, R.D., Moo-lenaar, S., Mol, G., Jansen, B. and Fresco, L.O. (2016) The Significance of Soils and Soil Science towards Realization of the United Nations Sustainable Development Goals. Soil, 2, 111-128. https://doi.org/10.5194/soil-2-111-2016
[3] Bai, Z.G., Dent, D.L., Olsson, L. and Schaepman, M.E. (2008) Global Assessment of Land Degradation and Improvement. 1. Identification by Remote Sensing. Report 2008/01, ISRIC—World Soil Information, Wageningen, The Netherlands.
[4] Ryals, R., Hartman, M.D., Parton, W., Delonge, M.S. and Silver, W.L. (2015) Long-Term Climate Change Mitigation Potential with Organic Matter Management on Grasslands. Ecological Applications, 25, 531-545.
https://doi.org/10.1890/13-2126.1
[5] De Deyn, G.B., Cornelissen, J.H. and Bardgett, R.D. (2008) Plant Functional Traits and Soil Carbon Sequestration in Contrasting Biomes. Ecological Letters, 11, 516-531. https://doi.org/10.1111/j.1461-0248.2008.01164.x
[6] Kuzyakov, Y. and Gavrichkova, O. (2010) Review Time Lag between Photosynthesis and Carbon Dioxide Efflux from Soil: A Review of Mechanisms and Controls. Global Change Biology, 16, 3386-3406.
https://doi.org/10.1111/j.1365-2486.2010.02179.x
[7] Deng, L., Liu, G.B. and Shangguan, Z.P. (2014) Land-use Conversion and Changing Soil Carbon Stocks in China’s “Grain-for-Green” Program: A Synthesis. Global Change Biology, 20, 3544-3556. https://doi.org/10.1111/gcb.12508
[8] Parras-Alcántara, L., Díaz-Jaimes, L. and Lozano-García, B. (2015) Management Effects on Soil Organic Carbon Stock in Mediterranean Open Rangelands-Treeless Grasslands. Land Degradation and Development, 26, 22-34.
https://doi.org/10.1002/ldr.2269
Measure-DOI: 10.4236/jep.2019.102017 308 Journal of Environmental Protection ment of Net Ecosystem Production and Ecosystem Respiration in a Zoysia japonica Grassland, Central Japan, by the Chamber Method. Ecological Research, 25, 483-493. [10] Rumpel, C., Crème, A., Ngo, P.T., Velásquez, G., Mora, M.L. and Chabbi, A. (2015)
The Impact of Grassland Management on Biogeochemical Cycles Involving Carbon, Nitrogen and Phosphorus. Journal of Soil Science and Plant Nutrition, 15, 353-371. https://doi.org/10.4067/S0718-95162015005000034
[11] Conant, R.T. (2010) Challenges and Opportunities for Carbon Sequestration in Grassland Systems. A Technical Report. Integrated Crop Management, 9, 1-51. [12] Soussana, J.F. and Lemaire, G. (2014) Coupling Carbon and Nitrogen Cycles for
Environmentally Sustainable Intensification of Grasslands and Crop-livestock Sys-tems. Agriculture, Ecosystems and Environment, 190, 9-17.
https://doi.org/10.1016/j.agee.2013.10.012
[13] Finzi, A.C., Abramoff, R.Z., Spiller, K.S., Brzostek, E.R., Darby, B.A., Kramer, M.A. and Phillips, R.P. (2015) Rhizosphere Processes Are Quantitatively Important Components of Terrestrial Carbon and Nutrient Cycles. Global Change Biology, 21, 2082-2094. https://doi.org/10.1111/gcb.12816
[14] Dhital, D., Yashiro, Y., Ohtsuka, T., Noda, H., Shizu, Y. and Koizumi, H. (2010) Carbon Dynamics and Budget in a Zoysia japonica Grassland, Central Japan. Jour-nal of Plant Research, 123, 519-530.
[15] Dai, E., Huang, Y., Wu, Z. and Zhao, D. (2016) Analysis of Spatio-Temporal Fea-tures of a Carbon Source/Sink and Its Relationship to Climatic Factors in the Inner Mongolia Grassland Ecosystem. Journal of Geographical Sciences, 26, 297-312. https://doi.org/10.1007/s11442-016-1269-0
[16] Raynaud, D. and Barnola, J.M. (1985) An Antarctic Ice Core Reveals Atmospheric CO2 Variations Over the Past Few Centuries. Nature, 315, 309-311.
https://doi.org/10.1038/315309a0
[17] Monastersky, R. (2013) Global Carbon Dioxide Levels near Worrisome Milestone. Nature, 497, 13-14. https://doi.org/10.1038/497013a
[18] Moss, R.H., Edmonds, J.A., Hibbard, K.A., Manning, M.R., Rose, S.K., van Vuuren, D.P,, Carter, T.R., Emori, S., Kainuma, M., Kram, T., Meehl, G.A., Mitchell, J.F., Nakicenovic, N., Riahi, K., Smith, S.J., Stouffer, R.J., Thomson, A.M., Weyant, J.P. and Wilbanks, T.J. (2010) The Next Generation of Scenarios for Climate Change Research and Assessment. Nature, 463, 747-756.
https://doi.org/10.1038/nature08823
[19] Wang, W. and Fang, J. (2009) Soil Respiration and Human Effects on Global Grass-lands. Global Planetary Change, 67, 20-28.
https://doi.org/10.1016/j.gloplacha.2008.12.011
[20] Shen, Z.X., Li, Y.L. and Fu, G. (2015) Response of Soil Respiration to Short-Term Experimental Warming and Precipitation Pulses over the Growing Season in an Al-pine Meadow on the Northern Tibet. Applied Soil Ecology, 90, 35-40.
https://doi.org/10.1016/j.apsoil.2015.01.015
[21] Wang, Z., Ji, L., Hou, X. and Schellenberg, M.P. (2016) Soil Respiration in Semiarid Temperate Grasslands under Various Land Management. PLoS ONE, 11, e0147987. [22] Feng, J., Wang, J., Ding, L., Yao, P., Qiao, M. and Yao, S. (2017) Meta-Analyses of
the Effects of Major Global Change Drivers on Soil Respiration across China. At-mospheric Environment, 150, 181-186.
https://doi.org/10.1016/j.atmosenv.2016.11.060
DOI: 10.4236/jep.2019.102017 309 Journal of Environmental Protection Williams, M., Ammann, C., Berninger, F., Flechard, C., Jones, S., Balzarolo, M., Kumarm S., Newesely, C., Priwitzer, T., Raschi, A., Siegwolf, R., Susiluoto, S., Ten-hunen, J., Wohlfahrt, G. and Cernusca, A. (2008) Soil Respiration in European Grasslands in Relation to Climate and Assimilate Supply. Ecosystems, 11, 1352-1367. https://doi.org/10.1007/s10021-008-9198-0
[24] Bao, F., Zhou, G., Wang, F. and Sui, X. (2010) Partitioning Soil Respiration in a Temperate Desert Steppe in Inner Mongolia Using Exponential Regression Method. Soil Biology and Biochemistry, 42, 2339-2341.
https://doi.org/10.1016/j.soilbio.2010.08.033
[25] Carbone, M., Still, C.J., Ambrose, A.R., Dawson, T.E., Williams, A.P., Boot, C.M., Schaeffer, S.M. and Schimel, J.P. (2011) Seasonal and Episodic Moisture Controls on Plant and Microbial Contributions to Soil Respiration. Oecologia, 167, 265-278. https://doi.org/10.1007/s00442-011-1975-3
[26] Moyano, F.E., Manzoni, S. and Chenu, C. (2013) Responses of Soil Heterotrophic Respiration to Moisture Availability: An Exploration of Processes and Models. Soil Biology and Biochemistry, 59, 72-85. https://doi.org/10.1016/j.soilbio.2013.01.002 [27] van der Heijden, M.G.A., Martin, F.M., Selosse, M.A. and Sanders, I.R. (2015)
My-corrhizal Ecology and Evolution: The Past, the Present, and the Future. New Phy-tologist, 205, 1406-1423. https://doi.org/10.1111/nph.13288
[28] Liu, T., Xu, Z.Z., Hou, Y.H. and Zhou, G.S. (2016a) Effects of Warming and Changing Precipitation Rates on Soil Respiration over Two Years in a Desert Steppe of Northern China. Plant and Soil, 400, 15-27.
[29] Frank, D.C., Esper, J., Raible, C.C., Buntgen, U., Trouet, V., Stocker, B. and Joos, F. (2010) Ensemble Reconstruction Constraints on the Global Carbon Cycle Sensitivi-ty to Climate. Nature, 463, 527-530. https://doi.org/10.1038/nature08769
[30] Yan, L., Chen, S., Huang, J. and Lin, G. (2011) Water Regulated Effects of Photo-synthetic Substrate Supply on Soil Respiration in a Semiarid Steppe. Global Change Biology, 17, 1990-2001. https://doi.org/10.1111/j.1365-2486.2010.02365.x
[31] Chang, C.T., Sperlich, D., Sabaté, S., Sánchez-Costa, E., Cotillas, M., Espelta , J.M. and Gracia, C. (2016) Mitigating the Stress of Drought on Soil Respiration by Selec-tive Thinning: Contrasting Effects of Drought on Soil Respiration of Two Oak Spe-cies in a Mediterranean Forest. Forests, 7, 263. https://doi.org/10.3390/f7110263 [32] Li, G., Kim, S., Hyun Han, S., Chang, H. and Son, Y. (2017) Effect of Soil Moisture
on the Response of Soil Respiration to Open-Field Experimental Warming and Pre-cipitation Manipulation. Forests, 8, 56. https://doi.org/10.3390/f8030056
[33] Zhong, Z.M., Shen, Z.X. and Fu, G. (2016) Response of Soil Respiration to Experi-mental Warming in a Highland Barley of the Tibet. Springer Plus, 5, 137.
https://doi.org/10.1186/s40064-016-1761-0
[34] Vargas, R., Carbone, M.S., Reichstein, M. and Baldocchi, D.D. (2011) Frontiers and Challenges in Soil Respiration Research: From Measurements to Model Data Inte-gration. Biogeochemistry, 102, 1-13. https://doi.org/10.1007/s10533-010-9462-1 [35] Liu, Y., Liu, S., Wan, S., Wang, J., Luan, J. and Wang, H. (2016b) Differential
Res-ponses of Soil Respiration to Soil Warming and Experimental through Fall Reduc-tion in a TransiReduc-tional Oak Forest in Central China. Agriculture and Forest Meteor-ology, 226, 186-198.
DOI: 10.4236/jep.2019.102017 310 Journal of Environmental Protection https://doi.org/10.1111/j.1365-2486.2012.02696.x
[37] Guo, L.B. and Gifford, R.M. (2002) Soil Carbon Stocks and Land Use Change: A Meta Analysis. Global Change Biology, 8, 345-360.
[38] Lal, R. (2004) Soil Carbon Sequestration to Mitigate Climate Change. Geoderma, 123, 1-22.
[39] Tang, J., Bolstad, P.V. and Martin, J.G. (2009) Soil Carbon Fluxes and Stocks in a Great Lakes Forest Chronosequence. Global Change Biology, 15, 145-155.
https://doi.org/10.1111/j.1365-2486.2008.01741.x
[40] Field, C.B., Lobell, D.B., Peters, H.A. and Chiariello, N.R. (2007) Feedbacks of Ter-restrial Ecosystems to Climate Change. Annual Review of Environment and Re-sources, 32, 1-29. https://doi.org/10.1146/annurev.energy.32.053006.141119
[41] Don, A., Schumacher, J. and Freibauer, A. (2011) Impact of Tropical Land Use Change on Soil Organic Carbon Stocks—A Meta-Analysis. Global Change Biology, 17, 1658-1670. https://doi.org/10.1111/j.1365-2486.2010.02336.x
[42] Muñoz-Rojas, M., Jordán, A., Zavala, L.M., De la Rosa, D., Abd-Elmabod, S.K. and Anaya-Romero, M. (2015) Impact of Land Use and Land Cover Changes on Organ-ic Carbon Stocks in Mediterranean Soils (1956-2007). Land Degradation and De-velopment, 26, 168-179. https://doi.org/10.1002/ldr.2194
[43] Zhang, M., Li, X., Wang, H., Deng, F., Li, X. and Mi, X.J. (2017) Effects of Convert-ing Natural Grasslands into Planted Grasslands on Ecosystem Respiration: A Case Study in Inner Mongolia, China. Journal Arid Land, 9, 38-50.
https://doi.org/10.1007/s40333-016-0059-y
[44] Eviner, V.T. and Hawkes, C.V. (2008) Embracing Variability in the Application of Plant-Soil Interactions to the Restoration of Communities and Ecosystems. Restora-tion Ecology, 16, 713-729. https://doi.org/10.1111/j.1526-100X.2008.00482.x [45] Luo, Z.K., Wang, E.L. and Sun, Q.J. (2010) Soil Carbon Change and Its Response to
Agricultural Practices in Australian Agroecosystems: A Review and Synthesis. Geo-derma, 155, 211-223.
[46] Ono, K., Mano, M., Han, G.H., Nagai, H., Yamada, T., Kobayashi, Y., Miyata, A., Inoue, Y. and Lal, R. (2015) Environmental Controls on Fallow Carbon Dioxide Flux in a Single-Crop Rice Paddy, Japan. Land Degradation and Development, 26, 331-339. https://doi.org/10.1002/ldr.2211
[47] Bond-Lamberty, B. and Thomson, A. (2010) Temperature-Associated Increases in the Global Soil Respiration Record. Nature, 464, 579-582.
https://doi.org/10.1038/nature08930
[48] Johnston, A.E., Poulton, P.R. and Coleman, K. (2009) Soil Organic Matter: Its Im-portance in Sustainable Agriculture and Carbon Dioxide Fluxes. Advances in Agronomy, 101, 1-57. https://doi.org/10.1016/S0065-2113(08)00801-8
[49] Davidson, E.A., Belk, E. and Boone, R.D. (1998) Soil Water Content and Tempera-ture as Independent or Confounded Factors Controlling Soil Respiration in a Tem-perate Mixed Hardwood Forest. Global Change Biology, 4, 217-227.
[50] Hashimoto, T., Miura, S. and Ishizuka, S. (2009) Temperature Controls Temporal Variation in Soil CO2 Efflux in a Secondary Beech Forest in Appi Highlands, Japan. Journal of Forest Research, 14, 44-50. https://doi.org/10.1007/s10310-008-0096-2 [51] Lamberty, B. and Thomson, A.M. (2010) Temperature-Associated Increases in the
DOI: 10.4236/jep.2019.102017 311 Journal of Environmental Protection [52] Jackson, R.B., Banner, J.L., Jobbagy, E.G., Pockman, W.T. and Wall, D.H. (2002)
Ecosystem Carbon Loss with woody Plant Invasion of Grasslands. Nature, 418, 623-626. https://doi.org/10.1038/nature00910
[53] Adair, E.C., Reich, P.B., Hobbie, S.E. and Knops, J.M.H. (2009) Interactive Effects of Time, CO2, N, and Diversity on Total Belowground Carbon Allocation and Ecosys-tem Carbon Storage in a Grassland Community. EcosysEcosys-tems, 12, 1037-1052. https://doi.org/10.1007/s10021-009-9278-9
[54] Rasmussen, J., Eriksen, J., Jensen, E.S. and Jensen, H.H. (2010) Root Size Fractions of Ryegrass and Clover Contribute Differently to C and N Inclusion in SOM. Biol-ogy and Fertility of Soils, 46, 293-297. https://doi.org/10.1007/s00374-009-0430-7 [55] Maher, R.M., Asbjornsen, H., Kolka, R.K., Cambardella, C.A. and Raich, J.W.
(2010) Changes in Soil Respiration across a Chronosequence of Tallgrass Prairie Reconstructions. Agriculture, Ecosystems and Environment, 139, 749-753. https://doi.org/10.1016/j.agee.2010.09.009
[56] Adams, J.M., Faure, H., Fauredenard, L., McGlade, J.M. and Woodward, F.I. (1990) Increases in Terrestrial Carbon Storage from the Last Glacial Maximum to the Present. Nature, 348, 711-714. https://doi.org/10.1038/348711a0
[57] LRMP (1986) Land Utilization Report. His Majesty’s Government of Nepal & Gov-ernment of Canada. Kenting Earth Sciences Limited.
[58] Koizumi, H., Kontturi, M., Mariko, S., Nakadai, T., Bekku, Y. and Mela, T. (1999) Soil Respiration in Three Soil Types in Agricultural Ecosystems in Finland. Acta Agriculturae Scandinavica, Section B, Soil & Plant Science, 49, 65-74.
https://doi.org/10.1080/09064719950135560
[59] Bekku, Y., Koizumi, H., Nakadai, T. and Iwaki, H. (1995) Measurement of Soil Res-piration Using Closed-Chamber Method—An IRGA Technique. Ecological Re-search, 10, 369-373. https://doi.org/10.1007/BF02347863
[60] Jia, B.R. and Zhou, G.S. (2009) Integrated Diurnal Soil Respiration Model during Growing Season of a Typical Temperate Steppe: Effects of Temperature, Soil Water Content and Biomass Production. Soil Biology and Biochemistry, 41, 681-686. https://doi.org/10.1016/j.soilbio.2008.12.030
[61] Jiang, H., Deng, Q., Zhou, G., Hui, D., Zhang, D., Liu, S., Chu, G. and Li, J. (2013) Responses of Soil Respiration and Its Temperature/Moisture Sensitivity to Precipi-tation in Three Subtropical Forests in Southern China. Biogeosciences, 10, 3963-3982. https://doi.org/10.5194/bg-10-3963-2013
[62] Bao, X., Zhu, X., Chang, X., Wang, S., Xu, B., Luo, C., Zhang, Z., Wang, Q., Rui, Y. and Cui, X. (2016) Effects of Soil Temperature and Moisture on Soil Respiration on the Tibetan Plateau. PLoS ONE, 11, e0165212.
https://doi.org/10.1371/journal.pone.0165212
[63] Orchared, V.A. and Cook, F.J. (1983) Relationship between Soil Respiration and Soil Moisture. Soil Biology and Biochemistry, 15, 447-453.
https://doi.org/10.1016/0038-0717(83)90010-X
[64] Casals, P., Romanya, J., Cortina, J., Bottner, P., Couteaux, M.M. and Vallejo, V.R. (2000) CO2 Efflux from a Mediterranean Semi-Arid Forest Soil. II. Seasonality and Effects of Stoniness. Biogeochemistry, 48, 261-281.
https://doi.org/10.1023/A:1006289905991
[65] Sponseller, R.A. (2007) Precipitation Pulses and Soil CO2 Flux in a Sonoran Desert Ecosystem. Global Change Biology, 13, 426-436.
https://doi.org/10.1111/j.1365-2486.2006.01307.x
DOI: 10.4236/jep.2019.102017 312 Journal of Environmental Protection Drying-Rewetting along a Semi-Arid Elevation Gradient. Geoderma, 163, 171-177. https://doi.org/10.1016/j.geoderma.2011.04.003
[67] Liebig, M.A., Kronberg, S.L., Hendrickson, J.R., Dong, X. and Gross, J.R. (2013) Carbon Dioxide Efflux from Long-Term Grazing Management Systems in a Semia-rid Region. Agriculture, Ecosystems and Environment, 164, 137-144.
https://doi.org/10.1016/j.agee.2012.09.015
[68] Raich, J.W. and Potter, C.S. (1995) Global Patterns of Carbon Dioxide Emissions from Soils. Global Biogeochemical Cycles, 9, 23-36.
https://doi.org/10.1029/94GB02723
[69] Janssens, I.A. and Pilegaard, K. (2003) Large Seasonal Changes in Q10 of Soil Res-piration in a Beech Forest. Global Change Biology, 9, 911-918.
https://doi.org/10.1046/j.1365-2486.2003.00636.x
[70] McCulley, R., Boutton, T. and Archer, S. (2007) Soil Respiration in a Subtropical Savanna Parkland: Response to Water Additions. Soil Science Society of America Journal, 71, 820-828. https://doi.org/10.2136/sssaj2006.0303
[71] Brito, L.F., Azenha, M.V., Janusckiewicz, E.R., Cardoso, A.S., Morgado, E.S., Mal-heiros, E.B., Scala Jr., N.L., Reis, R.A. and Cláudiauggieri, A. (2015) Seasonal Fluc-tuation of Soil Carbon Dioxide Emission in Differently Managed Pastures. Agron-omy Journal, 107, 957-962. https://doi.org/10.2134/agronj14.0480
[72] Kim, D., Lee, M.I. and Seo, E. (2017) Improvement of Soil Respiration & Paramete-rization in a Dynamic Global Vegetation Model and Its Impact on the Simulation of Terrestrial Carbon Fluxes. Biogeosciences Discussions.
[73] Janssens, L.A., Dore, D., Epron, D., Lankneijer, H., Buchmann, N., Longcloz, B. and Montagnani, L. (2000) Soil Respiration: A Summary of Results from the EUROFLUX Sites. In: Valentini, R., Ed., Bioshperic Exchanges of Carbon, Water and Energy from European Forests, Final Report of the EUROFLUX Project, EC, Brussels. [74] Hashimoto, S. (2005) Q10 Values of Soil Respiration in Japanese Forests. Journal of
Forest Research, 10, 409-413. https://doi.org/10.1007/s10310-005-0164-9
[75] Yuste, J.C., Janssens, I.A., Carrare, A. and Ceulemans, R. (2004) Annual Q10 of Soil Respiration Reflects Plant Phenological Patterns as Well as Temperature Sensitivity. Global Change Biology, 10, 161-169.
https://doi.org/10.1111/j.1529-8817.2003.00727.x
[76] Munson, S.M., Benton, T.J., Lauenroth, W.K. and Burke, I.C. (2010) Soil Carbon Flux Following Pulse Precipitation Events in the Shortgrass Steppe. Ecological Re-search, 25, 205-211. https://doi.org/10.1007/s11284-009-0651-0
[77] Wang, X.H., Piao, S.L., Ciais, P., Janssens, I.A., Reichstein, M., Peng, S.S. and Wang, T. (2010) Are Ecological Gradients in Seasonal Q10 of Soil Respiration Explained by Climate or by Vegetation Seasonality? Soil Biology and Biochemistry, 42, 1728-1734. [78] Kim, D., Mu, S., Kang, S. and Lee, D. (2010) Factors Controlling Soil CO2 Effluxes
and the Effects of Rewetting on Effluxes in Adjacent Deciduous, Coniferous, and Mixed Forests in Korea. Soil Biology and Biochemistry, 42, 576-585.
https://doi.org/10.1016/j.soilbio.2009.12.005
[79] Luo, Y. and Zhou, X. (2006) Soil and Respiration Environment. Academic Press, San Diego.
[80] Epron, D., Bosc, A., Bonal, D. and Freycon, V. (2006) Spatial Variation of Soil Res-piration across a Topographic Gradient in a Tropical Rain Forest in French Guiana. Journal of Tropical Ecology, 22, 565-574.
https://doi.org/10.1017/S0266467406003415
Nonli-DOI: 10.4236/jep.2019.102017 313 Journal of Environmental Protection near Responses of Soil Respiration to Precipitation Changes in a Semiarid Tempe-rate Steppe. Scientific Reports, 7, Article No. 45782.
[82] Harper, C.W., Blair, J.M., Fay, P.A., Knapp, A.K. and Carlisle, J.D. (2005) Increased Rainfall Variability and Reduced Rainfall Amount Decreases Soil CO2 Flux in a Grassland Ecosystem. Global Change Biology, 11, 322-334.
https://doi.org/10.1111/j.1365-2486.2005.00899.x
[83] Carlyle, J.C. and Than, U.B. (1988) Abiotic Controls of Soil Respiration beneath an Eighteen-Year-Old Pinus Radiate Stand in South-Eastern Australia. Journal of Ecology, 76, 654-662. https://doi.org/10.2307/2260565
[84] Scandellari, F., Zanotelli, D., Ceccon, C., Bolognesi, M., Montagnani, L., Cassol, P., Melo, G.W. and Tagliavini, M. (2015) Enhancing Prediction Accuracy of Soil Res-piration in an Apple Orchard by Integrating Photosynthetic Activity into a Tem-perature-Related Model. European Journal of Soil Biology, 76, 654-662.
[85] Tang, J., Baldocchi, D. and Xu, L. (2005) Tree Photosynthesis Modulates Soil Res-piration on a Diurnal Time Scale. Global Change Biology, 11, 1298-304.
https://doi.org/10.1111/j.1365-2486.2005.00978.x
[86] Liu, Q., Edwards, N.T., Post, W.M., Gu, L., Ledford, J. and Lenhart, S. (2006) Tem-perature-Independent Diel Variation in Soil Respiration Observed from a Tempe-rate Deciduous Forest. Global Change Biology, 12, 1-10.
https://doi.org/10.1111/j.1365-2486.2006.01245.x
[87] Inoue, T. and Koizumi, H. (2012) Effects of Environmental Factors upon Variation in Soil Respiration of a Zoysia japonica Grassland, Central Japan. Ecological Re-search, 27, 445-452. https://doi.org/10.1007/s11284-011-0918-0
[88] Dhital, D., Inoue, T. and Koizumi, H. (2014) Seasonal/Inter-Annual Variations of Carbon Sequestration and Carbon Emission in a Warm-Season Perennial Grass-land. Journal of Ecosystems, 2014, Article ID: 729294.
[89] Gupta, S.R. (1981) Soil Respiration in a Tropical Grassland. Soil Biology and Bio-chemistry, 13, 261-268. https://doi.org/10.1016/0038-0717(81)90060-2
[90] Redmann, R.E. (1978) Soil Respiration in a Mixed Grassland Ecosystem. Canadian Journal of Soil Science, 58, 119-124. https://doi.org/10.4141/cjss78-015
[91] Polley, H.W., Frank, A.B., Sanabria, J. and Phillips, R.L. (2008) Interannual Varia-bility in Carbon Dioxide Fluxes and Flux-Climate Relationships on Grazed and Ungrazed Northern Mixed-Grass Prairie. Global Change Biology, 14, 1620-1632. https://doi.org/10.1111/j.1365-2486.2008.01599.x
[92] Wang, D., Wu, G.L., Zhu, Y.J. and Shi, Z.H. (2014) Grazing Exclusion Effects on Above- and Below-Ground C and N Pools of Typical Grassland on the Loess Pla-teau (China). Catena, 123, 113-120. https://doi.org/10.1016/j.catena.2014.07.018 [93] Garcia-Pausas, J., Casals, P., Romanya, J., Vallecillo, S. and Sebastia, M.T. (2011)
Seasonal Patterns of Belowground Biomass and Productivity in Mountain Grass-lands in the Pyrenees. Plant and Soil, 340, 315-326.
https://doi.org/10.1007/s11104-010-0601-1
[94] McSherry, M.E. and Ritchie, M.E. (2013) Effects of Grazing on Grassland Soil Car-bon: a Global Review. Global Change Biology, 19, 1347-1357.
https://doi.org/10.1111/gcb.12144
[95] Geng, Y., Wang, Y., Yang, K., Wang, S., Zeng, H., Baumann, F., Kuehn, P., Schol-ten, T., Jin, S. and He, J.S. (2012) Soil Respiration in Tibetan Alpine Grasslands: Be-lowground Biomass and Soil Moisture, but Not Soil Temperature, Best Explain the Large-Scale Patterns. PLoS ONE, 7, e34968.
DOI: 10.4236/jep.2019.102017 314 Journal of Environmental Protection [96] Hao, Q. and Jiang, C. (2014) Contribution of Root Respiration to Soil Respiration in a Rape (Brassica campestris L.) Field in Southwest China. Plant, Soil and Environ-ment, 60, 8-14. https://doi.org/10.17221/425/2013-PSE