INFLUENCE OF CONSTITUENCY DEVELOPMENT FUND ON QUALITY OF EDUCATION IN PUBLIC
SECONDARY SCHOOLS IN KENYA: A CASE STUDY OF KISUMU
*,1
Carren Akoth Olendo
1
Department of Educational Management and Foundations, Maseno University, Kenya
2
Department of Education Psychology, Maseno University, Kenya
ARTICLE INFO ABSTRACT
In the year 2003, the government of Kenya adopted devolved system of funding of education through the Constituency Development Fund in order to
Constituency Development Fund being a form of composite fund, finances education in public secondary schools by providing bursary to needy students and developing infrastructure. This study focused on qual
Secondary Education examination. Public secondary schools in Kisumu County receive money from Constituency Development Fund but statistics show that performance is still lo
instance, public secondary schools in Kisumu County received money from Constituency Development Fund amounting to Kenya Shillings 120,000 per school as minimum to Kenya Shillings 5,000,000 as maximum depending on their needs. Conve
5.63 during that which was even lower than the national one which stood at 6.1. It was also not clear whether all public secondary schools in the county had the necessary infrastructural facilities which are cruc
establish the influence of Constituency Development Fund on Quality of Secondary Education in Public Secondary Schools in Kisumu County. The findings indicated that
Fund had influence on student’s performance in Kenya Certificate of Secondary Education Examination. The study also confirmed the availability of the necessary infrastructural facilities constructed by Constituency Development Fun
Several students in the county were being awarded some bursaries by the Constituency Development Fund. The study recommended that Constituency Development Fund should consistently give enough bursaries to n
studies which would eventually lead to good performance in examinations thereby improving quality of education. More funds should also be allocated for infrastructure d
still lacked the facilities and projects started using Constituency Development Fund money should be completed on time. This study is important because it provides useful information on the influence Constituency Development Fun
Copyright©2016, Carren Akoth Olendo et al. This is an open access article distributed under the Creative Commons Att unrestricted use, distribution, and reproduction in any medium, provided the original work is properly cited.
INTRODUCTION
Every government worldwide has a responsibility to invest in education as a matter of priority in order to enhance students’ academic performance for fulfillment of national objectives in all sectors of the economy. According to (Okumbe, 1999), this will ensure effective operations of school systems in as far as proper use of infrastructural resources is concerned. The Policy Frameworks for Education on Aligning Education and
*Corresponding author: Carren Akoth Olendo,
Department of Educational Management and Foundations, Maseno University, Kenya.
ISSN: 0975-833X
Article History:
Received 19th May, 2016
Received in revised form
10th June, 2016
Accepted 15th July, 2016
Published online 20th August,2016
Key words:
Influence,
Constituency Development Fund, Quality of Education.
Public Secondary Schools, Kisumu County, Kenya.
Citation: Carren Akoth Olendo, Maureen A. Olel and John O. Agak
public secondary schools in Kenya: A case study of Kisumu county
RESEARCH ARTICLE
INFLUENCE OF CONSTITUENCY DEVELOPMENT FUND ON QUALITY OF EDUCATION IN PUBLIC
SECONDARY SCHOOLS IN KENYA: A CASE STUDY OF KISUMU
Carren Akoth Olendo,
1Maureen A. Olel and
2John O. Agak
Department of Educational Management and Foundations, Maseno University, Kenya
Department of Education Psychology, Maseno University, Kenya
ABSTRACT
In the year 2003, the government of Kenya adopted devolved system of funding of education through the Constituency Development Fund in order to promote quality of education in secondary schools. Constituency Development Fund being a form of composite fund, finances education in public secondary schools by providing bursary to needy students and developing infrastructure. This study focused on quality of education in terms of students’ academic performance in Kenya Certificate of Secondary Education examination. Public secondary schools in Kisumu County receive money from Constituency Development Fund but statistics show that performance is still lo
instance, public secondary schools in Kisumu County received money from Constituency Development Fund amounting to Kenya Shillings 120,000 per school as minimum to Kenya Shillings 5,000,000 as maximum depending on their needs. Conversely, the county had a mean performance of 5.63 during that which was even lower than the national one which stood at 6.1. It was also not clear whether all public secondary schools in the county had the necessary infrastructural facilities which are crucial for effective teaching and learning process. The purpose of this study therefore was to establish the influence of Constituency Development Fund on Quality of Secondary Education in Public Secondary Schools in Kisumu County. The findings indicated that
Fund had influence on student’s performance in Kenya Certificate of Secondary Education Examination. The study also confirmed the availability of the necessary infrastructural facilities constructed by Constituency Development Fund in many public secondary schools in the county. Several students in the county were being awarded some bursaries by the Constituency Development Fund. The study recommended that Constituency Development Fund should consistently give enough bursaries to needy students. This will enable them spend more time in school and concentrate in their studies which would eventually lead to good performance in examinations thereby improving quality of education. More funds should also be allocated for infrastructure d
still lacked the facilities and projects started using Constituency Development Fund money should be completed on time. This study is important because it provides useful information on the influence Constituency Development Fund has on quality of secondary education in public secondary schools.
is an open access article distributed under the Creative Commons Att use, distribution, and reproduction in any medium, provided the original work is properly cited.
Every government worldwide has a responsibility to invest in education as a matter of priority in order to enhance students’ academic performance for fulfillment of national objectives in all sectors of the economy. According to (Okumbe, 1999), this nsure effective operations of school systems in as far as proper use of infrastructural resources is concerned. The Policy Frameworks for Education on Aligning Education and
nt and Foundations, Maseno
Training to The Constitution of Kenya (2010) and Kenya Vision 2030 and Beyond Draft Bill (2012), lays great emphasis on improving quality and relevance of education. In Kenya, free secondary education led to mushrooming of many day schools to accommodate the upsurge in enrolment in secondary schools and most of these upcoming schools are either sponsored by the Constituency Development Fund (CDF), parents or communities. The old well established schools too enrolled quite a number which outstretched the exi infrastructure and because of this pressure, provision of quality education has been compromised. The Constituency Development Fund is one of the innovations of the government International Journal of Current Research
Vol. 8, Issue, 08, pp.36588-36601, August, 2016
INTERNATIONAL
Maureen A. Olel and John O. Agak, 2016. “Influence of constituency development fund on quality of education in
secondary schools in Kenya: A case study of Kisumu county”, International Journal of Current Research, 8, (08),
INFLUENCE OF CONSTITUENCY DEVELOPMENT FUND ON QUALITY OF EDUCATION IN PUBLIC
SECONDARY SCHOOLS IN KENYA: A CASE STUDY OF KISUMU COUNTY
John O. Agak
Department of Educational Management and Foundations, Maseno University, Kenya
Department of Education Psychology, Maseno University, Kenya
In the year 2003, the government of Kenya adopted devolved system of funding of education through promote quality of education in secondary schools. Constituency Development Fund being a form of composite fund, finances education in public secondary schools by providing bursary to needy students and developing infrastructure. This study ity of education in terms of students’ academic performance in Kenya Certificate of Secondary Education examination. Public secondary schools in Kisumu County receive money from Constituency Development Fund but statistics show that performance is still low. In the year 2012 for instance, public secondary schools in Kisumu County received money from Constituency Development Fund amounting to Kenya Shillings 120,000 per school as minimum to Kenya Shillings rsely, the county had a mean performance of 5.63 during that which was even lower than the national one which stood at 6.1. It was also not clear whether all public secondary schools in the county had the necessary infrastructural facilities which ial for effective teaching and learning process. The purpose of this study therefore was to establish the influence of Constituency Development Fund on Quality of Secondary Education in Public Secondary Schools in Kisumu County. The findings indicated that Constituency Development Fund had influence on student’s performance in Kenya Certificate of Secondary Education Examination. The study also confirmed the availability of the necessary infrastructural facilities d in many public secondary schools in the county. Several students in the county were being awarded some bursaries by the Constituency Development Fund. The study recommended that Constituency Development Fund should consistently give enough eedy students. This will enable them spend more time in school and concentrate in their studies which would eventually lead to good performance in examinations thereby improving quality of education. More funds should also be allocated for infrastructure development in schools which still lacked the facilities and projects started using Constituency Development Fund money should be completed on time. This study is important because it provides useful information on the influence
d has on quality of secondary education in public secondary schools.
is an open access article distributed under the Creative Commons Attribution License, which permits
Training to The Constitution of Kenya (2010) and Kenya Vision 2030 and Beyond Draft Bill (2012), lays great emphasis on improving quality and relevance of education. In Kenya, free secondary education led to mushrooming of many day he upsurge in enrolment in secondary schools and most of these upcoming schools are either sponsored by the Constituency Development Fund (CDF), parents or communities. The old well established schools too enrolled quite a number which outstretched the existing infrastructure and because of this pressure, provision of quality education has been compromised. The Constituency Development Fund is one of the innovations of the government
INTERNATIONAL JOURNAL OF CURRENT RESEARCH
of Kenya. Established in 2003 through an act of parliament, the government’s major initiative was to create impact on peoples’ lives at the grassroots through this fund (Republic of Kenya, 2003). This fund was entrenched in the constitution through the CDF Act of 2003 in the Kenya Gazette supplement number 107 Act No. 11, (Republic of Kenya 2004). In education, one of the major objectives of CDF was to enhance quality of secondary education through creating capacity for improved enrolment and to ensure transition and completion rates through provision of bursary to needy students in addition to developing school infrastructure. CDF has become the most popular form of devolved funding in Kenya (Republic of Kenya, 2003). The CDF funded projects have already taken ground especially in key areas as shown in Table 1.
Table 1. The Projects Funded by CDF
Projects Percentage
Education sector 33.9
Education bursary 12.3
Health 6.5
Water 11.5
Roads and budgets 6.2
Security 4.0
Agriculture 1.3
Other (M & E, Emergency, Recurrent, Sports 24.3
Source: Republic of Kenya 2003.
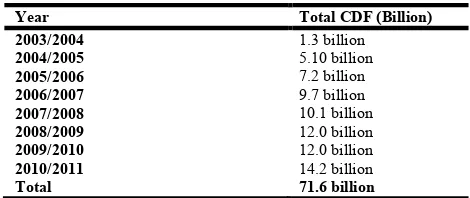
Initially, about 2.5% of the total revenue was channeled to it so as to reach the constituencies and was managed by a parliamentary committee at the grassroots level. This allocation was later increased to 7.5% (Ochieng & Tubey, 2013) and therefore it meant that a lot of financial resources are being channeled to constituency projects, of which education takes almost 34% of the total share (IEA, 2006). The government has therefore allocated huge sums of money to all constituencies in Kenya through CDF since its inception in 2003 as shown in Table 2.
Table 2. Total allocation of CDF between 2003 to 2011
Year Total CDF (Billion)
2003/2004 1.3 billion
2004/2005 5.10 billion
2005/2006 7.2 billion
2006/2007 9.7 billion
2007/2008 10.1 billion
2008/2009 12.0 billion
2009/2010 12.0 billion
2010/2011 Total
14.2 billion
71.6 billion
Source: Republic of Kenya 2003.
From Table 2, it can be seen that large sums of money have been allocated to constituencies in Kenya through CDF and hence the need to assess its influence on quality of secondary education. More than 60,000 CDF projects have been established throughout the country and a big percentage (40%) are in the area of education (Republic of Kenya, 2003).
Kisumu County was chosen for this study for reasons that its statistics depict rather lower standards in terms of quality in performance in Kenya Certificate of Secondary Education compared to national standards. Moreover compared to some of its neighboring counties such as Siaya, Vihiga, Kericho,
[image:2.595.304.565.338.427.2]Homabay and Nandi as shown in Table 2, Kisumu County trailed behind in terms of Kenya Certificate of Secondary Education Performance in the year 2012. While the Mean Scores for Nandi and Homabay Counties were 5.80 and 6.17 respectively, Kisumu County had a Mean Score of 5.63, which was even lower than the National Mean Score in the same year which stood at 6.10. On poverty rates, available statistics indicate that Kisumu has the lowest percentage. At a rate of 45.0% Kisumu poverty level is only higher than that of Kericho which is 42.8% and Vihiga which is 41%. The rest of the neighboring counties namely Siaya (47.6%), Homabay (50.2) and Nandi (47.4%) have higher poverty rates. It would be argued therefore that with lower poverty rates, schools within the county would have better and equipped facilities than those counties whose poverty rates were higher. The assumption here would be that parents of schools in the county would pay their fees as expected and therefore those facilities funded by parents would be completed in time. The Constituency Development Fund would therefore only act as a booster and expand the existing facilities or improve on them.
Table 3. Data on Poverty Rates, Literacy Levels and Performance in Kenya Certificate of Secondary Education for National and
Counties neighboring Kisumu County in 2012
Counties Rates (%) Poverty level (%) Literacy Performance in Kenya Certificate of Secondary Education
Kisumu 45.0 72.2 5.63
Siaya 47.6 78.4 7.22
Kericho 42.8 79.0 5.89
Vihiga 41.0 84.2 6.30
Nandi 47.4 76.4 5.82
Homa Bay 50.2 76.5 6.17
National 45.9 79.1 6.10
Source: The County Governments Survey Data (2013)
This however is not the case because schools in the neighboring counties are doing better than Kisumu County in terms of performance in Kenya Certificate of Secondary Education Examinations. CDF allocates money equally to the existing constituencies and a small percentage is allocated to the constituencies according to their poverty rates. Since Kisumu County has been one of the beneficiaries of CDF there is no justification why it should lag behind other counties when it comes to performance in Kenya Certificate of Secondary Education examinations. This therefore justified that an investigation needed to be carried out to establish whether CDF has achieved its intended objective of improving quality of education using Kisumu County as the site for the study.
Research objective: To Establish the Influence of Constituency Development Fund on Quality of Education in Public Secondary Schools in Kisumu County.
Synthesis of literature on influence of devolved fund (constituency development fund) on quality of secondary school education
[image:2.595.44.279.505.604.2]UNICEF (2000), quality education includes learners who are healthy, well nourished and ready to learn with the support of their families and communities, safe, healthy, protective and gender sensitive environments, not to mention provision of adequate learning resources and facilities to support them. It also encompasses well-managed classrooms and schools in order to facilitate learning and reduce disparities. Other scholars have associated quality education with good performance in examinations where it is defined in terms of students’ achievement in talented disciplines (Broh, 2002). According to World Bank (World Bank, 2005) learning assessments are crucial for measuring education quality and relevance since they diagnose system weaknesses and motivate policy reforms. Quality of secondary school education is therefore measured in terms of standards of inputs and output. The inputs include resources, time, human effort and learning materials among others while output is measured in terms of academic achievement as signified by performance in national examinations. As noted by World Bank(World Bank 2005) students’ performance can be affected by shabby school buildings, lack of science laboratories, inadequate ventilations, lack of clean water, lack of proper lighting and faulty heating systems.
According to Center for International Development (Center for International Development, 2009), education quality is valued the world over and in the wake of decentralization, many countries endeavor to remain relevant by devolving funds in the area of education to meet their expected goals. It states that decentralization policies directly influence quality of education in different nations as part of a lager reform promoted by educators through different devolved processes. In the United States, school councils and school directors have been given greater decision making autonomy to run education affairs. At the same time the performance of those schools is carefully monitored, and they are held accountable for improved performance to both parents and system administrators, hence ensuring provision of quality education. In the United Kingdom the government has taken the initiative to enhance and improve quality education by creating Local Education Authorities (LEA) in England and Wales and Education Authorities (EA) in Scotland. In Northern Ireland although education is a central government function, local authorities have a consultative role through the education and library boards and matters pertaining to school curriculum and assessment, have been devolved including budget management and the appointment of councils to school governing bodies. All these are done so that quality of education can be improved in the United Kingdom. Andrian (2010) carried out a study on Measuring Educational Quality in Secondary Education in Schools in the Netherlands. The main objectives were to assess the important factors used in achieving quality education in schools in the Netherlands by using a business intelligence approach and to identify stakeholders and relevant components relevant to education quality. Using semi structured interviews and questionnaires for collecting data and a survey research design; the study developed and produced a framework which consisted of seven critical success factors measured through key performance indicators. The findings of the study indicated that the most important stakeholders that should be included in measuring education quality were teachers,
students, school management boards and parents. The results further revealed that factors that affect quality education in schools in the Netherland included curriculum, teacher quality, students and the circumstances or environment where the education process is being conducted. Although the study dwelt on quality of secondary education, it was done in the Netherland and ignored the aspect of financing education through devolved funding such as Constituency Development Fund and its influence on education quality especially when it is used to construct infrastructural facilities in schools.
In Indonesia, studies carried out by Suryahadi and Sambodho (2013) revealed that quality of education in that country was being challenged by factors such as inadequate facilities, poor quality of teachers and their constant absenteeism from school. They noted that only 37% of teachers had the right teaching qualifications as defined by the 2005 Teacher Law. It was a worrying trend that close to 15% of teachers were usually absent from their classes in Indonesia. Another study conducted in South African schools titled ‘The Basic Education Report’ (2010), indicated that performance in those schools improved by 72% in 2010 compared to 2009 and this was due to the initiatives put in place by the government through some form of devolved funding to ensure that quality education was being achieved. In India, quality education has not been achieved. A report by Nanda (2014) indicates that despite levying a tax to fund education and enacting a law to ensure access to education for all children, the government has not succeeded in improving learning outcomes and quality in education still remains a dream. This has therefore placed schools in India on the limelight as the government seeks other desperate measures to ensure quality of education is achieved. A study carried out in Malawi on access and quality of secondary education found out that the two were being hampered by a number of factors, such as inadequate and inaccessible infrastructure like classrooms, teachers` houses, toilets and water. There were also issues of inadequate and unqualified teachers, insufficient learning materials and curricular which did not address the needs of the learners in terms of skills and development. It further noted that while innovation at the national level such as the introduction of free primary education, school feeding programs and abolishing school uniforms led to greater access in terms of higher enrolment, it led to adverse effects on quality of education due to high teacher/pupil ratio (Malawi Millennium Development Goals, 2012).
Since it may not be easy to conduct effective teaching and learning of science subjects without the use of laboratories, the study concluded that lack of laboratory facilities was a major contribution to poor performance in Kenya Certificate of Secondary Education examinations. This was because candidates could not effectively answer questions impractically in those subjects. Her views were supported by Wambua (2011) who argues that investing in infrastructure in education is based on the assumption that infrastructural facilities improve performance in examinations since there is a positive correlation between school input and achievement. The Republic of Kenya (2012), states that at least 80% of learners leaving public secondary schools fail to attain the minimum C plus entry cut off points to join Kenyan public universities and relates this to the high student-teacher ratio and poor infrastructural and learning facilities found in most of these schools. With these large class sizes and competing resources, parents with financial means pull their children from public schools and enroll them in private schools in a bid to boost their academic performance. Financial resources are therefore very crucial inputs when it comes to determining quality in education. This is why globally governments have made efforts to subsidize the cost of education by either introducing free and subsided education policies like FPE and FDSE or devolved systems of funding such as Constituency Development Fund.
The situation in Malawi is similar to that in Kenya. When the government introduced Free Primary Education in 2003 the enrolment rose from 5.9 to 7.2 million but most schools were not equipped to handle such large number of pupils in terms of teachers, physical facilities, classroom space and learning resources. This scenario replicated itself when Free Secondary Education was later introduced in 2008. According to Oduro (2010) and Adan & Orodho (2013), Subsidized Secondary Education Programme introduced in 2008 created many problems. Although access was improved by increasing enrolment every year, the infrastructure was overstretched and so was manpower. Overcrowded classrooms due to increased number of students were a common feature in many public secondary schools in Kenya where facilities were inadequate. The student-teacher ratio shot to such high rates that it resulted in a decline in quality of education. This was mainly due to reduced interactivity between teachers and the students and therefore had spillover effects on their ultimate academic performance which determined their entry into the next levels. They concluded that SSE was neither efficient nor effective in providing quality education in Kenya. They therefore recommended that increased funding to secondary schools should be made through other means in order to put up more facilities and purchase the vital instructional resources geared towards enhancing students’ academic performance. The Constituency Development Fund which had been introduced in 2003 was seen as the alternative method to financing secondary education. This was going to improve funding to schools which would make notable impact in construction of school infrastructural facilities (Republic of Kenya, 2007) and therefore enhance quality of secondary education in Kenya.
Several studies have been conducted regarding the use of Constituency Development Fund. A study by Murage (2008)
looked at ways CDF promotes secondary education in Laikipia District and concluded that it had helped develop school facilities such as classrooms, laboratories, electricity and water which improved on access to secondary education in the district. However, expansion of school facilities alone may not impact on quality without the provision of the necessary teaching and learning resources. Moreover, the study did not relate these to quality in terms of students’ performance in Kenya Certificate of Secondary Education examinations but only but only dwelt on access to secondary education. Lukibia (2009) carried out a study on the role of CDF in the Financing of Physical Facilities in Public Secondary Schools in Lugari Constituency, Kakamega County. His main objective was to investigate the role played by CDF in funding public secondary schools physical projects within the constituency in order to improve quality. The study revealed that CDF has been used to improve physical facilities in public secondary schools in Lugari Constituency. However, Akala (2010) states that quality in education can only be achieved and maintained with proper curriculum implementation which is best done by trained teachers within the environment of improved facilities. His views were supported by Wakaba (2013) who asserted that in order to improve quality, money acquired from Constituency Development Fund should be used to organize and sponsor teachers to attend workshops and seminars so as to improve on their delivery skills as this will improve the interaction between the learner and the teacher and finally impact on students’ academic performance. It is important to help schools construct such vital facilities because their availability and suitability are very vital in the provision of
quality education. The contribution of Constituency
Development Fund as a financier to secondary education cannot therefore be ignored amidst the escalating costs of secondary education today.
Research methodology
regression analysis. Qualitative data was transcribed and analyzed in emergent themes and subthemes.
Conceptual framework
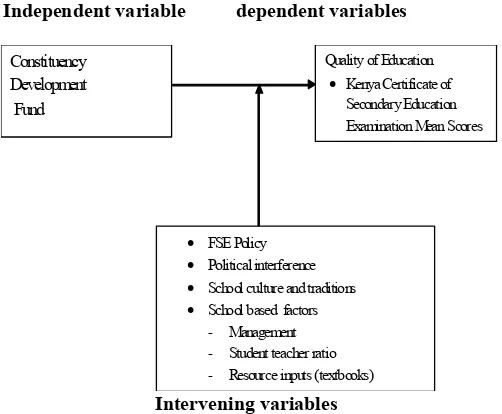
The study was guided by a conceptual framework based on the theory of Socialist Economics in Education. The concept by Selowsky (1979) states that income from the rich when redistributed from the rich to the poor creates equality. According to the socialist economics of education theory, awarding bursary to needy students and allocating money to schools for infrastructural development can enhance quality of secondary education in those schools. However if education was offered without awarding bursaries to needy students, only those who can afford to pay school fees and other related costs would be in school. Likewise if schools that are less endowed with facilities were not assisted by funds from CDF to improve their infrastructure, they will continue lagging behind in terms of performance in examinations. In this conceptual framework, CDF is taken as state income which can be redistributed to enhance quality in education by awarding bursaries and helping the disadvantaged benefit from education as much as the advantaged. The conceptual framework postulates that when CDF is used to pay fees for needy students through bursary allocation, they will remain within the school gates. Their learning process will not be interfered with by constantly being sent away due to lack of school fees, they will not drop out of school and therefore will reach completion rates. This will enable them concentrate in their studies and do well in examinations thereby achieving quality grades. If Constituency Development Fund is used to construct more and better infrastructural facilities in schools, then learning environment will be enhanced and this will lead to quality in education. This information is illustrated in Fig 1.
Independent variable dependent variables
[image:5.595.328.533.243.305.2]Intervening variables
Fig. 1. Conceptual Framework showing the Influence of Constituency Development Fund on Quality of Secondary Education
RESULTS
This section presents results on school data and demographic characteristics of respondents that were used in the study. Areas considered under school data were category of schools,
distribution of schools by gender of students, types and amount of money given by CDF for infrastructural development. Demographic characteristics of respondents which were considered in the study were those of school principals and form four students who were CDF bursary recipients.
School data
The study sought to establish the various categories of schools whose respondents were involved in the study. School category was believed to be an important aspect in exploring the influence of CDF on quality of secondary education in public schools. The findings are presented on Table 4.
Table 4. Category of Public Schools in Kisumu County (n=124)
School Frequency Percentage
National 2 1.6
Extra county 12 9.7
County 20 16.1
Sub- county 90 72.6
Total 124 100.0
Source: Field data (2015)
The findings in Table 4 reveal that most of the schools in Kisumu County were in the category of sub-county schools which totaled to 90(72.6%). They were followed by county schools which were 20(16.1%) as reflected by the number of the principals who took part in the study. It was also noted that there were only 2(1.6%) national schools found in the county, while extra county schools were 12(9.7%). This information was important because it reflected the fact on the ground that majority of these schools are normally started using money from the Constituency Development Fund and this money usually goes towards infrastructural development. The county, extra county and national schools receive more funds in form of bursary depending on the number of students found in those schools.
[image:5.595.39.290.459.666.2]The study sought to establish the distribution of public schools in Kisumu County by gender of students. This information was presented in Table 5.
Table 5. Distribution of Public Schools in Kisumu County by Gender of Students (n=124)
Gender of School Frequency Percent
Boys 13 10.6
Girls 18 14.6
Mixed 93 75.0
Total 124 100.0
Source: Field data (2015)
The findings from Table 5 show that majority of public schools in Kisumu County were mixed secondary schools. The mixed schools were 93(75.0%) thereby giving an opportunity to both boys and girls to acquiring secondary education. They were followed by girls schools which were 18(14.6 %) and the remaining 13(10.6%) were boys schools. The study sought to establish the various types of schools whose respondents were involved in the study. This information was presented in Table 6.
Quality of Education
Kenya Certificate of
Secondary Education Examination Mean Scores
Constituency Development Fund
FSE Policy
Political interference
School culture and traditions
School based factors
- Management
- Student teacher ratio
[image:5.595.317.545.586.637.2]Table 6. Type of Public Schools in Kisumu County (n=124)
Type of School Frequency Percent
Day 70 56.5
Boarding 26 20.9
Day & boarding 28 22.6
Total 124 100.0
Source: Field data (2015)
The findings from Table 6 revealed that majority, 70 (56.5%) of the public secondary schools that were involved in the study were day schools followed by day &boarding schools which were 28(22.6). The remaining were boarding schools which totaled to 26(20.9%). This means that the sources of data got from the schools had adequate information on the use of Constituency Development Fund and its implication on students’ academic performance. The findings of the study corroborate the earlier findings which were presented in Table 4 and Table 5 that sub-county schools and mixed day schools took the lead in the county, respectively. This is true because sub- county schools, due to their limited infrastructure, generally are day mixed schools.
[image:6.595.306.561.201.262.2]
The study sought to establish the total amount of CDF money allocated to public secondary schools in Kisumu County for infrastructure and bursary between 2009 and 2013. This information is presented in Table 7.
Table 7. Total Amount of CDF money allocated to Public Secondary Schools in Kisumu County for Infrastructure and
Bursary between 2009 and 2013
Year N Minimum
Kshs.
Maximum Kshs.
Total Kshs. 2009 37 144,000.00 2,620,000.00 42,015,464.00
2010 37 237,500.00 3,009,000.00 42,672,928.00
2011 39 160,000.00 5,343,000.00 44,548,143.00
2012 51 120,000.00 5,349,000.00 60,600,730.00
2013 40 240,000.00 7,020,000.00 60,388,260.00 Source: Field data (2015)
Key: N= number of schools Kshs. = Kenya Shillings
Table 7 shows the total amount of CDF money allocated to schools for both infrastructure and bursary between 2009 and 2013. It indicates that the total amount of money disbursed to public secondary schools that took part in the study was highest in the year 2012 (Kshs. 60,600,730) followed by the year 2013 (Ksh. 60, 388,260). The lowest amount was awarded in 2009(Kshs. 42, 015, 464) followed by 2010(Kshs. 42, 672,928) and finally 2011(Kshs. 44,548,143). Table 7 therefore reveals that there was a rising trend in the amount of CDF money disbursed to public secondary schools between 2009 and 2012 although there was a slight drop in the year 2013.This information is important because it provides evidence that CDF is really disbursed to schools depending on their needs in terms of infrastructure and bursaries to needy students. The disparity in the disbursement could mean that there are schools which get more money than others. Such schools are therefore bound to meet more of their requirements and perform better than their counterparts which receive less yet are less endowed with resources. This may therefore not impact positively on performance in those schools. The bursaries for instance are meant for the needy and bright
students who are mostly found in national, extra- county and county schools. This is in line with observation that schools that received more money performed well in both infrastructural development and academic achievement. The study sought to establish the total Amount of money allocated for classrooms construction by CDF in Public Secondary Schools in Kisumu County Between 2009-2013.
This information was presented on Table 8.
Table 8. Total Amount of Money allocated for Classroom Construction by CDF in Public Secondary Schools in
Kisumu County between (2009-2013)
Year N Minimum Maximum Total
2009 34 40,000 6,000,000 30,140,000
2010 29 250,000 15,000,000 32,100,000
2011 28 60,000 1,500,000 14,860,000
2012 41 50,000 4,000,000 33,443,000
2013 24 100,000 3,800,000 22,700,000
Source: Field data (2015)
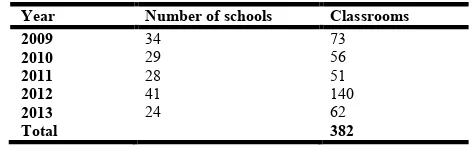
[image:6.595.35.289.408.479.2]The findings from Table 8 show that the year 2012 had the highest total amount of money allocated for classroom projects. In that year alone a total of Kshs. 33,443,000/= was spent in classroom construction in 41 secondary schools with a minimum amount received ranging from Kshs. 50,000 to Ksh. 4, 000,000 from CDF. On the other hand, the year 2011 had the least expenditure on classroom projects; only Ksh.14, 860, 000 was allocated for construction of classrooms in 28 secondary schools in the county in that year. During this year public secondary schools received money ranging from Ksh 60,000 to Ksh. 1,500,000. The findings further revealed that in the year 2010, Kshs. 32,100,000 was spent on classrooms construction in 29 schools. This was the largest allocation after the year 2012, but the fewer number of classrooms constructed could have been due to quality of classroom. While some schools strictly follow the Ministry of Public Works guidelines while constructing classroom, others may not and therefore decide to construct classrooms which are cheaper. Kisumu County has schools which are found in areas with different types of soil texture, and therefore this may cause variation in the amount of money spent in constructing classrooms. The same reason may be used to inversely explain the amount of money spent in the year 2009 when a total of Kshs. 30,140,000 was used to construct classrooms in 34 public secondary schools in the county. The study specifically sought to establish the actual number of classrooms built using CDF funds in the aforementioned schools between the years 2009 -2013. This information was important because it was used to confirm the utilization of CDF monies on physical facilities and instructional materials as envisaged in the introduction of CDF. The findings were presented in Table 9.
Table 9. Number of Classrooms built by CDF in Public Secondary Schools between 2009-2013 in Kisumu County
Year Number of schools Classrooms
2009 34 73
2010 29 56
2011 28 51
2012 41 140
2013 24 62
Total 382
[image:6.595.313.550.671.744.2]From Table 9, the study established that the highest number of classrooms was built in the year 2012. In this year alone, new 140 classrooms were built in 41 public secondary schools followed by the year 2009 which had 73 classrooms being constructed. This findings concur with the results in Table 9, which had indicated that the year 2012 had the highest amount of money allocated for classroom projects, the total allocation being Ksh 33,443,000/= in the sampled secondary schools within the county. On the same note, it was established that the year 2011 had the least number of classrooms built; only 51 new classrooms were completed in 28 public secondary schools in the county. The findings further concur with the opinion of one CDF Managers who while being interviewed, stated that; “A lot of money has left our kitty towards construction of new classroom particularly in the secondary schools which had existed before CDF was started” This statement implies that a lot of CDF funds were allocated towards classroom projects in the schools. It therefore means that the existence of these classrooms went along way in improving quality because students were now able to study in a conducive environment within the comfort of a classroom away from the variation of extreme weather conditions just like one of them confirmed during focus group discussion that; “The new Classroom has really helped us because we were learning under a tree. In fact learning under a tree was not comfortable for us especially during rainy seasons or when the sun was very hot and so many of us were not able to concentrate during the lesson.”
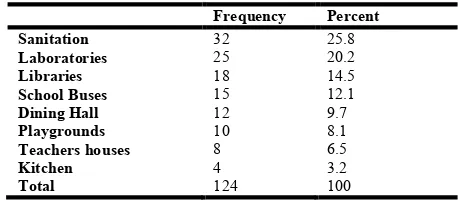
[image:7.595.311.555.121.209.2]The study sought to establish whether there were other facilities funded by CDF apart from classrooms. This information was given by the principals and their views were as presented in Table 10.
Table 10. Infrastructural Facilities constructed by CDF other than Classrooms in Public Secondary Schools in Kisumu
County (n=124)
Frequency Percent
Sanitation 32 25.8
Laboratories 25 20.2
Libraries 18 14.5
School Buses 15 12.1
Dining Hall 12 9.7
Playgrounds 10 8.1
Teachers houses 8 6.5
Kitchen 4 3.2
Total 124 100
Source: Field data (2015).
The findings from Table 10 indicate that sanitation facilities took the lead totalling to 32(25.8%) followed by laboratories which were 25(20.2%) and libraries 18(14.5%). Constituency Development Fund had also assisted secondary schools to purchase school buses totalling to 15(12.1%) and construct dining halls 12(9.7%). The other infrastructural facilities financed by CDF were play grounds 10(8.1%), teachers houses 8(6.5%) and kitchens 4(3.2%). Data from this table helps in the understanding that infrastructural facilities are put in place to create a conducive learning environment for students in enhancement of their academic achievement. It therefore gives evidence that Constituency Development Fund actually
[image:7.595.46.275.486.586.2]disbursed money to public secondary schools in Kisumu County for the development of infrastructural facilities.
Table 11. Public Secondary School Students’ Academic Performance in Kisumu County 2009 – 2013 Period
Mean Score Frequency Percent
1.00-2.44 2.45- 4.44 4.45-6.44 6.45-8.44 8.45-10.44 Total
28 22.6 14 11.3 42 33.9 30 24.2 10 8.0 124 100.0 Source: Field data (2015)
From Table 11, it can be observed that the students’ academic performance for the period 2009-2013 range from 1.00-2.44 to 8.45-10.44. Majority of the students’ mean scores were in the range 6.45-8.44 and 4.45-6.44. These are students who benefitted from CDF funding in a way or another. Consequently, CDF funding had an effect on their performance.
Demographic characteristic of respondents
This section presents data on demographic characteristics of two categories of respondents who were identified as school principals and form four students who were CDF bursary beneficiaries. The demographic information of the principals and students was seen to be important in this study given that both of them formed the integral component of the study.
The demographic characteristics of the principals which were considered in this section therefore included their level of academic qualification, years served as principals in their current and in previous stations. Students’ demographic characteristics included gender, order of birth and year of admission into the school. All this information was considered important because it gave greater insight on understanding the relationship between the variables.
Distribution of School Principals by Academic
Qualification
The study sought to establish the academic qualifications of the Principals as respondents. They were asked to state their academic qualifications which were considered important because it would help to establish their competence as leaders in management issues in their schools. The findings are presented in Table 12.
Table 12. Distribution of Principals by their Academic Qualification (n=124)
Level of Education Frequency Percent
Bachelors degree 87 70.2
Masters 28 22.6
Diploma 9 7.3
Total 124 100.0
Source: Field data (2015)
[image:7.595.321.540.679.731.2]The findings from Table12 revealed that most of the Principals in Kisumu County held at least a Bachelors degree. Those with Bachelors degree were 87(70.2%) while 28 (22.6%) of them had a Master’s degree. There were only 9(7.3%) of the principals who took part in the study who had diploma qualifications. This information is important because it enhances the credibility of the responses given. The Masters and BED holders are more conversant with the disbursement and utilization of devolved funds as some of them were beneficiaries of the fund.
Period of Principals’ Stay in their Current Schools
[image:8.595.332.524.258.330.2]The study sought to investigate the number of years the principals had taken in their current schools. This information was necessary because the accuracy of information from the principals on the influence of CDF on quality of education may depend on their familiarity with the CDF activities in the school. Moreover the length of their stay in the school also determines the kind of infrastructure the school may have constructed depending on the needs of the school at the time. They were also well informed and therefore were able to explain the impact of CDF on students’ academic performance based on trends since its inception in 2003. This information was presented in Table 13.
Table 13. Period of Principals’ Stay in their Current schools n=124
Length of Stay in Current School Frequency Percent
Below 4yrs 57 46.0
4-6 Years 42 33.9
7-9 Years 18 14.5
Above 9 years 7 5.6
Total 124 100.0
Source: Field data (2015)
The findings from Table 13 indicated that 57(46.0%), of the principals who participated in the study had stayed in their current stations for a period below 4 years. Those who had served in the same school for between 4-6 years were 42(33.9%) while those who had been in the same school between 7 to 9 years were 18(14.5%). Only a small number for 7(5.6%) had stayed in their current stations for more than 9 years.
Period of Principals’ Stay in their Previous Schools
The study sought to establish the length of time the principals had stayed in their previous stations. This information was essential in gauging the level of principals’ experience which was considered an important quality of their participation in the study. Their experience was necessary to understand the influence of CDF on quality of education since they were able to gauge the impact CDF had had on students’ academic performance.
The information was presented on Table 14.
The findings from Table 14 show that majority 50(40.3%) of the principals who took part in the study had served before in other schools for a period below three years. A significant
proportion 24(19.4%) of them had been principals in other secondary schools for more than 9 years before joining their current schools. Those who had served for a period between five to seven years were 22(17.7%) while some 16(12.9%) of them had served for a period between three to five years. The rest 12(9.7%) had served in their previous schools for a period between seven to nine years. This meant that they had
adequate experience as principals and had enough
[image:8.595.44.277.384.446.2]understanding of CDF dealings, having served for a period of 9 years and above as principals in other schools before joining their current schools. This therefore gave them enough experience to manage CDF funds well and construct the needed infrastructure which would go a long way in improving students’ academic performance in their schools.
Table 14. Period of Principals’ Stay in their Previous Schools (n=124)
Frequency Percent
Below 3Years 50 40.3
3-5 Years 16 12.9
5-7 Years 22 17.7
7- 9 Years 12 9.7
Above 9 Years 24 19.4
Total 124 100.0
Source: Field data (2015)
Distribution of students who received Constituency Development Fund Bursary in terms of Gender
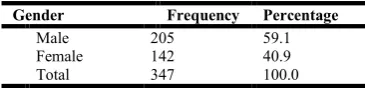
The study sought to establish whether the students who participated in the study and benefited from CDF bursaries were male or female. This information was relevant because it could give insight on the category of student beneficiaries and whether it reflected the two thirds pronouncement on gender policy in Kenya. The findings are presented in Table 15.
Table 15. Distribution of Students who receive Bursary in terms of Gender (n=347)
Gender Frequency Percentage
Male 205 59.1
Female 142 40.9
Total 347 100.0
Source: Field data (2015)
From Table 15 the findings show that there was a remarkable disparity in terms of the number of female students and their male counterparts who participated in the study; only 142 (40.9%) of the student respondents’ were females with the majority 205 (59.1%) being males, as indicated in Table 14. This may have been attributed to the fact that Kisumu County has more boys who are enrolled in boys and mixed schools combined and so their number was more than that of girls in the study.
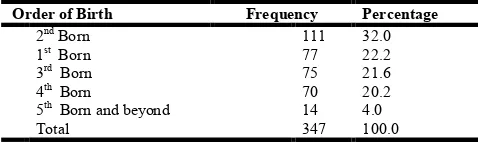
Distribution of Students by Order of Birth
[image:8.595.341.524.497.541.2]first or second born child to school as other children are told to wait. This information is presented in Table 16.
Table 16. Students Distribution by Order of Birth (n=347)
Order of Birth Frequency Percentage
2nd Born
1st Born
111 77
32.0 22.2
3rd Born 75 21.6
4th Born 70 20.2
5th Born and beyond 14 4.0
Total 347 100.0
Source: Field data (2015)
[image:9.595.42.281.108.179.2]It was evident from Table 16 that significant majority 111(32.0%) of the students who participated in the study were second born in their families followed by first born students 77(22.2%) and only 14(4.0%) of them were 5th born and beyond. Third born were 75(21.6%) while fourth born were 70(20.2%). Cumulatively it can be argued that slightly more than three quarters, 263(75.8%), of the students who participated in the study were either first, second or third born. This could imply that majority of the families had at most three children. This information was important because it could imply that most parents from humble economic background consider taking their children to school if they were either first or second born depending on their economic status. The study sought to establish the exact years the students were admitted in the secondary schools where they were learning. This information was necessary because the length of time the students had stayed in the school depending on the year of admission would indicate how much information and experience they could have had in dealing with CDF and whether they had benefited from the same. This information is presented in Table 17.
Table 17. Distribution of Students by Year of Admission (n=347)
Year of Admission Frequency Percentage
2012 170 49.0
2013 138 39.8
2014 20 5.8
2011 15 4.3
2015 4 1.2
Total 347 100.0
Source: Field data (2015)
From Table 17 it was revealed that majority, 170(49.0%), of the students who participated in the study were admitted in 2012 and this confirmed that most of the students who took part in the study were in form four. Another majority of students 138(39.8%) were admitted in 2013 while 20(5.8%) were admitted in their schools in 2014. It was also evident that 15(4.3%) of the students had repeated a class given that they were admitted in 2011 and therefore had stayed in their schools for a period of five years. A small number 4(1.2%) had been admitted in the year 2015. The students who were admitted in their schools from 2013, 2014 and 2015 could have come from other schools to their current schools.
Research objective
The research objective of the study was to establish the influence of Constituency Development Fund on Quality of
Secondary Education in Public Schools in Kisumu County. To address this objective the Null hypothesis was generated; there is no statistically significant relationship between Constituency Development Fund and Quality of Education in Public Secondary Schools in Kisumu County, Pearson’s “r” was computed to establish the relationship between CDF and Quality of Education in Public Secondary Schools in Kisumu County. The results were as shown in Table 18.
Table 18. Influence of CDF on Quality of Secondary Education in Public Schools
Mean Score
CDF Pearson Correlation .184*
Sig. (2-tailed) .041
N 124
*. Correlation is significant at the 0.05 level (2-tailed).
From Table 18 it can be noted that there was a weak and positive relationship between Constituency Development Fund and students academic performance (r =.184, N=124 and p<.05). The relationship was statistically significant and therefore the null hypothesis was rejected.
To estimate the influence of CDF on students’ academic performance coefficient of determination was computed and the results were as shown in Table 19.
Table 19. Regression Analysis of Influence of CDF on Students’ Academic Performance
Model R R
Square
Adjusted R Square
Std. Error of the Estimate
1 .184a .034 .026 1.27568
a. Predictors: (Constant), CDF
From Table 19, it can be observed that Constituency Development Fund accounted for 2.6% improvement as
signified by the adjusted R2 of .026. The other 97.4% was due
to other factors that were not the subject of this study. ANOVA was then computed to confirm whether CDF was a significant predictor of students’ academic performance.
The input revealed that CDF was a significant predictor (F (1,122) =4.262, p< .05). To confirm the contribution of CDF on students’ academic performance, simple linear regression analysis was done. The results were as shown in Table 20.
Table 20. Simple Regression Analysis of Influence of CDF on Students’ Academic Performance
Model
Unstandardized Coefficients
Standardized
Coefficients t Sig.
B Std. Error Beta
1 (Constant) 4.415 .344 12.820 .000
CDF .001 .002 .184 2.064 .041
a. Dependent Variable: Mean Score. Regression Equation: Y=a+bX
[image:9.595.63.261.475.546.2]DISCUSSION
Constituency Development Fund is used to supplement school finances by assisting the needy students who cannot afford school fees. The amount allocated usually ranges from Ksh. 2,000 to Ksh.10,000 per student which is in overall too small and in effect contribute little to their continual stay in school. Furthermore the funding is sometimes not consistent (IPAR, 2008) and is usually split into tiny amounts so as to reach as many beneficiaries as possible (Onyango & Njue, 2004). As such some students may receive it only once and this is not helpful to them. The tiny amounts are not commensurate with the fees structures charged in their respective schools and therefore the consequences here are that the students are constantly sent away from school as defaulters of school levies (Oyugi, 2010). This means that they are given false hope and therefore lose ambition in schooling. It is not possible for desperate students to concentrate and remain focused in their studies.
This study set to establish the Influence of Constituency Development Fund on Secondary Education in Public Schools in Kisumu County. The findings revealed that needy students were awarded CDF bursaries to help them pursue their studies. This information was mainly given by students who were beneficiaries of the bursary during focused group discussion. The students stated that the money awarded ranged from Kshs. 1,000 for those who were in sub-county schools to Ksh. 30,000 for those who were in national schools. However the money was paid in bits and sometimes took too long before it was disbursed to schools. The study further revealed that the bursary was sometimes being allocated to students who were not needy or who did not apply for it. During focused group discussion one student said that “I did not apply for bursary because I have completed paying school fees for this year but last week my father came home and gave me a cheque of Ksh. 7,000 to bring to school”. Another student lamented that he had been applying for bursary from the time he was admitted in form one and was only able to get Ksh. 3,000 once when he was in form four. Their views concur with those of Mwangi (2006) who noted that the awarding of CDF bursary is fraught with pitfalls. The findings further concur with those of Omondi (2007) who stated that CDF bursary was being awarded to students who were not needy in public secondary schools in Siaya District. The study also revealed that majority of those who receive bursaries in public secondary schools in the county were mainly boys. They were 205(59.1%) while a lesser number 142 (40.9%) were girls. This was attributed to the fact that there were many boys in public secondary schools than girls. Although boys’ schools were 13(10.6%) in the county, many more boys were found in mixed schools which were 93(75.0%) of the total schools and therefore they outnumbered the girls who were only 18(14.6%) of the schools in the county. Another reason could be that only a few girls apply for this fund because as Olendo (2008) stated, girls are shyer and don’t like to reveal their economic status especially when they come from humble economic backgrounds. These views also came from the principals when they were asked to state the problems they experienced with awarding of CDF bursaries in their schools. Since CDF bursary is only warded to those who apply for it, many girls in these schools therefore
miss out because they do not apply for the same. These findings differ with those of Omondi (2007) who while researching on Constraints of CDF Bursary Allocation to Secondary School Students in Siaya District found that majority (55.2%) of CDF bursary recipients were girls as compared to their male counterparts who were only 44.7%. His findings concurred with those of Sutherland-Addy (2008), World Bank (2006) and Republic of Kenya (1992, 1994 &
1997) which confirm most government’s policy
pronouncements that bursary schemes should enhance girls’ access to and retention in secondary schools.
facilities but not in learning resources such as textbooks and laboratory equipment which is key in determining student performance in examinations. These sentiments were given by school principals who during their responses said that the kind of investment by CDF do not go directly towards students performance in examinations. The same sentiments concur with those of Wakaba (2009) and Lukibia (2009) who stated that the money from CDF is mostly used in the construction of physical facilities. It is also a fact that these libraries and laboratories constructed are normally not equipped with textbooks or equipment which has a direct effect on performance in examinations. Besides, a lot of the money is spent on beginning schools which do not have qualified teachers and mostly use form four school leavers as teachers who are paid by school Boards of Management. Wakaba (2009) agrees with these views and recommends that CDF should be used to train teachers for more effective teaching and learning process.
In many of these beginning schools, the entry behavior of students is also low since most of them are day schools and therefore draw students from the locality. These sentiments are supported by findings of this study which stated that 56.5% of schools started using CDF funds in Kisumu County were day schools with 75.0% being mixed schools. This therefore means that even the amount of money allocated to them is less compared to the big schools because they have fewer students since they fall under the category of sub-county schools. It is believed that boarding schools perform better in examination as compared to day schools. This is because those in boarding schools have ample time to study while their counterparts in day schools engage in house chores once they reach home (Jagero, 1999). Single sex schools are also believed to do better in examinations than mixed schools since students are less distracted by other factors such as boy- girl relationships. Another reason why the results depicted a low relationship between CDF and quality of education in public secondary schools in Kisumu County can be attributed to the fact that the main objectives of CDF were meant to improve on access and completion rates (Republic of Kenya, 2003). Quality was therefore just a byproduct since these facilities provide an environment which is conducive to students for learning purposes (Murage, 2008). However Glekye (2012) as cited in Oduro (2013) argues that successful completion without quality grades in examinations defeats the purpose of education which is meant to equip students with knowledge and skills which is demonstrated in their performance in examinations and therefore can help transit to higher institutions of learning.
When the study sought to establish whether CDF had helped in the construction or acquisition of other facilities apart from classrooms, majority of the respondents who participated in the study confirmed that there were other buildings which had been constructed using CDF. These included sanitation facilities which took the lead 32(25.8%) followed by laboratories 25(20.2%). Libraries were also constructed and were 18(14.5 %) and CDF had also purchased school buses for some 15(12.1%) secondary schools in Kisumu County. It should be noted that apart from these four mentioned facilities other than classrooms, the principals stated that CDF had also
constructed other facilities in their schools and these included dining halls 12(9.7%), playgrounds 10(8.1%), teachers’ houses 8(6.5%) and kitchens 4(3.2%). This therefore means that a lot of money from CDF was actually spent on infrastructural development in the schools. Construction and enhancement of other facilities in secondary schools affect teaching and learning process especially if they are well equipped (Schneider, 2002). This is because it is believed that student’s academic performance is affected by poor school buildings, lack of science laboratories, inadequate ventilations and faulty lighting systems. The availability of those facilities therefore normally creates a learner friendly environment which is conducive for effective teaching and learning process (Wambua, 2011). Physical facilities such as sanitation, laboratories, libraries etcetera if well equipped and managed have a direct influence on the teaching and learning process thereby affecting quality of education. A study by Munive (2009) states that in order to improve quality of education, provision of adequate infrastructural facilities such as clean toilets, electricity, running water and dining halls among others should be a priority by any government.
Adequate sanitation for instance makes learning environment more friendly giving learners more time to concentrate on their studies. Poor hygiene and inadequate sanitation leads to diseases such as cholera, eye infections and intestinal infections caused by parasites (Wambua, 2011). According to Oriendo (2010) parasites consumes nutrients, aggravates malnutrition and retards the learners’ physical development resulting to poor school attendance, participation and performance. Girls are more affected by poor sanitation and dirty toilets because they are very sensitive when it comes to using dirty toilets. Oriendo (2010) further asserts that girls usually absent themselves from school during menstruation and this affects their learning process. When students boycott using the dirty toilets, they remain pressed in class waiting to go home to releave themselves, this therefore interferes with their concentration in class and they end up not participating effectively in class work. According to Republic of Kenya (2007), good sanitation leads to good hygiene and healthy environment for learners and therefore may prevent unnecessary health hazards thereby improving performance in examinations. Schools that have school buses may utilize them for educational trips and bench marking which in the long run may improve quality in education.