ISSN Online: 2329-8448 ISSN Print: 2329-843X
DOI: 10.4236/jtr.2018.64023 Oct. 15, 2018 251 Journal of Tuberculosis Research
Vitamin D: Level of Vitamin D3 in AFB Positive
PTB Patients in Initial Diagnostic Phase
Anwar Ali Jamali
1*, Jawaid Hussain Lighari
2, Shamasddin Shaikh
1, Ghulam Mustafa Jamali
1,
Bhojo Mal Tanwani
3, Muhammad Aslam Channa
4, Ameer Ali Jamali
5, Muhammad Ali Suhail
61Department of Medicine, Peoples University of Medical and Health Sciences, Nawabshah, Pakistan
2Department of Community Medicine, Peoples University of Medical and Health Sciences, Nawabshah, Pakistan 3Department of Physiology, Peoples University of Medical and Health Sciences for Women, Nawabshah, Pakistan 4Department of Anatomy, Gambat Institute of Medical Sciences, Khairpur, Pakistan
5Department of Peadiatrics, Peoples University of Medical and Health Sciences for Women, Nawabshah, Pakistan 6Department of Surgery, Peoples University of Medical and Health Sciences for Women, Nawabshah, Pakistan
Abstract
Background: A relationship among vitamin D and pulmonary tuberculosis. Objective: To conclude the occurrence of Vitamin D insufficiency in sub-jects suffering from pulmonary TB. Design: This was a cross sectional study. Setting: Current study was performed at department of medicine, Peoples Medical College Hospital Nawabshah starting from January 2017 to December 2017. Samples: 385 AFB positive subjects of pulmonary tuber-culosis after achieving the criteria of selection were recruited. Material and Methods: After a brief discussion, the patients were characterized for vari-able evaluation such as age, gender, sputum AFB and duration of disease and presence of low vitamin D levels. Sputum AFB criterion was used for Data collection. Fasting blood samples were collected for analysis of vitamin D levels in all subjects of AFB positive pulmonary tuberculosis. Results: In 385 diagnosed patients with smear positive PTB, 273 (70.9%) males and 112 (29.1%) were female. Vitamin D levels were within normal or sufficient range in 134 (34.8%), below normal range in 251 (65.2%) cases (insufficient in 09.56% (24/251) and deficient in 90.43% (227/251) cases). Conclusion: Decreased levels of vitamin D were common in subjects with AFB smear Positive PTB cases.
Keywords
Pulmonary Tuberculosis, Vitamin D, Vitamin D Insufficiency, 25-Hydroxyvitamin D.
How to cite this paper: Jamali, A.A., Lig-hari, J.H., Shaikh, S., Jamali, G.M., Tanwa-ni, B.M., Channa, M.A., Jamali, A.A. and Suhail, M.A. (2018) Vitamin D: Level of Vitamin D3 in AFB Positive PTB Patients in Initial Diagnostic Phase. Journal of Tu-berculosis Research, 6, 251-269.
https://doi.org/10.4236/jtr.2018.64023
Received: September 16, 2018 Accepted: October 12, 2018 Published: October 15, 2018
Copyright © 2018 by authors and Scientific Research Publishing Inc. This work is licensed under the Creative Commons Attribution International License (CC BY 4.0).
http://creativecommons.org/licenses/by/4.0/
DOI: 10.4236/jtr.2018.64023 252 Journal of Tuberculosis Research
1. Introduction
Tuberculosis (TB) is the most important community health issue worldwide. In 2011 it was assessed that about 8.7 million new cases of tuberculosis were reported and about 1.4 million deaths was related to this disease [1]. Association of vitamin D deficiency/insufficiency as a cause of Tuberculosis or its manifesta-tions as malnutrition is still undetermined. Incidence and progression of tuber-culosis had been related with many factors and vitamin D deficiency is consi-dered as one of them [2]. Low levels of vitamin D were noted in subjects with Tuberculosis in comparison to controls. Vitamin D deficiency had been related with higher risk of Tuberculosis, also increased risk of developing active tuber-culosis in subjects with latent tubertuber-culosis infection had been noted [3]. The chief source of vitamin D in humans remains the sun exposure. The conversion of 7-dehydrocholesterol to vitamin D3 via pre-vitamin D3 in human derma is induced by sun exposure. Liver and kidneys play essential role in the activation of vitamin D3 from 25-hydroxyvitamin D (25(OH)D) to bioactive form 1,25-dihydroxyvitamin D3 (1,25(OH)2D3) [4]. In a meta-analysis on relation-ship among vitamin D deficiency and tuberculosis, increased risk of active tu-berculosis was observed in subjects with decreased levels of this vitamin [5]. The bioactive form of vitamin D3 binds with receptors of vitamin D (VDR), activa-tion of VDR signaling and inducactiva-tion of mitochondrial response series leads to autophagy, fusion of phagolysosome, cathelicidin release and activation, and intracellular death of Mycobacterium Tuberculosis bacilli [4] [6] [7].
Studies had been conducted throughout the entire world on tuberculosis and vitamin D levels but no study had been carried out here in our setup. Vitamin D deficiency and pulmonary tuberculosis are the major issues of our population. This study will elaborate the association of vitamin D in subjects with AFB posi-tive tuberculosis because both of these issues are linked with morbidity and mortality as reported all over the globe.
This study will help in making the public health policies keeping in view with vitamin D levels and tuberculosis. This study will determine the frequency of decrease levels of vitamin D in subjects with different gender groups in tubercu-losis and to find out whether vitamin D has any protective role in the tuberculo-sis.
The rationale behind current study was that there is paucity of such type of researches in our population and on other hand most of the previous studies were done on retrospective data. Further research on association of vitamin D with pulmonary tuberculosis in Pakistan is needed. This study estimates the risk of acquiring tuberculosis in relation to different levels of vitamin D in Pakistani population.
Operational Definitions
dis-DOI: 10.4236/jtr.2018.64023 253 Journal of Tuberculosis Research eases in mankind.
Sputum AFB: This is a laboratory investigation also known as acid-fast bacil-lus (AFB) stain or a tuberculosis (TB) smear and accomplished on a sample of sputum from subjects suspected for tuberculosis to conclude if a subject has tu-berculosis or other category of mycobacterial infection [8].
Vitamin D Deficiency: Levels of serum 25(OH) D3 > 30 ng/ml are consi-dered normal, levels > 20 and <30 ng/ml are insufficient and levels below < 20 ng/ml are labeled as deficiency [9].
2. Material and Methods
Inclusion criteria: All male and female patients with clinical history of pulmo-nary tuberculosis and smear positive sputum for AFB were included.
Exclusion Criteria: Patients not willing for taking part in study, known cases of respiratory diseases other than PTB.
2.1. Ethical Consideration
Approval of study was sought from the hospital ethics committee PMCH Na-wabshah. Permission for data collection will be taken from the head of depart-ment of the Medicine. Written informed consent will be obtained from adult subjects while ensuring that the data will be kept confidential. People will be thoroughly informed about the objectives and methods of the study.
2.2. Data Collection
After a brief discussion, the patients were characterized for variable evaluation such as age, gender, sputum AFB and duration of disease and presence of low vitamin D levels. Sputum AFB criterion was used for Data collection. Fasting blood samples were collected for analysis of vitamin D levels in all subjects of AFB positive pulmonary tuberculosis. Data were collected through interview based questionnaire. Sample size was calculated used 95% level of confidence and margin error of 5%, from 1.6 million populations with 50% distribution re-sponse rate through the Rao-software. Sample size included 385 participants. Subjects grouping were done with positive sputum AFB for tuberculosis to ana-lyze the frequency of low levels of vitamin D levels and AFB positivity.
Sputum examination was done after preparation of the sputum slide for ZN staining for proper microscopic examination of AFB.
Collected blood samples were stored before to examination. Total serum levels of vitamin D were analyzed by automatic analyzer. Convenience sample proce-dure was performed.
This Current study was hospital based, subjects aged more than 20 years and diagnosed cases of PTB with sputum AFB positive were included.
2.3. Statistical Analysis
percentag-DOI: 10.4236/jtr.2018.64023 254 Journal of Tuberculosis Research es were calculated for variables such as sex, Sputum AFB & vitamin D levels. Quantitative variables as age were calculated for mean and standard deviation. Importance of vitamin D was observed in subjects with pulmonary TB with rela-tion to age, sex, and sputum positive for AFB and PTB durarela-tion to conclude the effect on consequences.
3. Results
A total of 1245 subjects suspected of Pulmonary Tuberculosis who presented with different symptoms like cough, fever, and weight loss, loss of appetite, body ache, and difficulty in breath were included. They were advised sputum for AFB and 385 cases with AFB positive were included. In parallel to this 144 healthy controls were selected in respect to age and gender for vitamin D levels.
The average ages of patients were 37.80 years with SD of 15.05 years. The age ranged between 21 and 85 years. The mean age of healthy controls was 36.70 years with standard deviation was 14.14 years ranging between 20 and 78 years. Male to female ratio was 2.43/1 (273/112) in patients and in healthy control group it was 2.27/1 (100/44) out of 144. The mean serum vitamin D3 level of pa-tients was 26.98 with SD 22.10 ng/ml. The mean vitamin D3 levels of healthy controls were 34.46 with SD 44.4 ng/ml (Table 1).
In Table 2 it is observed that 273 (70.9%) males and 112 (29.1%) were female. Out of all study subjects, 242 (62.9%) from young age, 101 (26.2%) from middle age and 42 (10.9%) were from old age group. There were 361 (93.8%) married patients while 24 (6.2%) were unmarried. Patients from rural setup were 209 (54.3%) while 176 (45.7%) belonged to urban areas. There were 202 (52.5%) subjects with primary to matriculation, 60 (15.6%) were intermediate to gradu-ate and 123 (31.9%) uneducgradu-ated. Socioeconomic class had shown dominant ratio of lower economic class 351 (91.2%), while 23 (6.0%), 11 (2.9%) belonged mid-dle and upper class respectively. By occupation, 98 (25.5%) house wives, 146 (37.9%) manual workers, 55 (14.3%) were office workers and remaining 86 (22.3%) claimed no occupation. History of sun exposure < 01 hour was noted in 228 (59.2%), 2 hours in 68 (17.7%), 3 hours in 46 (11.9%), 4 hours in 21 (5.5%) and 5 hours in 22 (5.7%) subjects. Vitamin D levels were within normal or suffi-cient range in 134 (34.8%), below normal range in 251 (65.2%) cases, while in-sufficient in 09.56% (24/251) and deficient in 90.43% (227/251) cases. BCG vac-cination history was negative 318 (82.6%), while positive in 67 (17.4%) cases. Family history of PTB was positive in 37 (09.6%) while negative in 348 (90.4%).
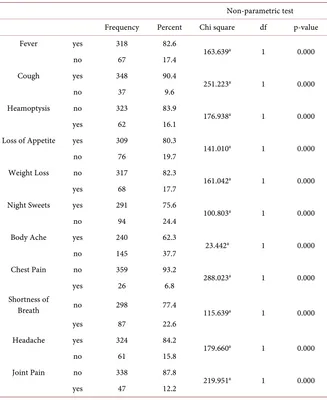
History of fever in 318 (82.6%) cases, cough in 348 (90.4%), heamoptysis 62 (16.1%), loss of appetite in 309 (80.3%), weight loss in 68 (17.7%), night sweats in 291 (75.6%), body ache 240 (62.3%) chest pain in 26 (6.8%), shortness of breath in 87 (22.6%), headache in 324 (84.2%) and joint pain in 47 (12.2%) was present respectively (Table 3).
DOI: 10.4236/jtr.2018.64023 255 Journal of Tuberculosis Research Table 1. Statistics of Vitamin D in patients and control Group.
Patients Control
age in years vitamin D level age in years vitamin D level
N Valid 385 385 144 144
Missing 0 0 0 0
Mean 37.80 26.98 36.70 34.46
Std. Deviation 15.050 22.10 14.14 44.4
Range 64 123.00 62 130.00
Minimum 21 7.00 20 20
Maximum 85 130.00 78 140
Table 2. Frequency and percentage of different variables and non parametric test N = 385.
Non-parametric test variable Frequency Percent Chi square df p-value
Age Groups
20 - 40 years young age 242 62.9
164.577a 2 0.000 41 - 60 years middle age 101 26.2
>60 years old age 42 10.9
gender male 273 70.9 67.327b 1 0.000
female 112 29.1
marital status married 361 93.8 294.984b 1 0.000
unmarried 24 6.2
address rural 209 54.3 2.829b 1 0.093
urban 176 45.7
education level
un-educated 123 31.9
78.894a 2 0.000 primary to matriculation 202 52.5
intermediate to graduate 60 15.6
economical class
lower class 351 91.2
580.073a 2 0.000 middle class 23 6.0
upper class 11 2.9
occupation
no occupation 86 22.3
44.517c 3 0.000 house wife 98 25.5
manual worker 146 37.9 office worker 55 14.3
vitamin D Deficiency
>30 ng/dl normal 134 34.8
160.930a 2 0.000 20 - 30 ng/dl insufficient 24 6.2
<20 ng/dl deficiency 227 59.0
vitamin D Deficiency yes 251 65.2 35.556b 1 0.000
[image:5.595.178.536.286.738.2]DOI: 10.4236/jtr.2018.64023 256 Journal of Tuberculosis Research Continued
sun exposure
1 hour/24 hours 228 59.2
389.662d 4 0.000 2 hours/24 hours 68 17.7
3 hours/24 hours 46 11.9 4 hours/24 hours 21 5.5 5 hours/24 hours 22 5.7
BCG Vaccination no 318 82.6 163.639b 1 0.000
yes 67 17.4
family History of TB no 348 90.4 251.223b 1 0.000
[image:6.595.211.538.283.683.2]yes 37 9.6
Table 3. Frequency and percentage of different symptoms of PTB and non parametric test N = 385.
Non-parametric test Frequency Percent Chi square df p-value
Fever yes 318 82.6
163.639a 1 0.000
no 67 17.4
Cough yes 348 90.4
251.223a 1 0.000
no 37 9.6
Heamoptysis no 323 83.9
176.938a 1 0.000
yes 62 16.1
Loss of Appetite yes 309 80.3
141.010a 1 0.000
no 76 19.7
Weight Loss no 317 82.3
161.042a 1 0.000
yes 68 17.7
Night Sweets yes 291 75.6
100.803a 1 0.000
no 94 24.4
Body Ache yes 240 62.3
23.442a 1 0.000
no 145 37.7
Chest Pain no 359 93.2
288.023a 1 0.000
yes 26 6.8
Shortness of
Breath no 298 77.4 115.639a 1 0.000
yes 87 22.6
Headache yes 324 84.2
179.660a 1 0.000
no 61 15.8
Joint Pain no 338 87.8
219.951a 1 0.000
yes 47 12.2
DOI: 10.4236/jtr.2018.64023 257 Journal of Tuberculosis Research 15 (5.5%), old age females were 12 (10.7%) were vitamin D deficient.
The different statistical values for male and females like chi-square, df, asymp. Sig. (2-sided), Likelyhood ratio, Linear by linear association, Interval by interval pearsons R value, Ordinal by ordinal Spearman correlation and Approx. Sig. are described in Table 4.
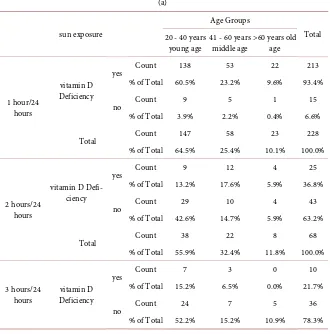
A total of 251 different age group subjects were directly related to sun expo-sure in context of vitamin D deficiency, patients with sun expoexpo-sure up-to 01 hour were 213 (93.4%), 2 hours 25 (36.8%), 3 hours 10 (21.7%), 4 hours 2 (9.5%) and 5 hours 1 (4.5%) were vitamin D deficient.
Out of 273 male patients of different age groups 170 (62.3%) were vitamin D deficient, while out of 112 female patients 81 (72.3%) were vitamin D deficient.
The different statistical values for vitamin D, age group and sun exposure like chi-square, df, asymp. sig. (2-sided), Likelyhood ratio, Linear by linear associa-tion, Interval by interval pearsons R value, Ordinal by ordinal Spearman correla-tion and Approx. Sig. are described in Table 5(a) & Table 5(b).
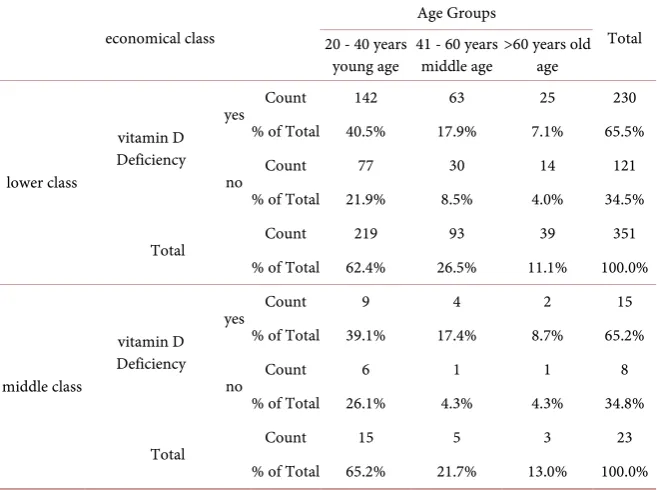
[image:7.595.208.540.393.723.2]Vitamin D deficiency was observed in 65.5% (230/351) belonging to lower so-cioeconomic class, 65.2% (15/23) from middle and 54.5% (906/11) belonging to upper socioeconomic class. Chi-square tests and Symmetric measures are shown in Table 6.
Table 4. Vitamin D, Age Group and Gender.
gender
Age Groups
Total 20 - 40 years
young age 41 - 60 years middle age >60 years old age
male
vitamin D Deficiency
yes Count 104 51 15 170
% of Total 38.1% 18.7% 5.5% 62.3%
no Count 63 28 12 103
% of Total 23.1% 10.3% 4.4% 37.7%
Total Count 167 79 27 273
% of Total 61.2% 28.9% 9.9% 100.0%
female
vitamin D Deficiency
yes Count 52 17 12 81
% of Total 46.4% 15.2% 10.7% 72.3%
no Count 23 5 3 31
% of Total 20.5% 4.5% 2.7% 27.7%
Total Count 75 22 15 112
% of Total 67.0% 19.6% 13.4% 100.0% Chi-Square Tests
gender Value df Asymp. Sig. (2-sided)
male
Pearson Chi-Square 0.694a 2 0.707
Likelihood Ratio 0.685 2 0.710
Linear-by-Linear
DOI: 10.4236/jtr.2018.64023 258 Journal of Tuberculosis Research Continued
N of Valid Cases 273
female
Pearson Chi-Square 1.046b 2 0.593
Likelihood Ratio 1.080 2 0.583
Linear-by-Linear
Association 0.985 1 0.321
N of Valid Cases 112
Symmetric Measures
gender Value Asymp. Std. Errora Approx. Tb Approx. Sig.
male
Interval by Interval Pearson’s R 0.021 0.061 0.339 0.735c
Ordinal by Ordinal Correlation Spearman 0.011 0.061 0.177 0.859c
N of Valid Cases 273
female
Interval by Interval Pearson’s R −0.094 0.088 −0.992 0.323c
Ordinal by Ordinal Correlation Spearman −0.097 0.089 −1.018 0.311c
[image:8.595.210.540.389.723.2]N of Valid Cases 112
Table 5. Vitamin D, Age Group and sun exposure. (a)
sun exposure
Age Groups
Total 20 - 40 years
young age 41 - 60 years middle age >60 years old age
1 hour/24 hours
vitamin D Deficiency
yes Count 138 53 22 213
% of Total 60.5% 23.2% 9.6% 93.4%
no Count 9 5 1 15
% of Total 3.9% 2.2% 0.4% 6.6%
Total Count 147 58 23 228
% of Total 64.5% 25.4% 10.1% 100.0%
2 hours/24 hours
vitamin D Defi-ciency
yes Count 9 12 4 25
% of Total 13.2% 17.6% 5.9% 36.8%
no Count 29 10 4 43
% of Total 42.6% 14.7% 5.9% 63.2%
Total Count 38 22 8 68
% of Total 55.9% 32.4% 11.8% 100.0%
3 hours/24
hours Deficiency vitamin D
yes Count 7 3 0 10
% of Total 15.2% 6.5% 0.0% 21.7%
no Count 24 7 5 36
DOI: 10.4236/jtr.2018.64023 259 Journal of Tuberculosis Research Continued
Total Count 31 10 5 46
% of Total 67.4% 21.7% 10.9% 100.0%
4 hours/24 hours
vitamin D Deficiency
yes Count 1 0 1 2
% of Total 4.8% 0.0% 4.8% 9.5%
no Count 12 5 2 19
% of Total 57.1% 23.8% 9.5% 90.5%
Total Count 13 5 3 21
% of Total 61.9% 23.8% 14.3% 100.0%
5 hours/24 hours
vitamin D Deficiency
yes Count 1 0 0 1
% of Total 4.5% 0.0% 0.0% 4.5%
no Count 12 6 3 21
% of Total 54.5% 27.3% 13.6% 95.5%
Total Count 13 6 3 22
% of Total 59.1% 27.3% 13.6% 100.0%
(b) Chi-Square Tests
sun exposure Value df Asymp. Sig. (2-sided)
1 hour/24 hours
Pearson Chi-Square 0.630a 2 0.730 Likelihood Ratio 0.622 2 0.733 Linear-by-Linear Association 0.004 1 0.950
N of Valid Cases 228
2 hours/24 hours
Pearson Chi-Square 6.391b 2 0.041 Likelihood Ratio 6.436 2 0.040 Linear-by-Linear Association 4.702 1 0.030
N of Valid Cases 68
3 hours/24 hours
Pearson Chi-Square 1.803c 2 0.406 Likelihood Ratio 2.835 2 0.242 Linear-by-Linear Association 0.490 1 0.484
N of Valid Cases 46
4 hours/24 hours
Pearson Chi-Square 2.551d 2 0.279 Likelihood Ratio 2.339 2 0.311 Linear-by-Linear Association 0.892 1 0.345
N of Valid Cases 21
5 hours/24 hours
Pearson Chi-Square 0.725e 2 0.696 Likelihood Ratio 1.085 2 0.581 Linear-by-Linear Association 0.571 1 0.450
DOI: 10.4236/jtr.2018.64023 260 Journal of Tuberculosis Research Continued
Symmetric Measures
sun exposure Value Asymp. Std. Errora Approx. Tb Approx. Sig.
1 hour/24 hours
Interval by Interval Pearson’s R 0.004 0.061 0.063 0.950c
Ordinal by Ordinal Correlation Spearman 0.015 0.065 0.229 0.819c
N of Valid Cases 228
2 hours/24 hours
Interval by Interval Pearson’s R −0.265 0.119 −20.232 0.029c
Ordinal by Ordinal Correlation Spearman −0.288 0.117 −20.447 0.017c
N of Valid Cases 68
3 hours/24 hours
Interval by Interval Pearson’s R 0.104 0.110 0.696 0.490c
Ordinal by Ordinal Correlation Spearman 0.065 0.132 0.431 0.668c
N of Valid Cases 46
4 hours/24 hours
Interval by Interval Pearson’s R −0.211 0.288 −0.942 0.358c
Ordinal by Ordinal Correlation Spearman −0.155 0.269 −0.683 0.503c
N of Valid Cases 21
5 hours/24 hours
Interval by Interval Pearson’s R 0.165 0.085 0.748 0.463c
Ordinal by Ordinal Correlation Spearman 0.176 0.090 0.800 0.433c
[image:10.595.210.539.479.724.2]N of Valid Cases 22
Table 6. Vitamin D, Age Group and economical Class.
economical class
Age Groups
Total 20 - 40 years
young age 41 - 60 years middle age >60 years old age
lower class
vitamin D Deficiency
yes Count 142 63 25 230
% of Total 40.5% 17.9% 7.1% 65.5%
no Count 77 30 14 121
% of Total 21.9% 8.5% 4.0% 34.5%
Total Count 219 93 39 351
% of Total 62.4% 26.5% 11.1% 100.0%
middle class
vitamin D Deficiency
yes Count 9 4 2 15
% of Total 39.1% 17.4% 8.7% 65.2%
no Count 6 1 1 8
% of Total 26.1% 4.3% 4.3% 34.8%
Total Count 15 5 3 23
DOI: 10.4236/jtr.2018.64023 261 Journal of Tuberculosis Research Continued
upper class
vitamin D Deficiency
yes Count 5 1 6
% of Total 45.5% 9.1% 54.5%
no Count 3 2 5
% of Total 27.3% 18.2% 45.5%
Total Count 8 3 11
% of Total 72.7% 27.3% 100.0% Chi-Square Tests
economical class Value df Asymp. Sig. (2-sided) Exact Sig. (2-sided) Exact Sig. (1-sided)
lower class
Pearson Chi-Square 0.283a 2 0.868 Likelihood Ratio 0.285 2 0.867 Linear-by-Linear Association 0.024 1 0.877
N of Valid Cases 351
middle class
Pearson Chi-Square 0.664b 2 0.717 Likelihood Ratio 0.707 2 0.702 Linear-by-Linear Association 0.245 1 0.621
N of Valid Cases 23
upper class
Pearson Chi-Square 0.749c 1 0.387 Continuity Correctiond 0.034 1 0.853 Likelihood Ratio 0.754 1 0.385
Fisher’s Exact Test 0.545 0.424
Linear-by-Linear Association 0.681 1 0.409 N of Valid Cases 11
Symmetric Measures
economical class Value Asymp. Std. Errora Approx. Tb Approx. Sig.
lower class
Interval by Interval Pearson’s R −0.008 0.054 −0.155 0.877c
Ordinal by Ordinal Correlation Spearman −0.014 0.053 −0.255 0.799c
N of Valid Cases 351
middle class
Interval by Interval Pearson’s R −0.106 0.206 −0.486 0.632c
Ordinal by Ordinal Correlation Spearman −0.131 0.203 −0.603 0.553c
N of Valid Cases 23
upper class
Interval by Interval Pearson’s R 0.261 0.290 0.811 0.438c
Ordinal by Ordinal Correlation Spearman 0.261 0.290 0.811 0.438c
N of Valid Cases 11
signifi-DOI: 10.4236/jtr.2018.64023 262 Journal of Tuberculosis Research cant association between gender and address of patients. Marital status and BCG vaccine status were statistically significant. Sun exposure was significantly re-lated to education, occupation and family history of tuberculosis. Educational status was statistically related to vitamin D deficiency and sun exposure. Eco-nomical class was statistically related to marital status, BCG vaccination status and family history of PTB. Occupation of patients was directly related to vitamin D deficiency and sun exposure. While the relationship of vitamin D deficiency with age group, gender, marital status, address, economical class and BCG vac-cination was not significant statistically (Table 7).
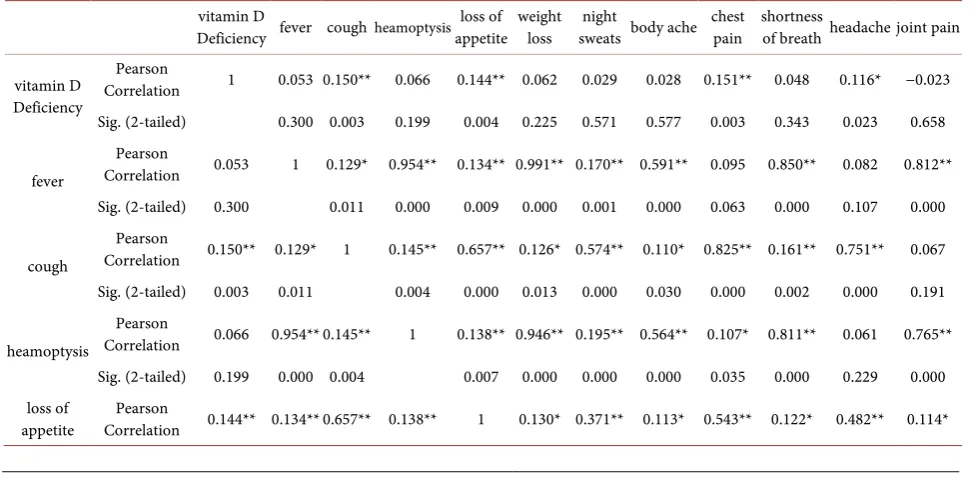
Vitamin D deficiency and different symptoms of tuberculosis were related sta-tistically like cough, loss of appetite, chest pain and headache. While fever, hea-moptysis, weight loss, night sweats, bodyache, shortness of breath and joint pain did not show significant statistical relation. Different symptoms were interre-lated and shown significant relation like fever, cough, heamoptysis, chest pain, and shortness of breath, headache and joint pain were interrelated with signifi-cant statistical relation (Table 8).
The paired sample testing and paired samples correlation were analyzed and found statistically significant. Various means and standard deviations with standard error of mean were checked in parallel to correlations and significance as shown in the p-value that was statistically significant vitamin D level with oc-cupation (<0.000), sun exposure (<0.000) and family history of tuberculosis (<0.003). While age group (<0.828), gender (<0.060), address (<0.874), educa-tion (<0.032), economical class (<0.533) and BCG vaccinaeduca-tion was statistically insignificant in paired sample testing and paired correlations (Table 9).
[image:12.595.59.546.569.733.2]In relation to tuberculosis parameters and vitamin D levels paired sample test was performed with mean and SD, upper and lower limits, with 95% confidence interval as shown in Table 10, the p-value was statistically significant vitamin D level with pair of vitamin D and age group < 0.002, address < 0.002, economical status < 0.000, occupation < 0.000, sun exposure < 0.000, BCG vaccination < 0.000 and family history of PTB < 0.000.While there was insignificant statistical relation of gender 0.105 and education 0.629 (Table 10).
Table 7. Correlations of vitamin D and different variables of study N = 385.
vitamin D
Deficiency Age Groups gender marital status address education economical class occupation sun exposure Vaccination BCG family History
of TB
vitamin D Deficiency
Pearson
Correlation 1 −0.011 −0.096 0.082 0.008 0.109* 0.032 0.231** 0.679** 0.053 0.150** Sig. (2-tailed) 0.828 0.060 0.107 0.874 0.032 0.533 0.000 0.000 0.300 0.003
Age Groups
Pearson
Correlation −0.011 1 −0.015 −0.024 0.003 −0.012 −0.044 0.036 0.031 −0.012 −0.010 Sig. (2-tailed) 0.828 0.766 0.638 0.949 0.812 0.391 0.484 0.549 0.815 0.844
DOI: 10.4236/jtr.2018.64023 263 Journal of Tuberculosis Research Continued
Sig. (2-tailed) 0.060 0.766 0.350 0.048 0.595 0.594 0.285 0.323 0.462 0.503
marital status
Pearson
Cor-relation 0.082 −0.024 0.048 1 −0.021 0.046 0.193** −0.093 0.060 0.108* 0.062 Sig. (2-tailed) 0.107 0.638 0.350 0.682 0.367 0.000 0.067 0.241 0.034 0.227
Address
Pearson
Correlation 0.008 0.003 0.101* −0.021 1 −0.028 0.045 −0.014 −0.027 0.033 0.055 Sig. (2-tailed) 0.874 0.949 0.048 0.682 0.586 0.382 0.780 0.596 0.523 0.285
education
Pearson
Correlation 0.109* −0.012 −0.027 0.046 −0.028 1 −0.055 0.058 0.184** −0.048 −0.006 Sig. (2-tailed) 0.032 0.812 0.595 0.367 0.586 0.286 0.253 0.000 0.351 0.912
economical class
Pearson
Correlation 0.032 −0.044 0.027 0.193** 0.045 −0.055 1 0.099 0.020 0.106* 0.103* Sig. (2-tailed) 0.533 0.391 0.594 0.000 0.382 0.286 0.052 0.696 0.038 0.044
occupation
Pearson
Correlation 0.231** 0.036 −0.055 −0.093 −0.014 0.058 0.099 1 0.249** −0.032 0.024 Sig. (2-tailed) 0.000 0.484 0.285 0.067 0.780 0.253 0.052 0.000 0.535 0.643
sun exposure
Pearson
Correlation 0.679** 0.031 −0.050 0.060 −0.027 0.184** 0.020 0.249** 1 0.022 0.120* Sig. (2-tailed) 0.000 0.549 0.323 0.241 0.596 0.000 0.696 0.000 0.661 0.019
BCG Vaccination
Pearson
Correlation 0.053 −0.012 −0.038 0.108* 0.033 −0.048 0.106* −0.032 0.022 1 0.129* Sig. (2-tailed) 0.300 0.815 0.462 0.034 0.523 0.351 0.038 0.535 0.661 0.011
family History of
TB
Pearson
Correlation 0.150** −0.010 −0.034 0.062 0.055 −0.006 0.103* 0.024 0.120* 0.129* 1 Sig. (2-tailed) 0.003 0.844 0.503 0.227 0.285 0.912 0.044 0.643 0.019 0.011
[image:13.595.57.543.502.743.2]*Correlation is significant at the 0.05 level (2-tailed); **Correlation is significant at the 0.01 level (2-tailed).
Table 8. Correlations of vitamin D and different symptoms of PTB, N = 385.
vitamin D
Deficiency fever cough heamoptysis loss of appetite weight loss sweats body ache night chest pain shortness of breath headache joint pain
vitamin D Deficiency
Pearson
Correlation 1 0.053 0.150** 0.066 0.144** 0.062 0.029 0.028 0.151** 0.048 0.116* −0.023 Sig. (2-tailed) 0.300 0.003 0.199 0.004 0.225 0.571 0.577 0.003 0.343 0.023 0.658
fever
Pearson
Correlation 0.053 1 0.129* 0.954** 0.134** 0.991** 0.170** 0.591** 0.095 0.850** 0.082 0.812** Sig. (2-tailed) 0.300 0.011 0.000 0.009 0.000 0.001 0.000 0.063 0.000 0.107 0.000
cough
Pearson
Correlation 0.150** 0.129* 1 0.145** 0.657** 0.126* 0.574** 0.110* 0.825** 0.161** 0.751** 0.067 Sig. (2-tailed) 0.003 0.011 0.004 0.000 0.013 0.000 0.030 0.000 0.002 0.000 0.191
heamoptysis
Pearson
Correlation 0.066 0.954** 0.145** 1 0.138** 0.946** 0.195** 0.564** 0.107* 0.811** 0.061 0.765** Sig. (2-tailed) 0.199 0.000 0.004 0.007 0.000 0.000 0.000 0.035 0.000 0.229 0.000 loss of
DOI: 10.4236/jtr.2018.64023 264 Journal of Tuberculosis Research Continued
Sig. (2-tailed) 0.004 0.009 0.000 0.007 0.011 0.000 0.027 0.000 0.017 0.000 0.025
weight loss
Pearson
Correlation 0.062 0.991** 0.126* 0.946** 0.130* 1 0.165** 0.582** 0.092 0.841** 0.097 0.805** Sig. (2-tailed) 0.225 0.000 0.013 0.000 0.011 0.001 0.000 0.070 0.000 0.056 0.000
night sweats
Pearson
Correlation 0.029 0.170** 0.574** 0.195** 0.371** 0.165** 1 0.082 0.474** 0.213** 0.482** 0.102* Sig. (2-tailed) 0.571 0.001 0.000 0.000 0.000 0.001 0.107 0.000 0.000 0.000 0.045
body ache
Pearson
Correlation 0.028 0.591** 0.110* 0.564** 0.113* 0.582** 0.082 1 0.069 0.503** 0.088 0.480** Sig. (2-tailed) 0.577 0.000 0.030 0.000 0.027 0.000 0.107 0.180 0.000 0.083 0.000
chest pain
Pearson
Correlation 0.151** 0.095 0.825** 0.107* 0.543** 0.092 0.474** 0.069 1 0.127* 0.620** 0.058 Sig. (2-tailed) 0.003 0.063 0.000 0.035 0.000 0.070 0.000 0.180 0.013 0.000 0.258
shortness of breath
Pearson
Correlation 0.048 0.850** 0.161** 0.811** 0.122* 0.841** 0.213** 0.503** 0.127* 1 0.106* 0.690** Sig. (2-tailed) 0.343 0.000 0.002 0.000 0.017 0.000 0.000 0.000 0.013 0.038 0.000
headache
Pearson
Correlation 0.116* 0.082 0.751** 0.061 0.482** 0.097 0.482** 0.088 0.620** 0.106* 1 0.055 Sig. (2-tailed) 0.023 0.107 0.000 0.229 0.000 0.056 0.000 0.083 0.000 0.038 0.278
joint pain
Pearson
Correlation −0.023 0.812** 0.067 0.765** 0.114* 0.805** 0.102* 0.480** 0.058 0.690** 0.055 1 Sig. (2-tailed) 0.658 0.000 0.191 0.000 0.025 0.000 0.045 0.000 0.258 0.000 0.278
[image:14.595.210.538.430.732.2]*Correlation is significant at the 0.05 level (2-tailed), **Correlation is significant at the 0.01 level (2-tailed).
Table 9. Vitamin D and demographic variables (paired statistic and correlations). Mean Std. Deviation Std. Error Mean Correlation Sig.
Pair 1 vitamin D Deficiency 1.3481 0.47697 0.02431 −0.011 0.828 Age Groups 1.4805 0.68485 0.03490
Pair 2 vitamin D Deficiency 1.3481 0.47697 0.02431 −0.096 0.060 gender 1.2909 0.45477 0.02318
Pair 3 vitamin D Deficiency 1.3481 0.47697 0.02431 0.008 0.874 address 1.4571 0.49881 0.02542
Pair 4 vitamin D Deficiency 1.3481 0.47697 0.02431 0.109 0.032 education 1.3325 0.47171 0.02404
Pair 5 vitamin D Deficiency 1.3481 0.47697 0.02431 0.032 0.533 economical class 1.1169 0.40098 0.02044
Pair 6 vitamin D Deficiency 1.3481 0.47697 0.02431 0.231 0.000 occupation 2.4416 0.99076 0.05049
Pair 7 vitamin D Deficiency 1.3481 0.47697 0.02431 0.679 0.000 sun exposure 1.8078 1.18780 .06054
Pair 8 vitamin D Deficiency 1.3481 0.47697 0.02431 0.053 0.300 BCG Vaccination 1.17403 0.379625 0.019347
DOI: 10.4236/jtr.2018.64023 265 Journal of Tuberculosis Research Table 10. Vitamin D and different parameters (paired sample tests).
Paired Differences
t df (2-tailed) Sig. 95% Confidence Interval
of the Difference
Mean Deviation Std. Std. Error Mean Lower Upper
Pair 1 vitamin D Deficiency − Age Groups −0.13247 0.83890 0.04275 −0.21653 −0.04841 −3.098 384 0.002
Pair 2 vitamin D Deficiency − gender 0.05714 0.68985 0.03516 −0.01198 0.12627 1.625 384 0.105
Pair 3 vitamin D Deficiency − address −0.10909 0.68735 0.03503 −0.17797 −0.04022 −3.114 384 0.002
Pair 4 vitamin D Deficiency − education 0.01558 0.63309 0.03227 −0.04785 0.07902 0.483 384 0.629
Pair 5 vitamin D Deficiency − economical class 0.23117 0.61328 0.03126 0.16972 0.29262 7.396 384 0.000
Pair 6 vitamin D Deficiency − occupation −1.09351 0.99561 0.05074 −1.19327 −0.99374 −21.551 384 0.000
Pair 7 vitamin D Deficiency − sun exposure −0.45974 0.93210 0.04750 −0.55314 −0.36634 −9.678 384 0.000
Pair 8 vitamin D Deficiency − BCG Vaccination 0.174026 0.593674 0.030256 0.114537 0.233515 5.752 384 0.000
Pair 9 vitamin D Deficiency − family History of TB 0.25195 0.52182 0.02659 0.19966 0.30424 9.474 384 0.000
4. Discussion
Pulmonary tuberculosis including extra-pulmonary tuberculosis is general health issue in Pakistan. List of factors are accountable to the development of tuberculosis. Vitamin D is also labeled as one of the risk agents for the occur-rence and progress of tuberculosis. Worldwide studies are available on different health issues and role of vitamin D, but our setup lacks that. Nawabshah is lo-cated in Sindh Pakistan a hot area in summer the temperature reaches at the world record temperatures. Inspite of sunny environment our controls and pa-tients are vitamin D deficient. Nowadays vitamin D is blamed for a list of prob-lems all over the world as reported. Here our setup is also one of the victims out of them.
The hazard of tuberculosis (TB) infection is related to the decreased levels of vitamin D [10] [11]. Current research also declares the low levels of vitamin D in subjects who were suffering from the pulmonary tuberculosis.
Subjects with vitamin D deficiency had increased vulnerability to acquire the tuberculosis [12] and worse progression of disease in tuberculosis subjects [12] [13]. Although the current study was not focusing the before analysis of vitamin D levels in subjects who are at increased risk level for the development of pul-monary tuberculosis.
con-DOI: 10.4236/jtr.2018.64023 266 Journal of Tuberculosis Research trols the expression of genes responsible for immune function. The process by which tuberculosis infection may be limited or prevented is through the binding of bioactive form of vitamin D binds with VDR [14] [15] [16]. The role of vita-min D after development of Pulmonary TB needs randomized control trials to check out the effect after therapy.
Vitamin D deficiency is associated with list of problems as reported and Vi-tamin D deficiency had been labeled for many diseases. Naveed and Anwar con-cluded that chronic kidney disease is a chief contributing cause of vitamin D de-ficiency which was observed in about 83% of subjects [17].
Jamali A.A. et al. found that considerably low levels of vitamin D3 were seen in (62.1%) of patients suffering from parkinsons disease and in second study they found low levels were associated with primary infertility as compared to controlled population [18] [19].
In Pakistan Najeeha Talat et al. determined the serum levels of vitamin D on subjects with tuberculosis and their contacts; they observed that 79% subjects were vitamin D deficient (<20 ng/ml), 14% with insufficient and 07% had suffi-cient vitamin D levels [12]. The results of current research are also at match able position to Najeeha study as low serum vitamin D levels were seen in 60.00% AFB positive PTB patients in our study.
There is 5 fold augmented risk for tuberculosis progression in subjects with vitamin D deficiency. Sutaria et al. [20] observed the association among deficient vitamin D status and tuberculosis, relationship among VDR polymorphism and vulnerability of tuberculosis and also evaluated part of vitamin D supplements in the prevention and treatment of tuberculosis. They concluded that subjects with tuberculosis had low vitamin D in comparison to healthy age and sex matched controls [21], subjects with convinced VDR polymorphisms (BsmI and FokI) were found to have high vulnerability for tuberculosis and subjects who were given supplementary vitamin D showed the enhanced results in most of studies [20]. The needs of retrograde studies are essential here to look in this regard.
preven-DOI: 10.4236/jtr.2018.64023 267 Journal of Tuberculosis Research tion and treatment of tuberculosis [3].
In present study male patients of different age groups 170 (62.3%) were vita-min D deficient, while out of 112 female patients 81 (72.3%) were vitavita-min D de-ficient. The majority of population belonged to young age group and HIV is not a common risk factor here for tuberculosis in our setup.
Nnoaham et al. in a meta-analysis on the relationship among vitamin D and tuberculosis had observed decreased levels of vitamin D in subjects with tuber-culosis vs. controls and vitamin D deficiency confidently related with high risk of tuberculosis [5]. In current research the mean serum vitamin D3 level of pa-tients was 26.98 with SD 22.10 ng/ml. The mean vitamin D3 levels of healthy controls were 34.46 with SD 44.4 ng/ml these results are matchable with the me-ta-analysis by Nnoaham et al.
Supplements of vitamin D were not significantly beneficial in tuberculosis subjects on treatment as denoted by Xia et al. in 2012, their analysis did not dis-course the query whether it could be beneficial in prevention of tuberculosis. More controlled studies are further required to conclude about the beneficial ef-fects of supplement vitamin D in tuberculosis patients [22].
Levels of bioactive form of vitamin D (1,25(OH)D3) were higher in tuberculo-sis subjects in comparison to controls without tuberculotuberculo-sis [4].
Selvaraj et al. suggested that such rise in 1,25(OH)2D3 may be due to CYP27B1 expression up regulation that led to augmented transformation of 25(OH)D to 1,25(OH)2D3, that can be the reason for 25(OH)D lack since of its amplified use [23].
The role of vitamin D in prevention and treatment of pulmonary tuberculosis still needs much more clarifications in future. The test availability at government setup is not available at large scale. There should be vitamin D screening in gen-eral population throughout the nation for to address the exact levels of deficien-cy and future plan to manage it properly. Early identification and diagnosis of vitamin D deficiency may prevent the burden of some morbid diseases which may result in morbidity and mortality.
Limitations
In current study there are certain restrictions and strengths. Current study de-monstrates completely most features of association of vitamin D and tuberculo-sis, and solved the query about vitamin D deficiency was cause or sequel of tu-berculosis. Current analysis was based on most of the available quality data to ensure the outcomes. Certain limits are also concerned with this study such as number of related studies was restricted with small sample size that indeed may have certain effects on study outcomes. Moreover inconsistency in VDD defini-tion was seen due to the different standards for VDD in different studies that could affect our study outcomes.
5. Conclusion
DOI: 10.4236/jtr.2018.64023 268 Journal of Tuberculosis Research tuberculosis. Vitamin D deficiency is probably a risk factor for tuberculosis than its consequence. Further studies are required to conclude about the beneficial effects with vitamin D supplementations in treatment and prevention of tuber-culosis.
Acknowledgements
We gratefully acknowledge Dr Bhojo Mal Tanwaniand Dr Ghulam Mustafa Ja-maliand for their excellent support.
We also thank Mr Parkashkumar and staff of Jholylal Diagnostic Lab for their positive role and cooperation in this research.
Funding
This study was not supported financially by any institutional/governmental and nongovernmental organization.
Conflicts of Interest
There is no conflicting interest as declared by the authors for this research.
References
[1] Kim, J.H., Park, J.S., Cho, Y.J., et al. (2014) Low Serum 25-Hydroxyvitamin D Level: An Independent Risk Factor for Tuberculosis? Clinical Nutrition, 33, 1081-1086. https://doi.org/10.1016/j.clnu.2013.11.014
[2] Chocano-Bedoya, P. and Ronnenberg, A.G. (2009) Vitamin D and Tuberculosis. Nutrition Reviews, 67, 289-293. https://doi.org/10.1111/j.1753-4887.2009.00195.x [3] Huang, S.-J., Wang, X.-H., Liu, Z.-D., Cao, W.-L., Han, Y., Ma, A.-G. and Xu, S.-F.
(2017) Vitamin D Deficiency and the Risk of Tuberculosis: A Meta-Analysis. Drug Design, Development and Therapy, 11, 91-102.
https://doi.org/10.2147/DDDT.S79870
[4] Realegeno, S. and Modlin, R.L. (2011) Shedding Light on the Vitamin D-Tubercu- losis-HIV Connection. Proceedings of the National Academy of Sciences of the United States of America, 108, 18861-18862.
https://doi.org/10.1073/pnas.1116513108
[5] Nnoaham, K.E. and Clarke, A. (2008) Low Serum Vitamin D Levels and Tuberculo-sis: A Systematic Review and Meta-Analysis. International Journal of Epidemiology, 37, 113-119. https://doi.org/10.1093/ije/dym247
[6] Liu, P.T., Stenger, S., Li, H., et al. (2006) Toll-Like Receptors Triggering of a Vita-min D Mediated Anti-Microbical Response. Science, 311, 1770-1773.
https://doi.org/10.1126/science.1123933
[7] Adams, J.S., Ren, S., Liu, P.T., et al. (2009) Vitamin D Directed Rheostatic Regula-tion of Monocyte Antibacterial Responses. The Journal of Immunology, 182, 4289-4295. https://doi.org/10.4049/jimmunol.0803736
[8] A National Clinical Guideline (2018) Diagnosis and Management of Drug Suscepti-ble Tuberculosis. Pakistan Chest Society, 4-19.
DOI: 10.4236/jtr.2018.64023 269 Journal of Tuberculosis Research [10] Holick, M.F. (2006) High Prevalence of Vitamin D Inadequacy and Implications for
Health. Mayo Clinic Proceedings, 81, 353-373. https://doi.org/10.4065/81.3.353 [11] Wilkinson, R.J., Llewelyn, M., Toossi, Z., Patel, P., Pasvol, G. and Lalvani, A. (2000)
Influence of Vitamin D Deficiency and Vitamin D Receptor Polymorphisms on Tuberculosis among Gujarati Asians in West London: A Case-Control Study. The Lancet, 355, 618-621. https://doi.org/10.1016/S0140-6736(99)02301-6
[12] Talat, N., Perry, S., Parsonnet, J., Dawood, G. and Hussain, R. (2010) Vitamin D Deficiency and Tuberculosis Progression. Emerging Infectious Diseases Journal, 16, 853-855. https://doi.org/10.3201/eid1605.091693
[13] Sita-Lumsden, A., Lapthorn, G., Swaminathan, R. and Milburn, H.J. (2007) Reacti-vation of Tuberculosis and Vitamin D Deficiency: The Contribution of Diet and Exposure to Sunlight. Thorax, 62, 1003-1007.
https://doi.org/10.1136/thx.2006.070060
[14] Lemire, J.M. (1992) Immunomodulatory Role of 1,25-Dihydroxyvitamin D3. Jour-nal of Cellular Biochemistry, 49, 26-31. https://doi.org/10.1002/jcb.240490106 [15] Reichel, H., Koeffler, H.P., Tobler, A. and Norman, A.W. (1987) 1 Alpha, 25-Dihy-
droxyvitamin D3 Inhibits Gamma-Interferon Synthesis by Normal Human Peri-pheral Blood Lymphocytes. Proceedings of the National Academy of Sciences of the United States of America, 84, 3385-3389. https://doi.org/10.1073/pnas.84.10.3385 [16] Rachez, C. and Freedman, L.P. (2000) Mechanisms of Gene Regulation by Vitamin
D3 Receptor: A Network of Coactivator Interactions. Gene, 246, 9-21.
https://doi.org/10.1016/S0378-1119(00)00052-4
[17] Shaikh, N.S., Jamali, A.A., Jamali, G.M., Jamali, N.H., Rajput, A.A. and Jamali, A.A. (2018) Frequency of Vitamin D Deficiency in Patients with Chronic Kidney Disease Presenting at Siut Karachi. IAJPS, 5, 3525-3532.
[18] Jamali, A.A., Jamali, G.M., Tanwani, B.M., Jamali, N.H. and Bhatia, M.R. (2018) Frequency of Low Vitamin D3 Levels in Subjects with Parkinson’s Disease. A Study Conducted at PMCH, a Tertiary Care Hospital, Nawabshah. Advances in Parkin-son’s Disease, 7, 7-18. https://doi.org/10.4236/apd.2018.71002
[19] Jamali, A.A., Tanwani, B.M., Jamali, G.M., et al. (2018) Vitamin D3: Association of Low Vitamin D3 Levels with Semen Abnormalities in Infertile Males. Advances in Sexual Medicine, 8, 39-59.
[20] Sutaria, N., Liu, C.-T. and Chen, T.C. (2014) Vitamin D Status, Receptor Gene Po-lymorphisms, and Supplementation on Tuberculosis: A Systematic Review of Case-Control Studies and Randomized Controlled Trials. Journal of Clinical & Translational Endocrinology, 1, 151-160. https://doi.org/10.1016/j.jcte.2014.08.001 [21] Lips, P. (2001) Vitamin D Deficiency and Secondary Hyperparathyroidism in the
Elderly: Consequences for Bone Loss and Fractures and Therapeutic Implications. Endocrine Reviews, 22, 477-501. https://doi.org/10.1210/edrv.22.4.0437
[22] Xia, J., Shi, L., Zhao, L. and Xu, F. (2014) Review Impact of Vitamin D Supplemen-tation on the Outcome of Tuberculosis Treatment: A Systematic Review and Me-ta-Analysis of Randomized Controlled Trials. Chinese Medical Journal, 127, 3127-3134.