RESEARCH ARTICLE
RAINFALL VARIABILITY ON POLLUTANTS DYNAMICS IN KINAWATAKA WETLAND STREAMS,
KAMPALA-UGANDA
Alfonse Opio
1, Lawrence Aribo
2and Frank Kansiime
31
Gulu University, Faculty of Science, Department of Biology, P. O. Box 166, Gulu, Uganda
2Ministry of Water and Environment, Climate Change Unit, P. O. Box 28119, Kampala, Uganda.
3Makerere University, College of Agricultural and Environmental Sciences, Department of Environmental
Sciences, P. O. Box 7298, Kampala, Uganda.
ARTICLE INFO ABSTRACT
In this study, assessment of rainfall variability on wetland pollutants dynamics was done. Results indicated monthly rainfall totals and anomaly increasing at non significant rate and similar faecal coliform numbers between months for all streams (p > 0.05). All streams except Concorp and Pepsi had similar Total Suspended Solids (TSS) concentration for the months (p > 0.05). Relationship of total rainfall with faecal coliforms was significantly negative and weak in Kyambogo, Banda and Outlet streams (p < 0.05). However, Pepsi and Concorp streams showed positively weak but significant relationship (P < 0.05). TSS concentration and total rainfall had significantly negative and weak relationship for Pepsi and Outlet streams (p < 0.05) while Concorp, Kyambogo and Banda streams had significantly positive but weak relationship (p < 0.05). Faecal coliform loads were similar between dry months for all streams (P > 0.05). TSS loads between dry months were significant except for Concorp stream. There was faecal coliform dilution in Kyambogo and outlet streams, and the effect was significant for TSS loads in all streams. Monthly retention ranged from 99.9 - 99.5% and 94.6 - 98.0% for faecal coliforms and TSS respectively. The study indicates that catchment designs coupled with human activities contribute to potential pollutants dynamics in wetlands.
©Copy Right, IJCR, 2011, Academic Journals. All rights reserved
INTRODUCTION
Africa is one of the most vulnerable regions in the world to climate change (Lovejoy and Hammer, 2005). The vulnerability and limitation of poor countries to adapt to climate change challenges are highlighted in various climate change Assessment Reports of Intergovernmental Panel on Climate Change (IPCC). However, the emerging phenomenon of climate change manifested in climate variability is inadequately understood for most African ecosystems. Climate is a natural resource and also key determinant of the status of other natural resources which should be harnessed and effectively utilized for socio-economic development (Ministry of Water and Environment, 2001; Environmental Alert, GEF and UNEP, 2007). The vulnerability assessment carried in Uganda identifies change in precipitation as the most important climate change impacts; some areas of the country are likely to receive more rainfall while others less (Ministry of Lands, Water and Environment, 2000). This will affect
many ecosystems including wetlands. The impact of climate
variability was observed during the El Nino period
(1997/1998) where aquatic sedges (Cyperus papyrus)
expanded rapidly within Lake Victoria basin. Most landing
*Corresponding author: [email protected]
sites were abandoned due to flooding and emergent sedges gradually covered the areas, as a result, fishing activities were impaired. It was also observed that with the rapid decline in the lake level during the drier period, which resulted in the extension of the shore line, plant growth was gradually reduced and the stretch of the surface along the shoreline was bare sand beach or dry mud. Effect of such changes on pollutants dynamics in wetlands could be enormous.
Wetlands are of great ecological and social-economic value and yet these important natural assets have been considerably degraded and altered due to human and natural factors (Lake
Victoria Environmental Management Project, 2005; Opio et
al., 2011). The degradation of wetlands is by on-site factors (e.g. impoundments and drainage) and off-site or upland areas where clearing may enhance run-off, erosion, sedimentation, and accumulation of organic and inorganic solutes and particulates (Sahagian and Melack, 1996). However, from the perspective of land use, wetlands are important as a direct source of food and various other products (e.g. fuel wood and timber), grazing grounds, and drinking and irrigation water sources. Therefore, uplands surrounding need to be taken into account for proper management of wetlands (Acreman, 2000)
ISSN: 0975-833X
International Journal of Current Research
Vol. 3, Issue, 11, pp.024-031, November, 2011
INTERNATIONAL JOURNAL OF CURRENT RESEARCH
Article History:
Received 17th August, 2011
Received in revised form 18th September, 2011
Accepted 09th October, 2011
Published online 20th November, 2011
Key words:
Faecal coliforms, Loads,
because of their controls on hydrology and nutrient supply into
wetlands (Gomani et al., 2010; De Winnaar and Jewitt, 2010).
Hydrologic, biogeochemical, and maintenance of habitat and food webs are the major wetlands functions (Sahagian and Melack, 1996; Kansiime and Nalubega, 1999; EC RTS INCO-DEV programme, 2001). The hydrologic functions include surface water storage, and high water table maintenance. Transformation and cycling of elements, retention and removal of dissolved substances from surface waters and accumulation of peats and inorganic sediments form the biogeochemical functions. However, the performance of wetlands in improving wastewater quality depends on applied loading rates and natural conditions i.e. wetland structure, hydraulic and water flow pattern within the wetlands (Hammer and Kadlec, 1986; Kadlec and Knight, 1996;
Kansiime and Nalubega, 1999; Azza et al., 2000; Kanyiginya
et al., 2010). Habitat and food web support includes maintenance of biodiversity which provide food and habitat for other animals. Such functions may be impaired by rainfall variability.
Though Swan (2010) reported urban growth in most areas as geared to rectification of existing drainage problems, however, on some instances the situations have worsened affecting eco-hydrology of ecosystems with ultimate effect on ecological functions and biodiversity shift range. Expanding impervious surface areas which increases volume of runoff after high rainfall intensity suggests investigation of the benefits on aquatic systems services. In this regards, the documentation of impacts of rainfall variability on wetlands functioning is important. This paper highlights rainfall effects on wetland pollutants dynamics in the inflow and outflow streams of Kinawataka wetland, and the relationship with monthly rainfall totals and anomaly assessed.
MATERIALS AND METHODS
Study area
The study was conducted in Kinawataka wetland - Kampala, located between 0o 20′ to 0o 22′ N and 32o 37′ to 32o 39′ E at an altitude ranging from 1,158 - 1,173 m above sea level. Kinawataka wetland is approximately 6.5 km east of Kampala City center along Kampala-Jinja highway and covers
approximately 1.5 km2. Its catchment has been degraded as a
result of industrialization and urbanization. The industrial and domestic effluents are discharged into the streams that flow into Kinawataka wetland before entering Murchison bay in Lake Victoria.
Sampling techniques
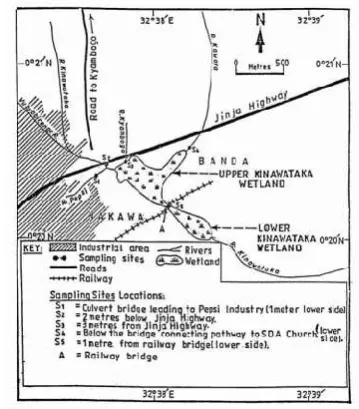
To understand pollutants dynamics in the wetland, assessment was carried out in 1999 for bacteriological indicators (faecal coliforms) and total suspended solids (TSS) in the inflow and outflow streams of the wetland. The major inflows into the
wetland were Pepsi (S1), Vubyobirenge (S2), Kyambogo (S3),
and Kawoya (S4), and outflow was the Outlet (S5) (Figure 1).
Water samples for bacteriological and total suspended solids (TSS) analyses were collected in sterile sample bottles (250 ml) and plastic bottles (500ml).The plastic bottles were thoroughly rinsed with dilute acid. All sample bottles were rinsed with the sample water before collection. Collected samples were stored in a cool box for transportation to
[image:2.595.326.506.96.301.2]laboratory for analyses within 6 hours. Samples were picked from 9.00 - 11.00 am of each day. Sampling regime covered both the wet and dry months.
Figure 1: Sampling sites in the inflow and outflow streams of Kinawataka wetland
Laboratory analysis
Faecal coliforms were determined by membrane filtration method (APHA, 1992). Presumptive faecal coliforms were analyzed directly on a pad saturated with Lauryl sulphate
broth incubated at temperature of 44oC for 16 - 18hrs. Yellow
colonies were taken as presumptive faecal coliforms. TSS was determined using gravimetric method according to APHA (1992).
Stream discharge
Water flow at the inflow and outflow streams of Kinawataka wetland was determined using a floatation method. Discharge was computed from the cross sectional area and flow speed of the streams. The loads of the pollutants were calculated by
multiplying discharge (m3/s) by the concentration of
pollutants.
Rainfall data
Daily rainfall totals (mm) data for the period 1976 to 2006 was obtained from Department of Meteorology, Uganda. This was obtained for the meteorological station number 89320910 located at National Water and Sewerage Corporation (NWSC), Kampala.
Data analysis
Rainfall data was checked for consistency as quality control measure. The anomaly of monthly rainfall totals was
computed.Time series graph was plotted to reflect variability
in the trends of the normalized rainfall for the months of 1999. The percentage rainfall anomalies during the months were calculated from the 30 year (1976 - 2006) monthly rainfall totals (LTA) to determine drought and flood events.
The anomalies were categorized based on the percentage ranges according to World Meteorological Organization (WMO) recommendations: < 75% of the LTA is drought of varying intensities; 75 - 125% of LTA is normal rainfall and >125% of the LTA indicates flooding.
Mean discharge for wet and dry months were used to compute the loads of pollutants in the streams during the different months. The seasonality of each month was categorized according to Uganda meteorological standards. The dry months were December, January, February, June, July and August while the wet months included March, April, May, September, October and November.
Statistical analysis for monthly rainfall totals and anomaly, faecal coliforms and TSS was done using the minitab software (MINITAB) Release 10 for windows. A non-parametric test, Kruskal-Wallis was used for data analysis. Correlation of monthly rainfall totals with pollutants levels and loads was also determined. Any statistical probability less than 0.05 was considered significant.
RESULTS
Total monthly rainfall and percentage (%) anomaly for the year 1999
The total monthly rainfall and anomaly for the year 1999 is shown in Figure 2.
0 25 50 75 100 125 150 175 200 225 250 Ja nu ary Fe bru ary M
[image:3.595.323.560.205.332.2]archAprilMay JuneJuly Augu st Se ptem ber O cto ber N ovem ber D ecem ber Months Ra in fa ll (mm ) Total Anomaly Below normal Normal/Expected Above normal
Figure 2: Total monthly rainfall and percentage anomaly for the period from January to December, 1999
The months of April and October, 1999 had the highest monthly rainfall totals. Lower rainfall totals were observed for the months of January, February, March and July. The relationship of monthly total rainfall trend over the months is presented in Figure 3.
December September June March 300 200 100 0 -100 Months T o ta l r a in fa ll (m m )
S = 56.4175 R-Sq = 23.4 % R-Sq(adj) = 15.7 % Total rainfall = -10929.2 + 0.271025 Months
[image:3.595.49.274.394.531.2]95% PI 95% CI Regression
Figure 3: Trend of monthly rainfall from January to December, 1999
The trend of monthly total rainfall during the year 1999
increased at non significant rate of 0.271 month-1 (F = 3.054, p
= 0.111). Relationship of rainfall amount to months was
weakly positive (R2 = 0.234). Inter-seasonal rainfall amount
was not significantly different (p = 0.195). Monthly rainfall anomaly during the year 1999 was 25%, 41.7% and 33.3% of rainfall period in the category of above normal, normal and below normal respectively. The rainfalls during the research period (May – September, 1999) were normal except for the month of July that had below normal rainfall. The relationship
of rainfall trend anomalies inthe different months is presented
in Figure 4.
December September June March 300 200 100 0 Months R a in fa ll a n o m a ly ( % )
S = 52.5313 R-Sq = 17.2 % R-Sq(adj) = 8.9 % Rainfall anomaly = -8366.53 + 0.208044 Months
95% PI 95% CI Regression
Figure 4: Relationship ofrainfall anomaly trend monthly from
January to December, 1999
The trend of monthly rainfall anomaly in 1999 increased at non significant rate of 0.208 month-1 (F = 2.076, p = 0.180). Rainfall anomaly was weak and positively related to the
months (R2 = 0.172). Inter seasonal rainfall anomaly was not
significantly different (p = 0.614).
Mean monthly faecal coliforms numbers in the inflow and outflow streams of Kinawataka wetland
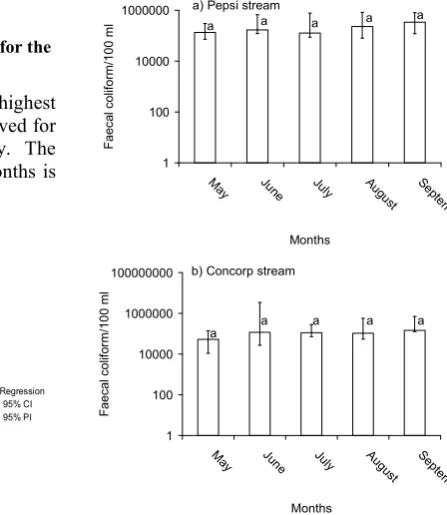
The faecal coliform numbers in the streams for the different months are presented in Figure 5.
1 100 10000 1000000
M
ay June July Augu
st Se ptem ber Months Faec a l coliform/ 100 m l
a) Pepsi stream
a a a a a
1 100 10000 1000000 100000000 M
ay June July Augu
st Se ptem ber Months F aecal coli fo rm/10 0 ml
b) Concorp stream
[image:3.595.260.484.521.779.2]1 100 10000 1000000
M
ay June July Augu
st Se
ptem ber
Months
Faecal
c
ol
if
orm
/10
0
ml
c) Kyambogo stream
a a a a
a
1 100 10000 1000000 100000000
M
ay June July Augu
st Se
ptem ber
Months
Fae
c
al
c
ol
if
orm/100
ml
d) Banda stream
a a a
a a
1 100 10000
M
ay June July Aug
ust
S ep
tem
ber
Months
Faecal colifo
rm
/10
0
ml
e) Outlet stream
a a a a a
Figure 5 (a, b, c, d and e): Faecal coliforms in the inflow and outflow streams of Kinawataka wetland for the different months of 1999. Errors bars represent maximum and minimum numbers. Similar letters indicate
non significant difference
Banda stream exhibited gradual increase in faecal coliform numbers from May to September. The rest of the streams had relatively similar faecal coliform numbers in the months of June, July and August, with May and September exhibiting lowest and highest faecal coliform numbers respectively. Faecal coliform numbers were not significantly different in Pepsi, Concorp, Kyambogo, Banda and outlet streams for all the months (p > 0.05).
Mean monthly TSS concentration in the inflow and outflow streams of Kinawataka wetland
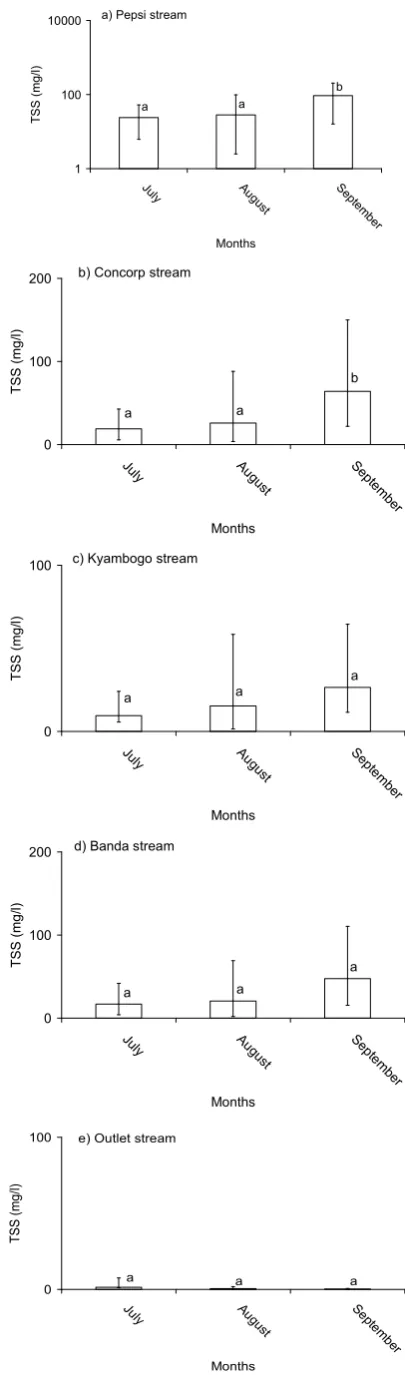
The variability of TSS concentration in the streams is presented in Figure 6. TSS concentrations increased from July to September except for the outlet stream that exhibited reverse trend. TSS concentration in Pepsi and Concorp streams were significantly different within the months. Banda, Kyambogo and Outlet streams had similar TSS concentration for the different months.
1 100 10000
July A
ug
ust
S
epte
m
ber
Months
T
SS (
mg/l)
a) Pepsi stream
a a
b
0 100 200
July Au
gust Septem
ber
Months
TSS (mg
/l)
b) Concorp stream
a a
b
0 100
July Au
gust Septem
ber
Months
TSS (mg
/l)
c) Kyambogo stream
a a
a
0 100 200
July Au
gust Septem
ber
Months
TSS (mg
/l)
d) Banda stream
a a
a
0 100
July Au
gust Septem
ber
Months
TSS (
mg/
l)
e) Outlet stream
a a a
Figure 3 (a, b, c, d and e): TSS concentrations in the inflow and outflow streams of Kinawataka wetland in the different months of 1999. Errors bars represent maximum and minimum concentrations. Similar letters
[image:4.595.328.531.52.741.2] [image:4.595.60.267.55.489.2]Relationship of monthly total rainfall with pollutants levels in the inflow and outflow streams of Kinawataka wetland
[image:5.595.324.534.56.490.2]The Pearson correlation of monthly total rainfall with faecal coliform numbers and TSS concentrations in the inflow and outflow streams of Kinawataka wetland is shown in Table 1.
Table 1: Pearson correlation of the pollutants with monthly total rainfall
Streams Faecal coliforms TSS Pepsi (S1) r = 0.086, p = 0.891 r = -0.027, p = 0.983
Concorp (S2) r = 0.027, p = 0.966 r = 0.058, p = 0.963
Kyambogo (S3) r = -0.237, p = 0.701 r = 0.257, p = 0.835
Banda (S4) r = -0.180, p = 0.772 r = 0.029, p = 0.982
Outlet (S5) r = -0.505, p = 0.385 r = -0.687, p = 0.518
There was significantly negative and weak correlation for faecal coliforms at Kyambogo, Banda and Outlet streams. However, the relationship was stronger for the outlet stream. Pepsi and Concorp streams had weak and positive but significant relationship. The relationship of TSS concentration with total monthly rainfall was significant for all the streams. Pepsi and Outlet streams exhibited negative relationship. However, outlet exhibited stronger relationship. Concorp, Kyambogo and Banda streams had positively weak relationship.
Mean monthly loads of pollutants in the inflow and outflow streams of Kinawataka wetland
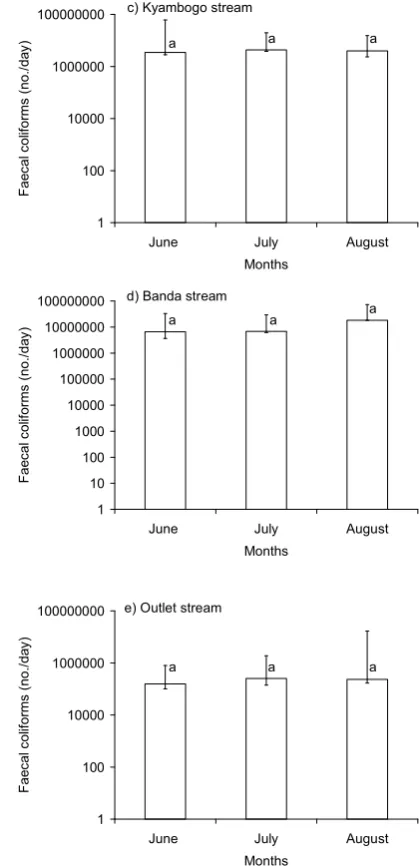
Only loads for the dry months were computed. This is because surface runoff into the streams during the wet months was not estimated. The loads of faecal coliforms in the streams during the dry months are presented in Figure 3.
1 100 10000 1000000 100000000 10000000000
June July August
Months
Fa
ecal
col
if
o
rm
s (n
o
./
d
ay
)
a) Pepsi stream
a a a
1 100 10000 1000000 100000000 10000000000
June July August
Months
Faecal col
if
orm
(no.
/day
)
b) Concorp stream
a a a
1 100 10000 1000000 100000000
June July August
Months
Fae
c
al
c
ol
if
orms
(no./
da
y
)
c) Kyambogo stream
a a a
1 10 100 1000 10000 100000 1000000 10000000 100000000
June July August
Months
Fae
c
al
c
ol
if
orms
(no./
da
y
)
d) Banda stream
a a a
1 100 10000 1000000 100000000
June July August
Months
Fae
c
al
c
ol
if
orms
(no./
da
y
)
e) Outlet stream
a a a
Figure 3 (a, b, c, d and e): Faecal coliforms loads in the inflow and outflow streams of Kinawataka during the dry months. Similar letters indicate non significant difference. There were relatively similar loads of faecal coliforms in all the streams for the different dry months. The loads were not significant between the dry months for all the streams (p > 0.05).
0 10000 20000 30000 40000 50000 60000 70000 80000 90000
July August
Months
T
S
S (m
g/day)
a) Pepsi stream
[image:5.595.44.279.157.221.2]0 10000 20000 30000 40000 50000 60000 70000 80000 90000 100000 110000 120000
July August
Months
T
SS (m
g/day)
b) Concorp stream
a b
-10000 0 10000 20000
July August
Months
T
SS (m
g/day)
c) Kyambogo stream
a a
0 10000 20000
July August
Months
T
SS (m
g/day)
d) Banda stream
a a
0 10000 20000
July August
Months
T
SS (m
g/day)
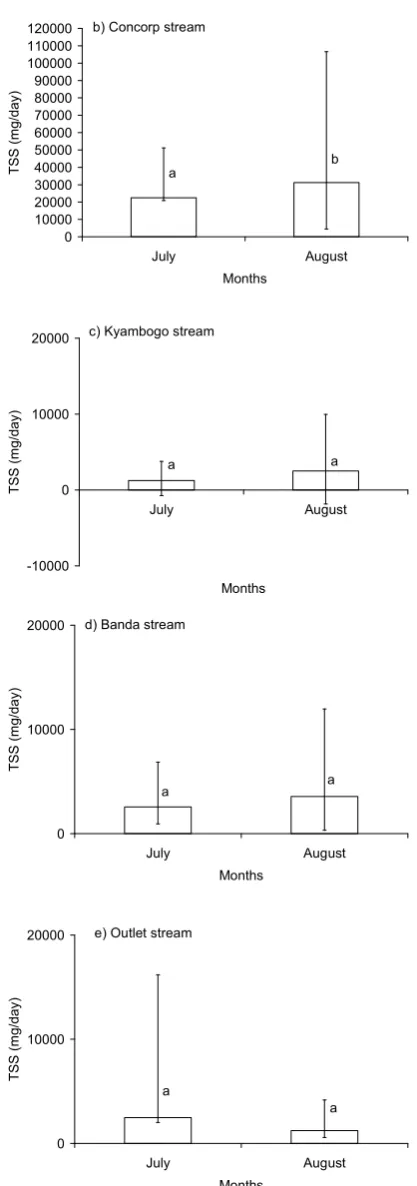
e) Outlet stream
a
a
Figure 4. The TSS loads of the dry months for the inflow and outflow streams of Kinawataka wetland
The load of TSS was higher in the dry month of August for all the streams except for the Outlet stream that had higher load in July. High loads exhibited high variability as well. TSS loads were non significant between the dry months except for Concorp stream.
Relationship of rainfall amounts with the pollutants loads in Kinawataka streams
[image:6.595.59.268.49.643.2]The impact of rainfall on the pollutants loads was determined using Pearson correlation. The relationship between total monthly rainfall with faecal coliforms and TSS loads for the inflow and outflow streams were determined (Table 2).
Table 2: Pearson correlation of total monthly rainfall with faecal coliforms and TSS loads
Stream Faecal coliforms TSS Pepsi (S1) r = 0.662, p = 0.539 r = -0.532, p = 0.643
Concorp (S2) r = 0.256, p = 0.835 r = -0.454, p = 0.700
Kyambogo (S3) r = -0.918, p = 0.259 r = -0.212, p = 0.864
Banda (S4) r = 0.275, p = 0.823 r = -0.455, p = 0.700
Outlet (S5) r = -0.792, p = 0.418 r = -0.955, p = 0.191
The relationships were significantly different for both faecal
coliforms and TSS loads (p > 0.05).Faecal coliform loads and
total monthly rainfall had negatively strong relationship for kyambogo and outlet streams while TSS had negative strong relationship for all the streams.
Monthly retention of faecal coliforms and TSS in Kinawataka wetland
[image:6.595.317.550.137.200.2]The retention of the pollutants by the wetland during the dry months is presented in Table 3.
Table 3: Retention of pollutants in Kinawataka wetland during the dry months
Dry months Faecal coliforms TSS
June 99.95 -
July 99.90 94.62
August 99.93 98.00
Retention was similar for faecal coliforms but slightly different for TSS during the dry months. The retention of TSS increased towards the end of the dry season (August).
DISCUSSION
The year 1999 exhibited non significant rates in the rainfall trend. Rainfalls during the research period (May - September) were categorized as normal for activity except for the month of July that had below normal rainfall. Such changes in rainfall amounts are known to play an important role for wetlands established in depression and may also be important for adjusting the size of lacustrine wetlands through seasonal wet and dry regimes of the edges (Pattern, 1990; NEMA, 2005). In addition, the amount of water in the wetlands
fluctuates with such regimes. Howell et al. (1998) also
reported that seasonal variability of water depth and nutrient status of water normally controls the types and distribution of wetlands. Kyambogo, Banda and Outlet streams exhibited negative correlation of faecal coliforms numbers with monthly rainfall totals. Similar result was observed for TSS in Pepsi and Outlet streams. The relationships were all significant. This depicts dilution effect of rainfall on the pollutants in the streams. Natural substances from erosion (suspended matter)
exponentially increase in concentration with increased
explained by the well built up channels of concrete and stones that helps to stabilize the channel walls. Therefore, the high discharge of the streams is basically less turbid water from roof tops that are directed into the channels that pour into the streams. To understand dilution effect on pollutants concentrations, Kansiime and Nalubega (1999) suggested the use of the ratio of pollutants concentration to electrical conductivity in streams. The ratio lowers with increasing dilution. The decreasing TSS concentrations in the Outlet during the dry months imply reduced strength of flushing from
the wetland towards the end of dry season. Floating Cyperus
papyrus wetlands retain more volume of water during wet months which is gradually release into the beginning of dry months.
In broad terms, large catchments respond to long duration rainfall (over weeks or months) whereas flooding on small catchments is normally caused by brief intense rainfall such as thunderstorms, and the size of flood is also determined by the proportion of rainfall that reaches the stream and the speed of runoff (Acreman, 2000; De Winnaar and Jewitt, 2010). Deforestation and urban developments (with large areas of roof tops, roads, car parks etc) with soils that are compacted and compounds that are covered with concrete, are usually impermeable, so a high proportion of the rainfall runs off rapidly into the streams causing dilution. In addition, very few practice rain water harvesting. Therefore rain water gradually ends up into the streams increasing discharge. Positive relationship of faecal coliform loads in Pepsi, Concorp and Banda streams is attributable to the discharge from on site sanitary systems (latrines and leaking septic tanks).
The retention trend of TSS increased towards the end of the dry season but faecal coliforms was relatively the same for all the months. It is clear from this study and other studies that wetlands act as a shield between the catchment drainage areas and water bodies by filtering excess run off and pollutants from agriculture, urban and industrial areas ((Seidal et al.,
1978; McCambridge and McMeekin, 1979; Gersberg et al.,
1989; Kansiime and Nalubega, 1999, Kyambadde et al., 2004;
Kansiime et al., 2005; Kanyiginya and Kansiime, 2010). The
extent to which the wetlands reduce the impact is the degree or capacity at which they buffer. However, the function depends on the structure/condition and hydrology of wetlands, and the loads of pollutants from the catchment areas (Hammer and
Kadlec, 1986; Kadlec and Knight, 1996; Kyambadde et al.,
2004). Therefore changes in wetlands ecological functions and attributes can be slow and sometimes difficult to identify within the normal variation of rainfall conditions but may have a long term effect.
Conclusion and recommendations
The indicated 10% - 20% increased runoff as a result of rainfall variability for most of Uganda (MLWE, 2002) will increase faecal coliforms dynamics in Kinawataka wetland streams. Rain harvesting and proper waste disposal should therefore be priority in the area. Conservation strategies should therefore respond to the changing climate and interactions with other human factors such as landscape design which are expected to affect wetlands ecosystem. This study demonstrates that regression exercise offers the potential to
assess the impact that may arise from changes in the catchment of aquatic systems.
Acknowledgement
We are thankful for the World Bank funds through Lake Victoria Environmental Management Project (LVEMP 1), Buffering Subcomponent for sponsoring the research. Our appreciation to the Department of Meteorology, Uganda for availing rainfall data. Further thanks to Makerere University, College of Agricultural and Environmental Sciences, Department of Environmental Sciences that accorded space and consumables for laboratory analysis.
References
Acreman, M. 2000. Wetlands and hydrology. Conservation of Mediterranean wetlands - number 10. Tour du Valat, Arles (France).
APHA 1992. Standard Methods for the Examination of Water
and Wastewater, 18th edition. American Public Health
Association Washington, DC.
Azza, N. G. T., Kansiime, F., Nalubega, M. and Denny, P.
2000. Differential permeability of papyrus and
Miscanthidium root mats in Nakivubo swamp, Uganda.
Aquatic Botany 67: 169 - 178.
Chapman, D. and Kimstach, V. 1992. The selection of water quality variables. In: D. Chapman (ed), water quality monitoring assessment. A guide to the use of biota,
sediments and water in environmental monitoring.
Cambridge University Press, Great Britain.
EC RTD INCO-DEV Programme 2001. Tools for wetland ecosystem resource management in Eastern Africa. Scientific results of the Ecotools project: Lake Victoria wetlands and inshore area. ICA4-CT-2001-10036. Environmental Alert, GEF and UNEP 2007. Climate change.
Uganda National Adaptation Programmes of Action.
Republic of Uganda.
De Winnaar, G. and Jewitt, G. 2010. Ecohydrological implications of runoff harvesting in the headwaters of the
Thukela river basin, South Africa. Physics and chemistry
of the Earth 35: 634 - 642.
Gersberg, R. M., Gearheart, R. A. and Ives, M. 1989. Pathogen removal in constructed wetlands. In: D. A. Hammer (ed), Constructed wetland for wastewater treatment: Municipal, Industrial and Agriculture. Lewis Michigan.
Gomani, M. C., Dietrich, O., Lischeid, G., Mahoo, H., Mahay, F., Mbilinyi, B. and Sarmett, J. 2010. Establishment of a hydrological monitoring network in a tropical Africa
catchment: An integrated participatory approach. Physics
and Chemistry of the Earth 35: 648 - 656.
Hammer, D. E. and Kadlec, R. H. 1986. A model for wetland
surface water dynamics. Wat. Res. 13(22): 1951 - 1958.
Howell, P., Lock, M., and Cobb, S. 1998. The Jonglei canal: impact and opportunity. Cambridge University Press, Cambridge.
Kadlec, R. H. and Knight, R. L. 1996. Treatment wetlands. Lewis publishers, New York.
Kansiime, F., Opio, A., Mafabi, P. and Busulwa, H. 2005. Kinawataka wetland: a functional ecosystem that can be used as a reference to conserve other wetlands in Uganda.
In: J. Vymazal, Natural and constructed wetlands: Nutrients, metals and management, Backhuys Publishers, Leiden, The Netherlands.
Kanyiginya, V., Kansiime, F., Kimwaga, R. and Mashauri, D. A. 2010. Assessment of nutrient retention by Natete
wetland Kampala, Uganda. Physics and Chemistry of the
Earth 35: 657 - 664.
Kyambadde, J., Kansiime, F., Gumaelius, L. and Dalhammer, G. 2004. Hydraulic loading, stability and water quality of
Nakivubo wetland, Uganda. African Journal of Aquatic
Sciences 29(2): 213 - 220.
Lake Victoria Environmental Management Project 2005.
Knowledge and experiences gained from managing Lake Victoria ecosystems. G. A. Mallya, F. F. Katagira, G. Kanģoha, S. B. Mbwana, N. Azza, E. Wakwabi, S. W. Njoka, M. Kusewa and H. Busulwa (eds). Colour Print (T) Limited, Dar es Salaam, Tanzania. ISBN 9987 - 8976 - 5 - 7.
Lovejoy, T. E. and Hannah, l. (eds) 2005. Climate change and biodiversity. Yale University Press, New Haven and London.
McCambridge, J. and Mcmeekin, T. A. 1979. Protozoan
Predation of Escherichia coli in Estuarine waters. Water
Research, 13: 659 - 663.
Ministry of lands, water and environment 2002. Initial
national communication on climate change. Uganda. Ministry of Water and Environment 2001. Uganda’s needs for
the preparation of National adaptation programmes of action (NAPA). Paper No. 20: Uganda. In: United Nations Framework Convection on Climate Change.
Subsidiary Body for Implementation. 5th Session,
Marrakesh, 29 October - 6 November.
Item 4 of the ProvisionalAgenda. http://unfccc.int/
resource/docs/ 2001 /sbi /misc01.pdf. Pg. 108 - 113. Retrieved on 20/07/2011.
National Environment and Management Authority (NEMA) 2005. State of Environment Report, Uganda.
National Environment Management Authority (NEMA) 2005. The future of wetlands in Uganda (Key note address presented at a public debate organized by the WID and the Uganda museum to mark the World Wetlands Day in 2005, Uganda.
NEMA 2005. State of Environment Report, Uganda. Print
Dynamix, South Africa
NWCP 2000. Key points on wetland management programme, Brochure supplement for world wetlands day, February 2000, Kampala - Uganda.
Opio, A., Lukale, J. K., Masaba, I. S. and Oryema, C. 2011. Socio-economic benefits and pollution levels of water resources, Pece wetland, Gulu Municipality-Uganda.
African Journal of Environmental Science and Technology (In Press).
Patten, B. C. 1990. Wetlands and shallow continental water bodies, Vol. 1. Natural and human relations. SPB Academic Publishing, The Hague.
Sahagian, D. and Melack, J. (eds) 1996. Global wetland distribution and functional characterization: Trace gases and the hydrological cycles. Report from the Joint IGBP
GAIM – DIS – BAHC – IGAC– LUCC workshop,
Santa Barbara CA. http://gaim.unh.edu /Products/
Reports/Report_2/report 2.pdf. 1996. Accessed on 20/08/2008.
Seidal, K., Happel, H. and Graue, G. 1978. Contribution to revitalisation of waters. Limnologische Arbeitsgruppe, Max - Planck - Gesellschaft.
Swan, A. 2010. How increased urbanization has induced flooding problems in UK: A lesson for Africa cities?
Physics and Chemistry of the Earth 35: 643 - 647.