Accelerometer-based Activity Recognition:
Reengineering Study
Ftoon Kedwan
School of Computing Queen’s University Goodwin Hall, Kingston
Ontario, Canada
ABSTRACT
Topic: This study aims to invent a tool to detect human activities using the power of classifiers ensemble approach to recognize activities based on accelerometers measures. Further classifiers performances were compared and analyzed for the aim of obtaining a magnificent physical activities recognition performance.
Methodology: Accelerometer sensors of smartphones were used to recognize specific human activities. WEKA machine learning software was used to run the experiments. Average of probabilistic combining rule was used to combine Multilayer perceptron (MLP), Decision tree (J48), and Logistic regression techniques. This model is about using the voting algorithm to combine the power of those three classifiers. The reproduced voting results were then compared with few extra classification algorithms proposed in this article such as KNN, K Star, Random Forest, Naïve Bayes, Decision table, and PART. The additional ensemble techniques are Boosting, Bagging, and Stacking. 10-fold cross validation was used to validate accuracies of the resulted models. Confusion matrices of each classifier were obtained and analyzed. For models’ evaluation, accuracy, F-measure, and Area Under Curve (AUC) was calculated to evaluate models’ performances in addition to Precision and Recall measures. A dataset of 5,418 instances was used.
Results & Discussion: In general, the results of Accuracy, AUC, F-Measure, Recall, and precision shows that Random Forest classifier achieved the best performance compared to the authors proposed voting technique for all physical activities except for jogging (RF=98.40, Voting=99.60) and standing (94.30, Voting=97.20) even though the difference is limited to a maximum of 0.10% weighted score for RF. In addition, Bagging ensemble technique achieved considerably high scores similar to the voting technique with a difference of a maximum of 0.20% between both classifiers. On the other hand, Boosting and Stacking algorithms achieved the poorest performances among other classifiers ranging from 14.80% to 74.70%.
General Terms
Activity Recognition Classification, Weka, Accelerometer Sensors Data, Classification Analysis Algorithm.
Keywords
Activity Recognition, Weka, Accelerometer Sensors, Classification Algorithm.
1.
INTRODUCTION
Lack of physical activity and extra sedentary behaviors (e.g. TV watching, internet surfing, video games playing), have proved to be significantly associated with increased health
risks causing obesity, depression, cardiovascular disease, type 2 diabetes, and other mortality causes [1], [2]. A national health and nutrition examination survey study proved that usually Americans spend around 55% of their waking time, which is a total of 7.7 hours per day, being inactive while less than 5% of adults meet the national 30 minutes/day guideline for physical activity [3].
Comparing the physical activity and inactivity patterns study among a sample of obese and non-obese middle school children resulted in a consistent hypothesis stating that physical inactivity is an important factor in the maintenance of childhood obesity [4].
In addition, daily free-living activities and exercising is strongly related with all causes of mortality among older adults. Observational studies proved that older adults who reported low daily physical activities suffer a higher risk of mortality compared with those who reported moderate to high hours of daily activities [5]. Thus, measuring daily activities of older adults would lead to survival advantages by lowering the risk of mortality through expending energy over any activity that would influence their survival.
Active lifestyles have a lot of health benefits including better cardiovascular, blood pressure, glucose conditions besides bone health, not mentioning the obvious weight control benefits and psychological promotions mentioned earlier. Also, active people are more susceptible to have higher levels of self-esteem, life satisfaction, and happiness, and less anxiety, depression, and stress [6].
In this paper, a thorough analysis of daily activities measurements will be discussed for the aim of inventing dedicated tools available for people in their smartphones that they carry with them all the time to facilitate a better health observation and improvement.
In the next section, related works will be discussed, and in the following sections a technical description of data and measurements analysis will be further elaborated.
2.
RELATED WORK
embedded in smartphones has proved to provide significantly accurate physical activity recognition [1].
A most recent study by Reyes-Ortiz (2015) presenting the transition-aware human activity recognition system architecture with the ability of recognizing physical activities using smartphones or wearable sensors. This architecture includes a more advanced technique than what is used in the re-engineered article in that it targets real-time classification with a collection of inertial sensors. It also addresses misclassification occurrences of transition activities and feed them into the learning algorithm for the purpose of improving their prediction techniques. Two implementations of the architecture were utilized to differ between transitions by automatically learning them and feeding them into the system or by simply considering them as unidentified activities by combining the probabilistic production of their serial activity predictions of a support vector machine together with a heuristic filtering approach. This study resulted in a significant state-of-the-art baseline that works and reveals the main advantages of the architecture [7].
A novel technique was described to combine daily living motion data with scene information and fuzzy logic to capture complex instrumental activity characteristics of older adults by means of a single Microsoft Kinect Depth Sensor for the purpose of studying the behavior patterns of older adults in order to detect health changes. To accomplish this idea, Banerjee et al (2015) built an activity model using contextual information conducted by incorporating scene information. This experimental study algorithm is considered to be powerful for its ability to generalize different daily activity models while continuously feeding more motion postures to the model from learned activity positions. The study results were validated by comparing it with the Hidden Markov Model (HMM) classifier and its variations [8]. This algorithm could considerably benefit in-home activity monitoring systems to alert healthcare providers of noteworthy progressive changes in daily living activities behavior patterns of weak older adults for potential risks such as cognitive impairment, fall, or any other health changes.
Unsupervised discovery and monitoring of elderly people habits that characterizes their activities by their periodicity and variability explores their ability to carry out the daily living activities that is a great challenge in order to improve aging at home. Souflas et al (2014) believe that this purpose became applicable these days with the emergence of smart homes and sensor networks which allows the non-intrusive collection of data describing the activities in homes by detecting changes in regular behaviors of older adults that may help to detect emerging disorders (e.g. fall). The collected data is used to mine periodic patterns using extended episode discovery algorithm demonstrating the habits of a particular individual. This algorithm searches for regular patterns, emphasizing the periodicity and variability of each discovered pattern which allows a high flexibility and adaptability to different individuals with their variable lifestyles [9].
Guiry et al (2014) explores a technique of detecting human activities accurately using a smartphone accelerometer paired with a devoted chest sensor which is described through sequential trials that were carried out to test the viability of the system. Offline analysis of recorded activities from these trials was conducted to compare a custom mobility classifier to de-facto machine learning algorithms, including cart, c4.5, multi-layer perceptron, SVM, and naïve Bayes. Those
[image:2.595.309.549.258.671.2]analysis indicated that smartphone accelerometers together with chest sensors are capable of recognizing a range of variable activities including sitting, lying, running, standing, walking and cycling with accuracies as high as 98% [10]. A smartphone-based system for electronic daily self-monitoring purposes was developed by Faurholt-Jepsen et al (2014) to investigate differences of mood instability between bipolar disorder type I and II patients by observing and studying patient’s daily illness activities obtained by smartphone sensors. This experimental study resulted in the fact that Euthymia (mental stability) is only obtained for a considerable amount of time periods in patients suffering bipolar disorder type i. Thus, consecutive data gathered from smartphone-based systems helped to emphasize the need of improving treatment approaches for bipolar disorder type II [11].
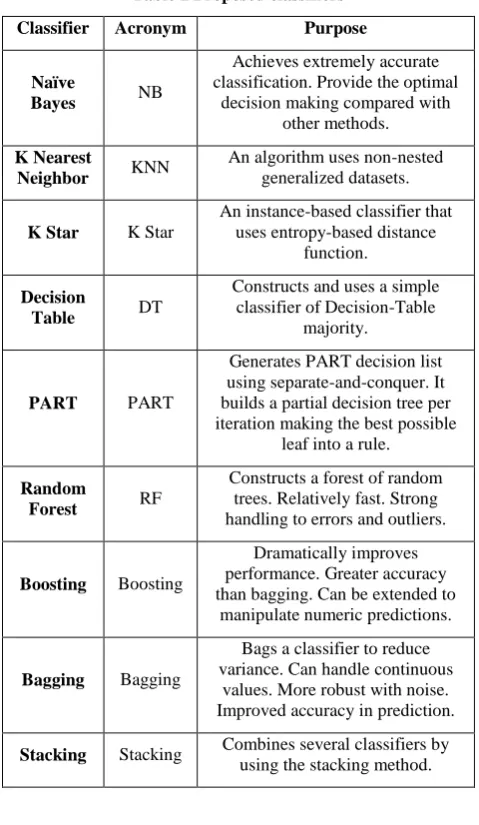
Table 1 Proposed classifiers
Classifier Acronym Purpose
Naïve
Bayes NB
Achieves extremely accurate classification. Provide the optimal
decision making compared with other methods.
K Nearest
Neighbor KNN
An algorithm uses non-nested generalized datasets.
K Star K Star
An instance-based classifier that uses entropy-based distance
function.
Decision
Table DT
Constructs and uses a simple classifier of Decision-Table
majority.
PART PART
Generates PART decision list using separate-and-conquer. It builds a partial decision tree per iteration making the best possible
leaf into a rule.
Random
Forest RF
Constructs a forest of random trees. Relatively fast. Strong handling to errors and outliers.
Boosting Boosting
Dramatically improves performance. Greater accuracy than bagging. Can be extended to
manipulate numeric predictions.
Bagging Bagging
Bags a classifier to reduce variance. Can handle continuous
values. More robust with noise. Improved accuracy in prediction.
Stacking Stacking Combines several classifiers by
using the stacking method.
3.
METHODOLOGY
network method that maps any input interpretations into output classifications were evaluated. A new suggested ensemble of classifiers of meta-algorithms (Voting) was then added. Voting follows the mechanism of combining the power of several other standalone classifiers and uses a combination rule, in this case the average of probabilities, for the purpose of decision making.
In the re-engineering practice, additional classifiers will be compared to the three previously-used ones. Those additional classifiers are: KNN, K Star, Random Forest, Naïve Bayes, Decision table, and PART. The additional ensemble techniques are Boosting, Bagging, and Stacking. Table 1 shows the purpose and the advantage of using and utilizing each proposed classifier.
Throughout the experiments, 10-fold cross validation approach was used. To compare the performance variances of each classifier individually, confusion matrices were generated and then compared to the performance of the voting classifier. Since the dataset is balanced, accuracy measures to evaluate the models’ performances were used beside the F-measure and Area Under Curve (AUC) parameters in addition to Precision and Recall measures. Table 13 shows the
equations used to obtain each evaluation metrics mathematically. Classifiers evaluations techniques will be analyzed and discussed for the aim of proving the authors declaration in that Voting classifier has achieved the best performance compared with each classifier individual performance. In addition, all of the voting combing rules will be measured and compared to decide if the author was right when he chose the average of probabilities to be the best aggregation method to be used.
In this study, there will be a reproduction of the same confusion matrices and accuracy evaluation results of the used article and add new classifiers and ensemble techniques shown in Table 1 to measure the performance variances and try to produce similar or close results of the used classifiers for the sake of presenting the classifier who achieved the most optimal performance.
[image:3.595.51.552.334.468.2]In the article, the default WEKA settings were used for all classifiers, thus, the same settings will be assured in the re-engineering practice. For validation, the 10-fold cross-validation protocol will also be used. The total number of instances used in this study is 5,418 instances.
Table 2 Reproduced confusion matrix of J48- based recognition approach
Walkin
g Jogging Upstairs Downstairs Sitting Standing Accuracy AUC
F-measure Precision Recall
1988 19 37 34 2 95.53 0.972 0.946 0.937 0.955
17 1563 31 13 0 96.18 0.98 0.958 0.955 0.962
59 37 427 106 1 67.56 0.86 0.68 0.684 0.676
53 14 126 334 1 63.26 0.868 0.657 0.685 0.633
3 1 2 1 295 96.41 0.985 0.975 0.987 0.964
2 3 1 0 0 97.56 0.99 0.972 0.968 0.976
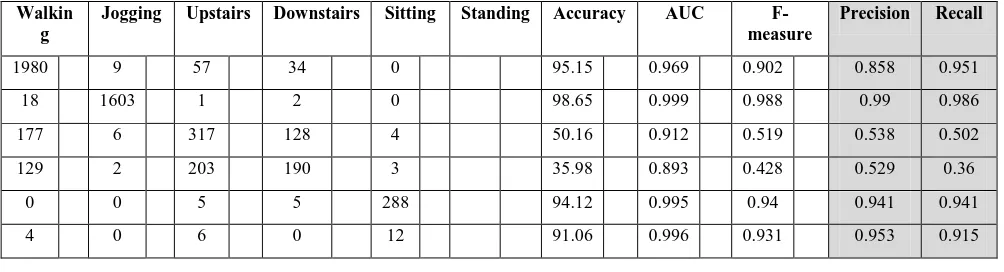
Table 3 Reproduced confusion matrix of Logistic Regression- based recognition approach
Walkin g
Jogging Upstairs Downstairs Sitting Standing Accuracy AUC
F-measure
Precision Recall
1980 9 57 34 0 95.15 0.969 0.902 0.858 0.951
18 1603 1 2 0 98.65 0.999 0.988 0.99 0.986
177 6 317 128 4 50.16 0.912 0.519 0.538 0.502
129 2 203 190 3 35.98 0.893 0.428 0.529 0.36
0 0 5 5 288 94.12 0.995 0.94 0.941 0.941
4 0 6 0 12 91.06 0.996 0.931 0.953 0.915
4.
EXPERIMENT
Throughout the reengineering experiments, WEKA toolkit was used to run the classifiers chosen in the article which are J48, logistic regression, MLP and the classifier ensemble technique (Voting). The same physical activities dataset obtained by accelerometers sensors used in the article was again used in this study. Almost the same identical results of the article have been obtained using the same testing and running environment. Tables 2- 5 shows the confusion matrices of the three individual classifiers (J48, Logistic Regression, and MLP) besides the ensemble of classifiers approach (Voting). The table shows both the original results
Even though there are a slight difference between the authors results and the reproduced results in tables 4-5 ranging from 1 to 25 points, but still there is no significant noteworthy change in both results in general.
[image:3.595.48.550.490.626.2]reproduced results. On the other hand, J48 has maintained its slightly greater performance for standing activity (J48=97.5 compared with Voting=97.2) but the gap between the J48 and Voting performance for standing activity have narrowed from 0.81% to 0.36% which is still considered as an improvement for Voting technique. Thus, it is possible to state now that the
voting mechanism has beaten all other standalone classifiers’ performances.
[image:4.595.44.550.162.298.2]In addition to proving the author’s proposed ensemble technique superiority, it is still challenging to recognize upstairs and downstairs activities (80.5%, 63.6% respectively).
Table 4 Reproduced confusion matrix of Multi-Layer Perceptron based recognition approach
Walking Jogging Upstairs Downstairs Sitting Standing Accuracy AUC F-measure Precision Recall
2027 2038 2 1 25 29 26 12 0 1 97.41 97.9 0.995 0.976 0.978 0.977 0.979 6 3 1609 1613 6 5 3 2 1 2 0 99.02 99.3 0.999 0.994 0.995 0.997 0.993 14 17 1 3 520 495 93 110 3 2 1 5 82.28 78.3 0.957 0.952 0.77 0.737 0.695 0.783 21 26 2 1 161 172 340 323 1 3 5 64.39 61.2 0.933 0.92 0.685 0.661 0.718 0.612 31 0 2 0 1 292 290 9 12 95.42 0.998 0.999 0.962 0.963 0.98 0.948
[image:4.595.48.550.327.520.2]3 2 0 5 9 2 4 1 232 94.31 0.994 0.991 0.943 0.921 91 0.943
Table 5 Reproduced confusion matrix of Voting based recognition approach
Walking Jogging Upstairs Downstai
rs Sitting
Standin
g Accuracy AUC
F-measure
Precisi on
Reca ll
205 4
204
4 8 3 10 21 8 12 0 1
98.7 0
98. 2
.99 9
.97 6
.98 7
.97
6 .969 .982 14 2 159
8 161
8 9 4 4 0 0 0 1
98.3 4
99. 6
.99 8
.99 9
.98 6
.99
3 .991 .996
3 26 4 9 53
8 20
9 85 2 0 1
85.1 3
80. 5
.98 3
.96 9
.81 3
.76
9 .737 .805
9 36 5 2 12
9 15
1 38
4 33
6 1 2 0 1
72.7 3
63. 6
.98 1
.96 7 .76
.69
9 .774 .636
1 0 0 3 1 0 1 30
0 29
9 2 5
98.0
4 1
.98 5
.98
2 .987 .977
2 1 1 3 5 2 0 0 23
8 23
9 96.7
5 97.
2 .99
5 .99
1 .97
7 .93 .964 .972
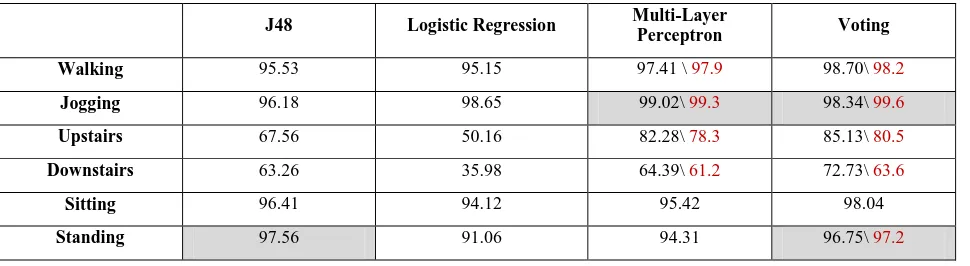
Table 6 Comparison of various activity recognition models based on accuracy
J48 Logistic Regression Multi-Layer
Perceptron Voting
Walking 95.53 95.15 97.41 \ 97.9 98.70\ 98.2
Jogging 96.18 98.65 99.02\ 99.3 98.34\ 99.6
Upstairs 67.56 50.16 82.28\ 78.3 85.13\ 80.5
Downstairs 63.26 35.98 64.39\ 61.2 72.73\ 63.6
Sitting 96.41 94.12 95.42 98.04
[image:4.595.59.544.549.682.2]Table 7 Comparison of various activity recognition models based on precision
J48 Logistic Regression Multi-Layer Perceptron Voting
Walking 0.937 0.858 0.977 0.969
Jogging 0.955 0.99 0.997 0.991
Upstairs 0.684 0.538 0.695 0.737
Downstairs 0.685 0.529 0.718 0.774
Sitting 0.987 0.941 0.98 0.987
[image:5.595.57.538.233.354.2]Standing 0.968 0.953 91 0.964
Table 8 Comparison of various activity recognition models based on recall
J48 Logistic Regression Multi-Layer Perceptron Voting
Walking 0.955 0.951 0.979 0.982
Jogging 0.962 0.986 0.993 0.996
Upstairs 0.676 0.502 0.783 0.805
Downstairs 0.633 0.36 0.612 0.636
Sitting 0.964 0.941 0.948 0.977
Standing 0.976 0.915 0.943 0.972
As an additional effort, the used classifiers were evaluated using more measurement parameters such as precision and recall. In table 7-8, the performance evaluation of the activity recognition models was compared using the same classifiers based on their precision and recall scores as additional parameters.
Table 7 shows the precision scores of how exactness did the classifiers labeled positive cases as positive. The results show
[image:5.595.52.550.474.606.2]that for walking and jogging, MLP was the most precise classifier to recognize them (97.7%, 97.7%), while J48 was the best to recognize standing postures (96.8%). Voting was most precise with two activities only (upstairs 73.7% and downstairs 77.4%) sharing J48 with the same level of precision for classifying sitting postures (98.7%).
Table 9 Comparison of various voting combining rules
Average of probabilities
Majority voting
Product of probabilities
Minimum probability
Maximum probability
Walking 98.70 98.2 98.65 98.1 97.53 96.4 97.53 96.3 97.55 97.3
Jogging 98.34 99.6 98.03 99.4 97.82 97 97.82 96.7 97.48 98.8
Upstairs 85.13 80.5 82.75 75.3 79.81 76.6 79.32 75.8 79.11 75.6
Downstairs 72.73 63.6 72.92 60.4 72.64 66.3 72.64 66.9 67.61 64.8
Sitting 98.04 98.04 97.0 96.4 96.7 97.1 96.7 96.7 97.39 97.4
[image:5.595.56.545.634.757.2]Standing 96.75 97.2 95.53 96.7 94.14 96.3 94.14 96.3 97.15 95.9
Table 10 Comparison of the proposed activity recognition models based on Accuracy
NB KNN K Star DT PART RF Boosting Bagging Stacking
Walking 89.7 96.6 91.4 96 94.8 98.3 96.9 98.9 1
Jogging 93.4 97.8 95.4 86.1 97 98.4 88.3 96.7 0
Upstairs 17.6 64.4 54.4 49.4 70.4 81.5 0 79.1 0
Downstairs 21.4 59.3 53.6 38.4 66.1 69.1 0 75 0
Sitting 94.4 79.4 83.7 84.6 96.1 96.4 0 95.4 0
Table 11 Comparison of the proposed activity recognition models based on AUC
NB KNN K star DT PART RF Boosting Bagging Stacking
Walking 0.912 0.95 0.975 0.963 0.963 0.997 0.704 0.996 0.499
Jogging 0.0.978 0.989 0.998 0.981 0.984 0.998 0.921 0.988 0.499
Upstairs 0.824 0.788 0.915 0.9 0.864 0.974 0.616 0.982 0.498
Downstairs 0.807 0.777 0.906 0.889 0.864 0.973 0.645 0.977 0.498
Sitting 0.998 0.898 0.999 0.958 0.985 0.1 0.649 0.991 0.496
[image:6.595.54.542.234.538.2]Standing 0.988 0.693 0.993 0.926 0.972 0.999 0.65 0.946 0.495
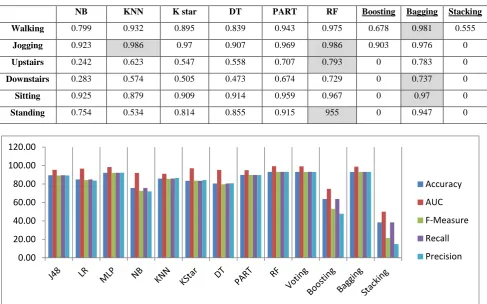
Table 12 Comparison of the proposed activity recognition models based on F-Measure
NB KNN K star DT PART RF Boosting Bagging Stacking
Walking 0.799 0.932 0.895 0.839 0.943 0.975 0.678 0.981 0.555
Jogging 0.923 0.986 0.97 0.907 0.969 0.986 0.903 0.976 0
Upstairs 0.242 0.623 0.547 0.558 0.707 0.793 0 0.783 0
Downstairs 0.283 0.574 0.505 0.473 0.674 0.729 0 0.737 0
Sitting 0.925 0.879 0.909 0.914 0.959 0.967 0 0.97 0
[image:6.595.53.543.239.535.2]Standing 0.754 0.534 0.814 0.855 0.915 955 0 0.947 0
Figure 1 Classifiers Comparison Chart
In table 8, a relatively similar results of precision table can be seen, except that voting has beaten MLP with jogging classification (MLP=99.3% and Voting = 99.6% ) and J48 with sitting postures (J48= 96.4% and Voting=97.7%). Considering table 7-8 with the comparison of previous accuracy results, it can be concluded that in general voting has the best performance evaluation according to human activities recognition which supports the author’s declaration.
To be able to decide which aggregation method is the best combining rule to be used, all voting combing rules were measured and compared as shown in table 9.
As stated in the article, the average of probabilities combining rule has also scored almost the highest performance measurements in the reproduced (red) percentages and thus it will still be used in the reengineering practice as well. In the re-engineering practice, additional classifiers are compared to the three previously-used ones. Those additional
classifiers are: KNN, K Star, Random Forest, Naïve Bayes, Decision table, and PART. The additional ensemble techniques are Boosting, Bagging, and Stacking.
For the sake of proposed classifiers evaluation, validation, and comparison, and while the author has discussed accuracy, AUC, and F-Measure parameters, here are comparisons of proposed classifiers using the same evaluation techniques to have a clear perspective of our data and classifiers performances.
Tables 7-9 presents the proposed WEKA classifiers together with the three ensemble techniques explained in table 1. In table 10, the accuracy results of the classifiers that represents the correct proportion of the entire number of predictions that were classified by the algorithms clearly show how superior RandomForest perform compared to other classifiers and ensemble algorithms except for Bagging in recognizing Walking activity (RF=98.3%, Bagging=98.9%).
0.00 20.00 40.00 60.00 80.00 100.00 120.00
Accuracy
AUC
F-Measure
Recall
In table 11, the AUC results which shows the best model on the average again presents the RF as having the best performances among almost all physical activities except for sitting postures. K-star has proved to be 0.001% better in recognizing sitting conditions than RF does. As the percentage is extremely small, it can be concluded that AUC results prove the superiority of RF in recognizing all physical activities.
In table 12, F-measure results were presented to compare classifiers results of recognizing a large variety of human physical activities. Results ranged from RF to Bagging. Those two classifiers have an equal performance as per F-measure results comparison as each of them has scored 3 highest recognition performances. Further comparisons with those two classifiers and the previously used classifiers (J48, Logistic Regression, and MLP) will be conducted to come up with the classifier who achieved the most optimal performance. It is noteworthy to say here that KNN has shown a remarkable performance in recognizing jogging activity (98.6%) similar to RF performance.
Figure 1 shows a histogram graph of how classifiers have performed compared to each other in terms of Accuracy, Precision, Recall, AUC, and F-Measure.
In general, the results of Accuracy, AUC, F-Measure, Recall, and precision shows that Random Forest classifier achieved the best performance compared to the authors proposed voting ensemble technique for all physical activities except for jogging (RF=98.40, Voting=99.60) and standing (94.30, Voting=97.20) even though the difference is limited to a maximum of 0.10% weighted score for RF. In addition, Bagging ensemble technique achieved considerably high scores similar to the voting technique with a difference of a maximum of 0.20% weighted score between both classifiers. On the other hand, Boosting and Stacking algorithms achieved the poorest performances among other classifiers ranging from 14.80% to 74.70% weighted scores.
Table 13 Classifiers Evaluation Metrics Equations
Metric Equations
Accuracy (TruePositive+TrueNegative)/All F-measure (2 x Precision x Recall)/ (Precision + Recall)
AUC
TruePositive/ (TruePositive + FalsePositive)
Precision
TruePositive/ (TruePositive + FalseNegative)
Recall
TruPositive/ (TruPositive + FalseNegative)
5.
CONCLUSION
Nowadays monitoring personal health is not considered as a difficult activity with the emergence of smartphones with several types of sensing machines built inside. To be able to medically rely on those smartphone applications, it was necessary to assure the high performance and accurate results of those applications compared with other medical devices designed solely for activity recognition purposes. In addition, and as smartphones are always and easily accompanying individuals, it can be easily used to collect physical activities
movements and types without a clear and uninhabited interruption to individuals’ daily life routines.
In this study, multiple classifiers have been compared for the aim of electing the best performance classifier for most of the activities. The experimental results showed that Random Forest classifier had better results than the voting classifier proposed by the author. This conclusion proves the significance of the classification technique in providing an accurate, precise, and complete description of daily activities recognition.
In the future, it would be interesting to use a suggested technique of using clustering methods (FarthestFirst or Simple K-Means) to cluster the daily activities into two groups: ambulatory physical movements (e.g. walking, jogging, going upstairs and downstairs) and static or sedentary postures (e.g. standing, setting). Clustering the daily activities will help measure the percentage of actual movement activities that the individual embrace in daily bases to monitor the required hours of exercising by a normal individual compared with an obese individual who would require a more intensive daily activity routine. Clustering human physical activities would require a dedicated dataset where activities are designed to be clearly separate and partitioned into those two groups as current dataset didn’t prove any significant separation due to the smooth and gradual increment in activities speed and rapidity. This approach is believed to help obese patients to control and monitor their weight loss and health life more effectively by comparing their relaxed hours with exercising hours based on their age groups and other medical demographics (e.g. body mass weight, bone weight, body fat percentage).
6.
REFERENCES
[1] Catalo, C., Tufekci, S., Pirmit, E., & Kocabag, G. (2015). On the use of ensemble of classifiers for accelerometer-based activity recognition. Applied Soft Computing. [2] Wanmin Wu, Sanjoy Dasgupta, Ernesto E. Ramirez,
Carlyn Peterson, Gregory J Norman. Originally published in the Journal of Medical Internet Research (http://www.jmir.org), 05.10.2012.
[3] Available on PubMed Library
http://www.ncbi.nlm.nih.gov/pubmed/23041431. [4] Burt, V. L., Whelton, P., Roccella, E. J., Brown, C.,
Cutler, J. A., Higgins, M., ... & Labarthe, D. (1995). Prevalence of hypertension in the US adult population results from the Third National Health and Nutrition Examination Survey, 1988-1991. Hypertension, 25(3), 305-313.
[5] Trost, S. G., Kerr, L. M., Ward, D. S., & Pate, R. R. (2001). Physical activity and determinants of physical activity in obese and non-obese children. International journal of obesity and related metabolic disorders: journal of the International Association for the Study of Obesity, 25(6), 822-829.
[6] Manini, T. M., Everhart, J. E., Patel, K. V., Schoeller, D. A., Colbert, L. H., Visser, M., ... & Harris, T. B. (2006). Daily activity energy expenditure and mortality among older adults. Jama, 296(2), 171-179.
healthier lifestyles? Psychological science in the public interest, 4(1), 1-44.
[8] Reyes-Ortiz, J. L., Oneto, L., Samà, A., Parra, X., & Anguita, D. (2015). Transition-Aware Human Activity Recognition Using Smartphones. Neurocomputing. [9] Banerjee, T., Keller, J. M., Popescu, M., & Skubic, M.
(2015). Recognizing Complex Instrumental Activities of Daily Living Using Scene Information and Fuzzy Logic. Computer Vision and Image Understanding.
[10]Soulas, J., Lenca, P., & Thépaut, A. (2015). Unsupervised discovery of activities of daily living characterized by their periodicity and variability. Engineering Applications of Artificial Intelligence, 45, 90-102.
[11]Guiry, J. J., van de Ven, P., Nelson, J., Warmerdam, L., & Riper, H. (2014). Activity recognition with smartphone support. Medical engineering & physics, 36(6), 670-675.
[12] Faurholt-Jepsen, M., Ritz, C., Frost, M., Mikkelsen, R. L., Christensen, E. M., Bardram, J., ... & Kessing, L. V. (2015). Mood instability in bipolar disorder type I versus type II-continuous daily electronic self-monitoring of illness activity using smartphones. Journal of affective disorders, 186, 342-349.
[13] The dataset used in this article is known as WISDM (Wireless Sensor Data Mining) and is publicly available on http://www.cis.fordham.edu/wisdm/dataset.php [14] Witten, I. H., & Frank, E. (2005). Data Mining: Practical
machine learning tools and techniques. Morgan Kaufmann. This is a useful book to know more about WEKA machine learning software.
[15] WEKA toolkit has been used to run the experiment in this article.