Exploration of Various Performance Metrics for
Evaluation and Assessment of School Teachers
Performance
Neeta Panchmukh
MIT School of Education & Research
MIT Art, Design & Technological University Pune
India
Indumati Singh
Tata Consultancy Services, Noida, India
Remica Aggarwal
MIT School of Education & Research
MIT Art, Design & Technological University Pune, India
Nivedita Jamdade
MIT School of Education & Research MIT Art, Design & Technological University Pune,
India
Veena Aggarwal
Recventures Education Services Private Limited Delhi, India
ABSTRACT
School teachers are amongst basic pillars in his/ her students’ outmost growth and performance. Evaluation and assessment of a teacher’s performance is therefore becoming an essential component for any educational establishments . Since the turn of the century, teacher assessment and evaluation have been put forward as an important strategy for assuring and developing educational quality in many countries. Out of 28 countries surveyed in the OECD1 Review on Evaluation and Assessment Frameworks for Improving School Outcomes (2013), 22 reported having national- or state-level policy frameworks for teacher evaluation. In the six remaining countries, practices to provide feedback on teachers’ work were designed and implemented locally. Present research work therefore focuses on exploring based on existing researches, possible indicators or metrics that could be helpful in evaluation of primary and secondary school teachers in Asian countries. Thereafter, it also tries to study the interrelationship amongst them using ISM methodology .
Keywords
Interpretive Structural Modeling (ISM), Teacher evaluation Primary and secondary school teachers
1.
INTRODUCTION
For more than two decades, policymakers have undertaken many varied reforms ranging from new standards and tests to redesigned schools, new curricula and new governance models. The basic reason behind this exercise is the single dominating fact that teachers brings motivation amongst students and every aspect of school reform depends on highly skilled teachers for its success. This is especially true as educational standards rise and the diversity of the student body increases. Teachers need even more sophisticated abilities to teach more complex curriculum to the growing number of public school students who have fewer educational resources at home, those who are new English language learners and those who have distinctive learning needs. One of the few areas of consensus among education policymakers, practitioners, and the general public today is that improving teacher quality is one of the most direct and promising strategies for improving public education .
With the growing requirements of improving teacher quality through skills and training , there is a need to evaluate and
assess the performance of teachers and this calls for developing appropriate metrics or performance indicators .
1.1 Aims / Objectives
The paper focuses on the education sector of Asian countries such as India . The objective of the paper are as follows :
1. To first identify various key performance indicators or metrics to measure and assess the performance of primary as well as secondary school teachers in India .
2. To further study the interrelationships amongst them using ISM methodology.
The paper is arranged as follows : Section 2 presents the literature review . Section 3 presents the ISM methodology and the case example is presented in section 4 followed by conclusions, future directions and managerial implications in section 5.
2.
LITERATURE REVIEW
Literature has examined a variety of metrics to measure general or specific performance of primary and secondary school teachers .These metrics or performance indicators have been searched via search engines such as Google scholar , research gate etc. and it has been found that metrics such as Instructional design , instruction delivery skills , course management skills etc. are some of the prominent ones. These metrics have been described as follows [1-15] .
1. Instructional design (ID): Instructional design for teachers serves as an organized source of directions, which can help classroom teachers to integrate available resources to improve students‘ acquisition of the instructional goals. ID provides to K-12 teachers with a practical instructional design model.
2. Instruction delivery skills (IDS)/ classroom teaching skills : This may include combination of blackboard and ICT based teaching .
4. Value added model5 (VAM): The estimated effects of teacher quality on student performance vary according to the type of VAM being used. VAM looks at year-to-year changes in standardized test scores among students and rates those students' teachers and schools accordingly. When students are found to improve or regress, teachers and schools get the credit or the blame. Hybrid VAM models have also been developed recently by teachers that combines the new school-quality estimates with the older approach.
5. Subject matter knowledge (SMK)/ Content expertise (CE) : Subject matter knowledge is an important predictor of student learning. Teachers who know their students' most common misconceptions are more effective than teachers who do not. This may allow teachers to construct experiences,
6. Teacher’s perception and beliefs (TPB) : This includes beliefs , attitudes and perceptions of the school teachers about external testing and classroom assessment. This also includes the ways in which these beliefs are related to their implementation of standards-based instructional practices. In some research papers , researchers have made use of Teacher Evaluation Experience Scale (TEES) for judging the perceptions and beliefs .
7. Dismissals threats (DT) : Dismissal threats implied by a "minimally effective" rating had meaningful effects: inducing voluntary attrition among low-performing teachers and improvements in the subsequent performance of those teachers who decided to remain.
8. Incentives (In): This factor has remained the leading factor in determining teacher’s performance . Incentives could be monetary or privileges, fringe benefits , extra holidays or medical reimbursements or in form of gifts for remarkable performance.
9. Recruitment, training and certification (RTC) : This is another motivating factor . this keeps the teachers update with the ne teaching concepts to attract students attention and to make better involvement of students in classrooms.
10. Long term impact of teachers (LTI) : Teachers' impacts on students are substantial. Great teachers create great value and test score impacts are helpful in identifying such teachers to determine 1) if differences in test-score gains across teachers measured by VAM capture causal impacts of teachers or are driven primarily by student scoring and 2) if teachers who raise test scores improve their students' outcomes in adulthood or are simply better at teaching to the test.
11. Student achievement data (SAD) : Positive data figures showing remarkable performance of students could be a plus factor in judging the teachers’ performance .
12. Observation ratings (OR) : This metric concerns with the measurement of teacher performance by observation, especially using observation ratings for making high-stakes decisions regarding individual
teachers. It has been found in some researches that teachers’ classroom observation ratings may differ when they teach multiple classrooms as the classroom-level variation may be as great as the teacher-level variation.
3.
INTERPRETIVE STRUCTURAL
MODELLING METHODOLOGY
The modelling technique ISM was proposed by Warfield [6] . This technique stresses on creating a structured graph out of the set of unique interrelated variables . The technique works with the steps viz. First, identifying the relevant elements and establishing a contextual relationship amongst them . Next , an SSIM is developed to establish the led to relationship amongst the two variables i & j . Thereafter, an initial reachability matrix and then a final reachability matrix is created which eventually lead to the development of the reachability set and antecedent set for each criterion . In every iteration a top level element is selected for which the reachability set and intersection sets are the same . Variables are further classified during the MICMAC analysis based on relative driving power and dependence power in to the categories like autonomous, dependent, driver and linkage.
4.
DEVELOPMENT OF ISM MODEL
In this section, ISM model is developed for studying the interrelationships amongst various challenges for Indian sports industry .
4.1Construction of Structural Self
-Interaction Matrix (SSIM)
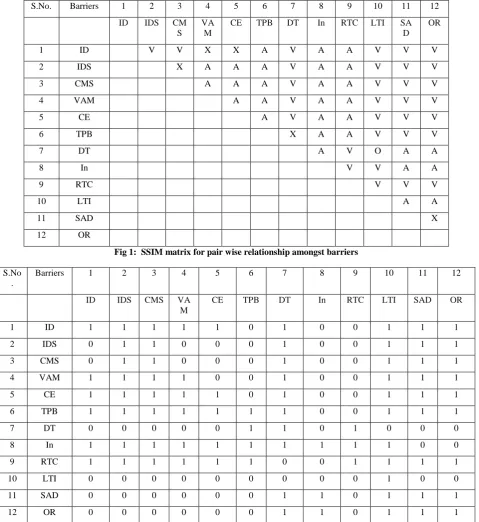
This matrix gives the pair-wise relationship between two variables i.e. i and j based on VAXO. SSIM has been presented below in Fig 1.
4.2 Construction of Initial Reachability
Matrix
and final reachability matrix
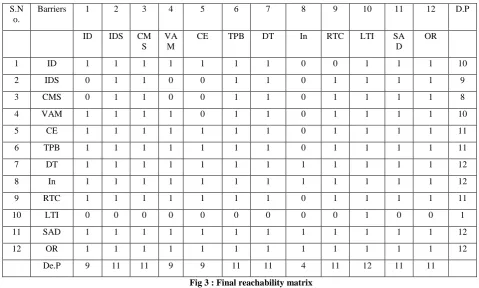
The SSIM has been converted in to a binary matrix called the initial reachability matrix shown in fig. 2 by substituting V, A, X, O by 1 or 0 as per the case. After incorporating the transitivity, the final reachability matrix is shown below in the Fig 3.
improve student achievement data. ID , IDS , CMS , VAM etc. effectively contribute towards achieving positive student achievement data. Sometimes dismissal threats force the teachers to change their perceptions and beliefs and undergo training and certifications to improve their skills . Teacher’s stubbornness about beliefs and reluctance to change may also
invoke dismissal threats. Poor content delivery , poor IDS , ID as well as Poor CMS may lead to dismissal threats. Content expertise benefit as well as benefitted by effective instructional design. Improper use of incentives may lead to dismissal threats
S.No. Barriers 1 2 3 4 5 6 7 8 9 10 11 12
ID IDS CM
S VA
M
CE TPB DT In RTC LTI SA
D OR
1 ID V V X X A V A A V V V
2 IDS X A A A V A A V V V
3 CMS A A A V A A V V V
4 VAM A A V A A V V V
5 CE A V A A V V V
6 TPB X A A V V V
7 DT A V O A A
8 In V V A A
9 RTC V V V
10 LTI A A
11 SAD X
[image:3.595.61.541.134.657.2]12 OR
Fig 1: SSIM matrix for pair wise relationship amongst barriers
Fig 2: Initial reachability matrix S.No
.
Barriers 1 2 3 4 5 6 7 8 9 10 11 12
ID IDS CMS VA
M
CE TPB DT In RTC LTI SAD OR
1 ID 1 1 1 1 1 0 1 0 0 1 1 1
2 IDS 0 1 1 0 0 0 1 0 0 1 1 1
3 CMS 0 1 1 0 0 0 1 0 0 1 1 1
4 VAM 1 1 1 1 0 0 1 0 0 1 1 1
5 CE 1 1 1 1 1 0 1 0 0 1 1 1
6 TPB 1 1 1 1 1 1 1 0 0 1 1 1
7 DT 0 0 0 0 0 1 1 0 1 0 0 0
8 In 1 1 1 1 1 1 1 1 1 1 0 0
9 RTC 1 1 1 1 1 1 0 0 1 1 1 1
10 LTI 0 0 0 0 0 0 0 0 0 1 0 0
11 SAD 0 0 0 0 0 0 1 1 0 1 1 1
Fig 3 : Final reachability matrix
D.P : Driving power ; De.P : dependence power
4.3 Level Partition
Table 2 : Iteration I
S.No .
Reachability set
Antecedent
set
Intersecti on set
Iteratio n/
1. 10 1,2,3,4,5,6,7,8,9, 10,11,12
10
I 2. 2,3,6,7,9,10,
11,12
1,2,3,4,5,6,7,8,9, 11,12
2,3,6,7,9,1 1,12
3. 1,2,3,4,5,6,7, 9,10,11,12,
1,4,5,6,7,8,9,11,1 2
1,4,5,6,7,9 ,11,12
4. 1,2,3,4,5,6,7, 8,9,10,11,
12
7,8,11,12 7,8,11,12
[image:4.595.64.557.383.703.2]From the final reachability matrix, reachability and final antecedent set for each factor are found. The element for which the reachability and intersection sets are same are the top-level element in the ISM hierarchy. After the identification of top level element, it is separated out from the other elements and the process continues for next level of elements. Reachability set, antecedent set, intersection set along with different level for elements have been shown below in table II to table XI.
Table 3 : Iteration II
S.No .
Reachability set
Antecedent set Intersection set
Itera tion
2. 2,3,6,7,9,11, 12
1,2,3,4,5,6,7,8,9, 11,12
2,3,6,7,9,11, 12
II 3. 1,2,3,4,5,6,7,
9,11,12,
1,4,5,6,7,8,9,11,1 2
1,4,5,6,7,9,1 1,12
4. 1,2,3,4,5,6,7, 8,9,11,12
7,8,11,12 7,8,11,12
Table 4 : Iteration III
Sr. No.
Reachability set
Antecedent set
Intersection set
Iter atio n
3. 1,4,5 1,4,5,8 1,4,5
III
4. 1,4,5,8 8 8
Table 5 : Iteration IV
Sr.N o.
Reachability set
Antecedent set
Intersection set
Iterati on
4. 8 8 8 IV
S.N o.
Barriers 1 2 3 4 5 6 7 8 9 10 11 12 D.P
ID IDS CM
S VA
M
CE TPB DT In RTC LTI SA
D
OR
1 ID 1 1 1 1 1 1 1 0 0 1 1 1 10
2 IDS 0 1 1 0 0 1 1 0 1 1 1 1 9
3 CMS 0 1 1 0 0 1 1 0 1 1 1 1 8
4 VAM 1 1 1 1 0 1 1 0 1 1 1 1 10
5 CE 1 1 1 1 1 1 1 0 1 1 1 1 11
6 TPB 1 1 1 1 1 1 1 0 1 1 1 1 11
7 DT 1 1 1 1 1 1 1 1 1 1 1 1 12
8 In 1 1 1 1 1 1 1 1 1 1 1 1 12
9 RTC 1 1 1 1 1 1 1 0 1 1 1 1 11
10 LTI 0 0 0 0 0 0 0 0 0 1 0 0 1
11 SAD 1 1 1 1 1 1 1 1 1 1 1 1 12
12 OR 1 1 1 1 1 1 1 1 1 1 1 1 12
4.5
Classification of factors
Fig . 4: Driving power and dependence diagram
4.4 ISM model
[image:5.595.54.293.77.300.2]An ISM model is developed ( as shown in fig. 5 below ) after arranging the elements as per their interaction or dependence relationships.
Fig 5: ISM diagraph
5.
CONCLUSIONS
The interrelationship amongst the various impediments is studied via an Interpretive Structural Modelling Methodology in the present research . However various other MCDM methods such as PROMETHEE , AHP , FUZZY decision making methods can be explored , studied and incorporated further .
Major challenge before the proper evaluation of teacher’s performance is the top-down implementation of performance management procedures, which due to their control-orientation and hierarchical character, seems to disrupt the existing school culture and established teacher autonomy.
Another research implication could be the involvement of teachers in designing evaluation
systems as it has been observed that there exists inconsistencies between the information provided by current teacher evaluation models and the type of feedback teachers need to develop their practices.
6.
ACKNOWLEDGEMENTS
Author Remica Aggarwal is thankful to Prof. S.P Singh from DMS, IIT Delhi for the knowledge sharing about ISM methodology .
7.
REFERENCES
[1] Crowe, E. 2010. Measuring What Matters: A Stronger Accountability Model for Teacher Education. Washington: Center for American Progress.
[2] Mitchell, K.J. , Robinson, D.Z. , Plake, B.S. and Knowles, K.T. 2001. Testing Teacher Candidates: The Role of Licensure Tests in Improving Teacher Quality. Washington, DC: National Academy Press.
[3] Milanowski, A. 2004. The Relationship Between Teacher Performance Evaluation Scores and Student Achievement: Evidence From Cincinnati. Peabody Journal of Education 79 (4), 33-53.
[4] Humphrey, D. Koppich, J. and Heather H. 2005. Sharing the wealth: National Board Certified Teachers and the students who need them most. Education Policy
Analysis Archives. 13 (18)
Http://epaa.asu.edu/epaa/v13n18/ v13n18.pdf.
[5] Pecheone, R. and Chung, R. 2006. Evidence in Teacher Education: The Performance Assessment for California Teachers. Journal of Teacher Education 57 (1), 22-36.
[6] Athanases, S. 1994. Teachers’ Reports of the Effects of Preparing Portfolios of Literacy Instruction. Elementary School Journal 94 (4) , 421-439.
[7] Haynes, D. 1995. One Teacher’s Experience with National Board assessment. Educational Leadership, 52 (8), 58-60.
[8] Buday, M. and Kelly, J. 1996. National Board Certification and the Teaching Professions Commitment to Quality Assurance. Phi Delta Kappan, 78 (3) , 215-219.
[9] Chung, R.R. 2008. Beyond Assessment: Performance Assessments in Teacher Education, Teacher Education Quarterly, 35(1), 7-28.
[10] Charles P., Gallucci, C. and Sloan, T. 2010. Negotiating implementation of high-stakes performance assessment policies in teacher education: From compliance to inquiry, Journal of Teacher Education 61 (3). http://jte.sagepub.
com/content/early/2010/03/12/0022487109354520.
[11] James Wyckoff , J. Thomas, D. 2013.Teaching quality education and effectiveness , National Bureau of Economic Research.
[12] Goldhaber, Dan; Tseng, Fannie; Goldschmidt, Pete, 2013. Teacher Value-Added at the High-School Level: Different Models, Different Answers?, Educational Evaluation and Policy Analysis.
[13] Cook-Smith, Nancy; Coyle, Harold; Miller, Jaimie; Sadler, Philip; Sonnert, Gerhard. 2013. The Influence of Teachers' Knowledge on Student Learning in Middle School Physical Science Classrooms, American
[image:5.595.56.277.380.775.2]
Figure 1: Driving power and dependence diagram
Driv ing pow er
12 DT,
SAD OR
11 Dr CE Lin TPB
RTC
10 ID
VAM
9 IDS
8 CMS
7
6 Dep
5 Auto
4 In
3
2
1 LTI
1 2 3 4 5 6 7 8 9 10 11 12
Dependence power
In
VAM
DT TPB
IDS
LTI CMS
CE ID
RTC
SAD
Educational Research Journal.
[14] Chetty, Raj; Friedman, John; Rockoff, Jonah. 2011. The Long-Term Impacts of Teachers: Teacher Value-Added and Student Outcomes in Adulthood. , National Bureau of Economic Research Working Paper
[15] Skedsmo, G., Hube , S.G. 2018. Teacher evaluation: the need for valid measures and increased teacher involvement, springer , 30(1), 1–5.
[16] Hallinger, P., Heck, R., & Murphy, J. 2014. Teacher evaluation and school improvement: an analysis of the evidence. Educational Assessment, Evaluation and
Accountability, 26(1), 5–28.
https://doi.org/10.1007/s11092-013-9179-5.
[17] Huber, S. G., & Skedsmo, G. 2016. Teacher evaluation—accountability and improving teaching practices. Educational Assessment, Evaluation and
Accountability, 28(2), 105–109.
https://doi.org/10.1007/s11092-016-9241-1.
[18] Lavigne, A. L., & Chamberlain, R. W. 2017. Teacher evaluation in Illinois: school leaders’ perceptions and practices. Educational Assessment, Evaluation and
Accountability, 29(2), 179–209.
https://doi.org/10.1007/s11092-016-9250-0.
[19] Liu, S., Xu, X., & Stronge, J. H. 2016. Chinese middle school teachers’ preferences regarding performance evaluation measures. Educational Assessment, Evaluation and Accountability, 28(2), 161–177. https://doi.org/10.1007/s11092-016-9237-x.
[20] Meng, L., & Muñoz, M. 2016. Teachers’ perceptions of effective teaching: a comparative study of elementary school teachers from China and the USA. Educational Assessment, Evaluation and Accountability, 28(2), 179– 199. https://doi.org/10.1007/s11092-015-9230-9.
[21] Roegman, R., Goodwin, A. L., & Reed, R. 2016. Unpacking the data: an analysis of the use of Danielson’s (2007) Framework for Professional Practice in a teaching residency program. Educational Assessment, Evaluation and Accountability, 28(2), 111–137. https://doi.org/10.1007/s11092-015-9228-3.
[22] Santelices, M. V., Valencia, E., Gonzalez, J., & Taut, S. 2017. Two teacher quality measures and the role of context: evidence from Chile. Educational Assessment, Evaluation and Accountability, 29(2), 111–146. https://doi.org/10.1007/s11092-016-9247-8.
[23] Skedsmo, G., & Huber, S. G. 2017. Evaluation of educators’ performance—balancing various measures to improve practice. Educational Assessment, Evaluation and Accountability, 29(2), 107–110. https://doi.org/10.1007/s11092-017-9262-4.
[24] Chellma , A.A.C. 2010. Instructional design for teachers : Improving classroom practices , Turkish Online Journal of Distance Education, 12(1) . ISBN 13: 978-0415803243.