Comparing Height-Adjusted Waist Circumference Indices:
The Fels Longitudinal Study
Roy T. Sabo, Chungfeng Ren, Shumei S. Sun
Department of Biostatistics, School of Medicine, Virginia Commonwealth University, Richmond, USA Email: rsabo@vcu.edu
Received May 11, 2012; revised June 20, 2012; accepted July 12, 2012
ABSTRACT
Objectives: While researchers are increasingly recognizing the importance of adjusting waist circumference (WC) for height, no standard has yet been established. In this study we contrast three standard methods for indexing WC by height (using height, root-height and height-squared) via comparisons with age-specific optimal indices. Study Design and Setting: Measurements from 722 male and 746 female Caucasian participants in the Fels Longitudinal Study were used. The three standard waist-circumference indices (as well as an optimal index) were determined for ages 2 through 18, and for every decade thereafter to 70 years of age. Pearson correlations were used to assess the suitability of all in-dices. Results: The three standard indices remain correlated with the original WC measures, though each was associ-ated with height at some ages. Waist-to-height ratio is suitable for some childhood ages (boys: 5 - 9, 13 - 16; girls: 4 - 7, 9, 11 - 14) but not for adult ages; Root-height works well mostly for older teenage children and adults but not in early childhood and adolescence; Height-squared is nowhere suitable. In both men and women, the optimal indexing factor ranged between root-height and height-squared in childhood, and is close to root-height in adulthood. Conclusions: No one index is most suitable, as WC indexed by root-height is suitable for use with measurements from teenage children and adults, while waist-to-height ratio is generally suitable for use in children. WC indexed by height-squared is no-where suitable.
Keywords: Obesity; Adiposity; Stature; Indexing
1. Introduction
Several body composition and cardiac structure and func- tion measurements experience improved predictability of obesity and cardiovascular health measures when they are indexed by height (or a power of height), including body mass index (BMI) [1] and left ventricular mass [2,3]. Waist circumference (WC) is an adiposity measure that, if properly adjusted by some power of height [2], can add predictive ability of childhood body weight to adult blood pressure [4,5]. Several recent studies have found that waist-to-height ratio (WHtR) is better than WC at predicting obesity, overweight [6], cardiovascular risk factors [7] and mortality [8], is better than BMI at predicting hypertension, diabetes, dyslipidemia [9], meta- bolic syndrome [10] and its risk factors [11], type II dia-betes [12] and cardiovascular risk factors [7], and is bet-ter than waist-to-hip ratio (WHR) at predicting cardio-vascular risk factors [7] and mortality[8]. WHtR also has the added benefit of not requiring adjustment for age or sex [13], though that may still be done. Some studies have shown no difference between WHtR, WC and BMI in predicting cardiovascular risk factors [14], while oth-ers have shown that WHtR is inferior to WC as an index
of trunk fat mass [15].
Implicit in these studies and their use of WHtR is the choice of indexing waist circumference by a subject’s height raised to the first power. Though the reason for indexing WC by height is obvious, and the resulting fi-delity of such an index is clear, the rationale for indexing by subject height and not some other power of height is less well developed. For instance, the square of height could be used so that the resulting WC index would par-allel the index for body mass (BMI = body mass/height2). The square-root of height could also be used to index WC, as could any other radical number between zero and one. The problem of properly indexing WC by height is not merely a problem of choice, however, as the expo-nent for height in any index should be selected so that
with height.
The purpose of this study is to compare three com-monly methods used for indexing waist circumference by height (waist-to-height ratio, using the square root of height, and using height-squared) in male and female children and adults. Using data from the Fels Longitudi-nal Study, the three waist circumference indices—as well as the optimal powers for indexing waist circumference by height—are estimated for male and female children at each age between 2 and 18 years of age, and for male and female adults at ten-year intervals from the third through eighth decades. Correlative analyses are then used to de- termine 1) Whether each index remains correlated with the original waist circumference measures not indexed by height; and 2) Whether each index is uncorrelated with the original height measure (i.e. has the index “factored out” the effect of height from waist circumference).
2. Methods
2.1. Study Sample
In this study we analyzed anthropometric data on 722 Caucasian male and 746 Caucasian female participants of the Fels Longitudinal Study (FLS) between 2 and 70+ years of age as of 6/30/2010. FLS participants were en-rolled at birth and were not selected in regard to factors known to be associated with disease, body composition or other conditions [16]. Each participant signed an in-formed consent statement, and procedures were approved by the Institutional Review Boards at Wright State Uni-versity and Virginia Commonwealth UniUni-versity.
2.2. Measurements
Anthropometric measurements were taken following re- commendations in the Anthropometric Standardization
Reference Manual [17]. Waist circumference (WC, cm) was measured twice at the suprailiac crest, with the aver-age value used for statistical analysis. Height was meas-ured to 0.1 cm using a Holtain stadiometer. Children were examined semi-annually (near their birthdays and 6 months following) until 18 years of age, then biannually to 24 years of age. Subsequent adult measurements occurred at five- year intervals until age 40; thereafter, measurements were taken at two-year intervals.
2.3. Statistical Analyses
We summarize waist circumference and height for each gender at every childhood age and adult decade with means and standard deviations. Waist-to-height ratio (WHtR), WC indexed by the square root of height (WCI1), and WC indexed by height-squared (WCI2) are calculated for each subject at each available age. These indices will be graphically represented with means and standard errors
for both genders at each age between 2 and 18 and at each decade thereafter. As an attempt to verify the suit-ability of three WC indices (as well as the optimal index (aWCI), explained below) for adequately measuring WC without being affected by subject height, we will follow the approach used by Khosla and Lowe (1967), who stated that an adequate index (i) should be highly corre-lated with the metric upon which it is based (in this case WC), and (ii) should be uncorrelated with height. We will estimate Pearson correlations to measure the asso- ciations of WHtR, WCI1, WCI2 and aWCI with both WC and height at each age in each gender. The SAS sta- tistical software (version 9.2, Cary, North Carolina, USA) is used for all statistical analyses, and a significance level of α = 0.05 is used for all tests.
To determine the optimal power for height in indexing waist circumference, we follow the method used by Khosla and Lowe (1967), who concluded that the square of height was optimal to index body mass in adults [1]. The predicted value of waist circumference (WC) is given by the equation.
WCWC H H
(1) where WC is the mean waist circumference, is the regression slope between height and waist circumference, and H-bar is the mean height. We then define3
b
H H SD and Ha H 3 SD, such that
WCbWC HbH and
WCaWC HaH , and the optimal exponent is calculated using the following equation:
log WC log WC
log log
b
a a
b
e
H H
(2)
We calculate this exponent each age between 2 and 18 years separately for boys and girls, and at 10 year inter-vals thereafter (20 - 29, 30 - 29, 40 - 49, 50 - 59, 60 - 69 and 70+) for men and women, where any repeated meas-ures for a given subject within any given interval are averaged together. These powers are then used to calcu-late age-specific indices for waist circumference (aWCI).
3. Results
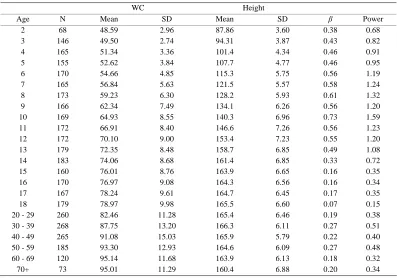
Table 1. Male summary data. Sample sizes (N), mean waist circumference (WC) and standard deviation (SD), mean height and standard deviation, regression slope (β) between weight and centered height, and age-specific optimal power for boys aged 2 to 18 years and adult men in ten-year intervals between ages 20 to 70+.
Height WC
Age MeanN SD Mean SD β Power
2
51 48.61 2.77 88.22 3.75 0.29 0.52
3
125 50.14 3.01 94.97 4.05 0.29 0.56
4
144 51.71 3.15 102.4 4.23 0.29 0.58
5
164 53.48 4.34 108.7 4.67 0.39 0.80
6
173 55.29 5.32 116.0 4.71 0.54 1.13
7
178 57.14 6.67 122.9 6.30 0.58 1.24
8
179 58.71 7.19 128.7 5.34 0.63 1.38
9
169 61.22 8.27 134.4 5.61 0.63 1.38
10
183 64.54 9.98 140.5 5.98 0.82 1.81
11
192 66.34 10.29 145.5 6.15 0.82 1.81
12
195 69.15 10.92 151.2 6.73 0.75 1.67
13
197 71.48 10.76 157.8 8.14 0.60 1.34
14
197 74.67 11.70 166.1 7.92 0.47 1.06
15
188 76.91 12.31 171.6 7.37 0.50 1.12
16
186 77.93 11.41 175.5 6.93 0.41 0.93
17
190 80.35 11.41 177.9 6.56 0.16 0.35
18
176 81.04 10.61 178.9 6.86 0.17 0.36
20 - 29
265 87.43 12.99 180.1 7.10 0.24 0.50
30 - 39
235 95.36 13.47 180.0 7.46 0.36 0.68
40 - 49
230 98.72 11.73 179.6 7.24 0.20 0.36
50 - 59
181 103.8 12.27 179.1 7.30 0.22 0.38
60 - 69
100 109.0 12.92 177.6 7.17 0.05 0.08
70+
61 107.6 11.34 174.3 6.13 0.34 0.55
Table 2. Female summary data. Sample sizes (N), mean waist circumference (WC) and standard deviation (SD), mean height and standard deviation, regression slope (β) between weight and centered height, and age-specific optimal power for girls aged 2 to 18 years and adult women in ten-year intervals between ages 20 to 70+.
HeightWC
Age MeanN SD Mean SD β Power
2
68 48.59 2.96 87.86 3.60 0.38 0.68
3
146 49.50 2.74 94.31 3.87 0.43 0.82
4
165 51.34 3.36 101.4 4.34 0.46 0.91
5
155 52.62 3.84 107.7 4.77 0.46 0.95
6
170 54.66 4.85 115.3 5.75 0.56 1.19
7
165 56.84 5.63 121.5 5.57 0.58 1.24
8
173 59.23 6.30 128.2 5.93 0.61 1.32
9
166 62.34 7.49 134.1 6.26 0.56 1.20
10
169 64.93 8.55 140.3 6.96 0.73 1.59
11
172 66.91 8.40 146.6 7.26 0.56 1.23
12
172 70.10 9.00 153.4 7.23 0.55 1.20
13
179 72.35 8.48 158.7 6.85 0.49 1.08
14
183 74.06 8.68 161.4 6.85 0.33 0.72
15
160 76.01 8.76 163.9 6.65 0.16 0.35
16
170 76.97 9.08 164.3 6.56 0.16 0.34
17
167 78.24 9.61 164.7 6.45 0.17 0.35
18
179 78.97 9.98 165.5 6.60 0.07 0.15
20 - 29
260 82.46 11.28 165.4 6.46 0.19 0.38
30 - 39
268 87.75 13.20 166.3 6.11 0.27 0.51
40 - 49
265 91.08 15.03 165.9 5.79 0.22 0.40
50 - 59
185 93.30 12.93 164.6 6.09 0.27 0.48
60 - 69
120 95.14 11.68 163.9 6.13 0.18 0.32
70+
[image:3.595.99.496.460.738.2]not all subjects provided both WC and height measure- ments for all ages, resulting in lower age-specific sample sizes than the total number of subjects reported in the Methods Section.
[image:4.595.134.469.470.700.2]Using the equation to calculate the optimal power for indexing WC by height given in the Methods Section, we see that the estimated powers (resulting from the corre-sponding regression coefficients (β) between height and WC) increase and decrease in a similar fashion as the estimated slopes. For boys (Table 1), the estimated power is 0.52 at age 2, increasing until it reaches a max- imum of 1.81 at ages 10 and 11, then decreasing until it reaches 0.35 at age 17. The optimal powers then range between 0.36 and 0.68 between ages 20 and 60. These values imply that roots of height are optimal for indexing WC from ages 2 through 5, powers greater than 1 (but less than 2) are optimal between ages 6 and 15, and roots are again optimal from ages 16 to 18 and then on into adulthood. A similar pattern is observed in girls (Table 2), where the estimated power starts at 0.68 for age 2, increases until reaching a maximum of 1.59 at age 10, then decreases until reaching 0.15 at age 18. The optimal powers then range from 0.32 to 0.51 between ages 20 and 70+. These values imply that roots of height are op-timal for indexing WC from ages 2 through 5, powers greater than 1 (and less than 2) are optimal from ages 6 through 13, and roots of height are optimal from ages 14 through 18 and then on into adulthood.
Figure 1 contains age-specific plots of the WC-index means in boys and adult men for each of the four index-ing methods along with standard errors (though they are
too small to be noticed). Notable among the trends is the pronounced “rebound” in aWCI near age 11, which is not present in the other three indices (WHtR, WCI1 and WCI2). Note that the “rebound” observed around age 18 in WCI2 is due to the scale-shift from the annual child-hood measurements to the decade-long adultchild-hood inter-vals. A similar pattern is observed in girls in Figure 2, though the “rebound” in aWCI occurs slightly earlier in girls than in boys. In the plots for both male and female subjects, the aWCI, WHtR and WCI1 means are every-where larger than the WCI2 means, which is expected since indexing by height squared leads to a larger divisor than does the indexing for the other methods, where none of the exponents for height are as large as 2. For both boys and girls aged 2 through 9, the aWCI and WHtR means are close in value, whereas from 10 through 14, the aWCI means are less than the WHtR means (since the aWCI exponent is larger at these ages than the 1.0 used in WHtR), and after 16 and into adulthood, the aWCI means are greater than the WHtR means (since the aWCI exponents at these ages are smaller than 1.0). Likewise, the means for aWCI are smaller than the means for WCI1 from around age 5 to around age 15 due to the optimal exponents in aWCI being larger than the 0.5 used in WCI1.
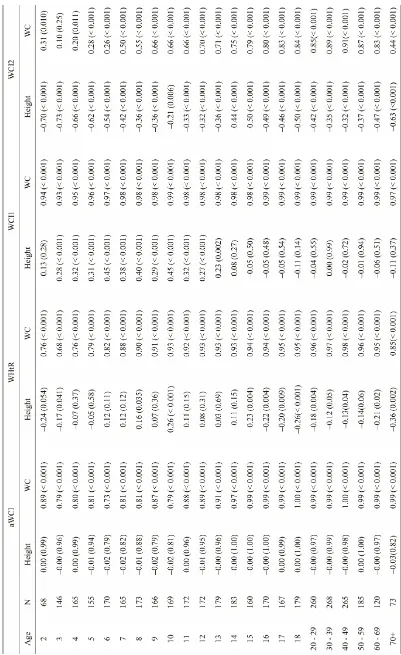
Based on Pearson correlations (Tables 3 and 4), we see that all four of the indices remain significantly (p < 0.001) and positively associated with the original WC measurement at all ages in both genders. Thus, each of these indices still capture—to some extent—the body- size measurement of the original WC. Generally speak-
Figure 2. Female waist circumference indices. Means for waist circumference indices adjusted by: age-specific powers of height (aWCI), height (WHtR), the square root of age (WCI1), and height-squared (WCI2), for female subjects over ages 2 through 18, then by decade until 70+.
ing, WCI1 (using root-height) is the most strongly asso-ciated index—of the four—with the original WC meas-urements in children and adults, with Pearson correla-tions everywhere between 0.93 and 0.99 for both males and females. WCI2 (using height-squared) is generally the least associated with the original WC measurements, with Pearson correlations ranging from 0.29 to 0.88 in males 0.10 to 0.91 in females. Both WHtR (waist-to- height ratio) and aWCI (the optimal index) are more strongly associated with the original WC measurements in latter adolescence and adult-hood than in childhood years.
Of the four indices, only aWCI was not associated with height at all ages and for both genders; this is ex-pected since it is an “optimal index”. WHtR is signifi-cantly and negatively associated with height in young children (ages 2 - 4 in boys; age 3 in girls), significantly and positively associated at some ages in adolescents (ages 10 - 12 in boys; age 10 in girls), and significantly and negatively associated with older teens and adults (ages 17 - 29, 40 - 69 in males; ages 15 - 49, 60+ in females). WCI1 is signifi-cantly and positively associated with height in young chil-dren and adolescents (ages 5 - 15 in booys; ages 3 - 13 in girls), yet is not associated with Height in adulthood for either gender. WCI2 is significantly and negatively associ-ated with height throughout lifetimes in both males (ages 2 - 9, 13 - 70+) and females (ages 2 - 70+). The estimated cor-relations for WCI2—when significant—are generally lar-ger than the estimated correlations for WHtR and WCI1.
4. Discussion
Just as body mass can be a misleading measure of the degree of obesity without indexing for height, waist cir- cumference should also be indexed by some function of height in order for the measure to increase its utility as a body-size biomarker. Our analyses found that the per-formances of the three commonly used indices were age specific. Notably, WHtR had suitable properties for young boys and girls (roughly ages 2 - 15), while WCI1 (using root-height) was suitable for teenage and adult males and females (roughly ages 16 - 70+). WCI2 (using height-squared) was nowhere suitable.
Tab
le 3.
Ma
le
As
so
ciation
s. Corre
lation
s b
et
w
een
age-s
p
ec
if
ic wa
is
t ci
rcu
m
feren
ce
in
d
ex (
aWCI
) an
d
b
o
th
h
eigh
t an
d
wais
t ci
rcu
m
fe
re
n
ce,
an
d
cor
rel
ation
s b
etween
tr
aditional wais
t c
irc
umfe
re
nc
e indic
es
ht r
a
is
ed
to the
1.
0 pow
er (WHtR),
rais
ed
to th
e 0
.5 p
o
wer (WCI
1) an
d
rais
ed
to
th
e 2.0
powe
r
(WCI2),
and bo
th he
ight an
d
waist c
irc
umfe
re
nc
e.
Cor
re
lations (with he
igand
p-valu
es
) lis
ted
for
each
ag
e
in
male
FLS
s
u
b
jects
[image:6.595.102.526.84.739.2]Tab
le 4. F
emal
e As
so
ciation
s. Correlat
ion
s b
etween
age-s
p
eci
fic
wais
t ci
rcu
mferen
ce
in
d
ex
(aWCI
) an
d
both
h
eigh
t an
d
wais
t circ
umfere
nc
e,
and c
o
rr
elations be
twe
en
traditional waist cir
cumfer
ence
indices, with
h
eigh
t rais
ed
to t
h
e 1.0 p
o
wer (
W
HtR), rais
ed
to th
e 0.5 p
o
we
r (WCI
1) an
d
rais
ed
to the
2.
0
powe
r (WCI2),
and bot
h
he
ight
an
d
wais
t circu
mferen
ce
. Corr
elation
s (an
d
p
-valu
es
) lis
ted
fo
r ea
ch
age
in
f
emale
FLS
s
u
b
jects
An important limitation of this study is that the Fels Longitudinal Study data base contains few non-white subjects; nearly all of the FLS subjects in this study are white. Thus, care should be used in interpreting the re-sults from this study, and any interpolations to races other than Caucasian should be avoided.
Confirmation of these results in other cohorts should be considered. Another step in this research will be to investigate the predictive power of WHtR and WCI1 with respect to other obesity and cardiovascular health outcomes. Many studies have compared WHtR with other obesity measures, like BMI and WC, and used re-ceiver-operating characteristic (ROC) curves on which to base the comparisons [7,9,10,14,18]. Fortunately, the FLS database contains many of the same obesity and cardiovascular health outcome measurements used in those studies, so that any new results can be compared with previous results.
5. Acknowledgements
The research which resulted in this manuscript was sup-ported by grants U01HL101064-02, R01HD060913-03, R01HD038356, DK 071485, HL 072838 and HD 12252 from the National Institutes of Health, Bethesda, Mary-land.
REFERENCES
[1] T. Khosla and C. Lowe, “Indices of Obesity Derived from Body Weight and Height,” British Journal of Preventive and Social Medicine, Vol. 21, No. 3, 1967, pp. 122-128. [2] S. Daniels, R. Meyer, Y. Liang and K. Bove, “Echocar-diographically Determined Left Ventricular Mass Index in Normal Children, Adolescents and Young Adults,” The Journal of the American College of Cardiology, Vol. 12, No. 3, 1988, pp. 703-708.
[3] R. Lang, M. Bierig, R. Deverux, F. Flachskampf, E. Fos-ter and P. Pellikka, “Recommendations for Chamber Quantificaiton: A Report from the American Society of Echocardioagraphy’s Guidelines and Standard Committee and the Chamber Quantification Writing Group, Devel-oped in Conjunction with the European Association of Echocardiography, a Branch of the European Society of Cardiology,” Journal of the American Society of Echo-cardiography, Vol. 18, No. 12, 2005, pp. 1440-1463. doi:10.1016/j.echo.2005.10.005
[4] R. Lauer, T. Burns, W. Clarke and L. Mahoney, “Child- hood Predictors of Future Blood Pressure,” Hypertension, Vol. 18, No. 3, 1991, pp. 174-181.
doi:10.1161/01.HYP.18.3_Suppl.I74
[5] R. Gillum, “The Association of Body Fat Distribution with Hypertension, Hypertensive Heart Disease, Coro-nary Heart Disease, Diabetes and Cardiovascular Risk Factors in Men and Women Aged 18 - 79 Years,” Journal of Chronic Diseases, Vol. 40, No. 5, 1987, pp. 421-428. doi:10.1016/0021-9681(87)90175-5
[6] W. Yan, H. Bingxian, Y. Hua, D. Jianghong, C. Jun, G. Dongliang, Z. Yugian, L. Ling, G. Yanying, X. Kaiti, F. Xiaohai and M. Da, “Waist-to-Height Ratio Is an Accu-rate and Easier Index for Evaluating Obesity in Children and Adolescents,” Obesity, Vol. 15, No. 3, 2007, pp. 748- 752. doi:10.1038/oby.2007.601
[7] S.-Y. Ho, T.-H. Lam, E. Janus and H. K. C. R. F. P. S. S. Committee, “Waist to Stature Ratio Is More Strongly Associated with Cardiovascular Risk Factors than Other Simple Anthropometric Indices,” Annals of Epidemiology, Vol. 13, No. 10, 2003, pp. 683-691.
doi:10.1016/S1047-2797(03)00067-X
[8] H. Schneider, N. Friedrich, J. Klotsche, L. Pieper, M. Nauck, U. John, M. Dorr, S. Felix, H. Lehnert, D. Pittrow, S. Silber, H. Volzke, G. Stalla, H. Wallaschofski and H. Wittchen, “The Predictive Value of Different Measures of Obesity for Incident Cardiovascular Events and Mortal- ity,” Journal of Clinical Endocrinology and Metabolism, Vol. 95, No. 4, 2010, pp. 1777-1785.
doi:10.1210/jc.2009-1584
[9] C. Lee, R. Huxley, R. Wildman and M. Woodward, “In-dices of Abdominal Obesity Are Better Discriminators of Cardiovascular Risk Factors than BMI: A Meta-Analy- sis,” Journal of Clinical Epidemiology, Vol. 61, No. 7, 2008, pp. 646-653. doi:10.1016/j.jclinepi.2007.08.012 [10] K. Knowles, L. Paiva, S. Sanchez, L. Revilla, T. Lopez,
M. Yasuda, N. Yanez, B. Gelaye and M. Williams, “Waist Circumference, Body Mass Index, and Other Measures of Adiposity in Predicting Cardiovascular Disease Risk Factors among Peruvian Adults,” International Journal of Hypertension, Vol. 2011, Article ID 931402, 10 pages. [11] A. Bosy-Westphal, C. Geisler, S. Onur, O. Korth, O.
Sel-berg, J. Schrezenmeir and M. Muller, “Value of Boy Fat Mass vs Anthropometric Obesity Indices in the Assess-ment of Metabolic Risk Factors,” International Journal of Obesity, Vol. 30, 2005, pp. 475-483.
doi:10.1038/sj.ijo.0803144
[12] F. Hadaegh, A. Zabetian, H. Harati and F. Azizi, “Waist/ Height Ratio as a Better Predictor of Type 2 Diabetes Compared to Body Mass Index in Tehranian Adult Men: A 3.6-Year Prospective Study,” Experimental and Clini- cal Endocrinology & Diabetes, Vol. 114, No. 6, 2006, pp. 310-315. doi:10.1055/s-2006-924123
[13] C. Maffeis, C. Banzato, G. Talamini and G. Talamini, “Waist-to-Height Ratio, a Useful Index to Indentify High Metabolic Risk in Overweight Children,” The Journal of Pediatrics, Vol. 152, No. 2, 2008, pp. 207-213.
doi:10.1016/j.jpeds.2007.09.021
[14] L. Paniagua, V. Lohsoonthorn, S. Lertmaharit, W. Jiam-jarasrangsi and M. Williams, “Comparison of Waist Cir-cumference, Body Mass Index, Percent Body Fat and Other Measure of Adiposity in Identifying Cardiovascular Disease Risks among Thai Adults,” Obesity Research & Clinical Practice, Vol. 2, No. 3, 2008, pp. 215-223. doi:10.1016/j.orcp.2008.05.003
Clinical Nutrition, Vol. 72, 2000, pp. 490-495.
[16] A. Roche, “Growth, Maturation and Body Composition: The Fels Longitudinal Study 1929-1991,” Cambridge University Press, Cambridge, 1992.
doi:10.1017/CBO9780511661655
[17] G. Lohman, A. Roche and R. Martorell, “Anthropometric Standardization Reference Manual,” Human Kinetics,
Champaign, 1988.