Copyright (2018) Acoustical Society of America. This article may be downloaded for personal use only. Any other use requires prior permission of the author and the Acoustical Society of America. The following article appeared in:
Carcagno, S., Micheyl, C., Cousineau, M., Pressnitzer, D., & Demany, L. (2018). Effect of stimulus type and pitch salience on pitch-sequence processing. The Journal of the Acoustical Society of America, 143 (6), 3665–3675. https://doi.org/10.1121/1.5043405
and may be found at https://asa.scitation.org/doi/10.1121/1.5043405
Effect of stimulus type and pitch salience on pitch-sequence processing
Samuele Carcagno a)
Department of Psychology, Lancaster University, Lancaster, LA1 4YF, UK
Christophe Micheyl
Starkey Hearing Research Center, 2150 Shattuck Avenue, Suite 408, Berkeley, CA 94704, USA
Marion Cousineau
International Laboratory for Brain, Music and Sound Research (BRAMS) and Center for Research on Brain, Language and Music (CRBLM),
Department of Psychology, University of Montreal, Montreal, QC, Canada H3C 3J7
Daniel Pressnitzer
Laboratoire des Systèmes Perceptifs, Département d'études cognitives, École Normale Supérieure, PSL Research University, Centre National de la Recherche Scientifique,
29 Rue d'Ulm, 75005 Paris, France
Laurent Demany
Institut de Neurosciences Cognitives et Intégratives d’Aquitaine, Université de Bordeaux and Centre National de la Recherche Scientifique, 146 rue Leo-Saignat, F-33076 Bordeaux, France 1
Running title: Pitch-sequence processing
a) Corresponding author; electronic mail: [email protected]
Abstract
Using a same-different discrimination task, it has been shown that discrimination performance for sequences of complex tones varying just detectably in pitch is less dependent on sequence length (1, 2, or 4 elements) when the tones contain resolved harmonics than when they do not [Cousineau et al. (2009). J. Acoust. Soc. Am. 126, 3179–3187]. This effect had been attributed to the activation of automatic frequency-shift detectors (FSDs) by the shifts in resolved harmonics. The present study provides evidence against this hypothesis by showing that the sequence-processing advantage found for complex tones with resolved harmonics is not found for pure tones or other sounds supposed to activate FSDs (narrow bands of noise and wide-band noises eliciting pitch sensations due to interaural phase shifts). The present results also indicate that for pitch sequences, processing performance is largely unrelated to pitch salience per se: for a fixed level of discriminability between sequence elements, sequences of elements with salient pitches are not necessarily better processed than sequences of elements with less salient pitches. An ideal-observer model for the same-different binary-sequence discrimination task is also developed in the present study. The model allows the computation of d’ for this task using numerical methods.
PACS numbers: 43.66.Mk, 43.66.Hg 23
I. INTRODUCTION
Given the sequential nature of speech and music, it can be reasonably hypothesized that, in the human auditory system, sequences of sounds are processed by special mechanisms, beyond those extracting information from single, steady sounds. Up to now, the physiological literature provides only limited evidence for the existence of hard-wired sequence-sensitive neurons or neural networks in mammals (see Yin et al., 2008, for a review). However, two sets of psychophysical studies have led to the suggestion that human listeners are endowed with
automatic "frequency-shift detectors" (FSDs) which are sensitive to the frequency relation of successive pure tones.
A first set of studies stemmed from a paradoxical observation made by Demany and Ramos (2005). These authors found that human listeners are able to perceive the direction of a frequency shift between two successive pure tones while one of those tones cannot be heard out individually because it is informationally masked by other pure tones presented at the same time. This provides strong evidence for the existence of FSDs. Follow-up experiments (Demany et al., 2009, 2010, 2011; Carcagno et al., 2011; Moore et al., 2013; see Demany and Semal, in press, for a review) revealed in particular that the perceptual effect described by Demany and Ramos (2005) is also obtained when the non-masked tone is replaced by a "dichotic-pitch" stimulus (i.e., wide-band noise evoking a pitch sensation through binaural processing), or by a narrow noise band (Carcagno et al., 2011). Overall, the data were accounted for by an FSD model assuming that the FSDs operate in the tonotopic domain, at or above the level of convergence of the monaural auditory pathways.
45
A second set of studies (Cousineau et al., 2009, 2010a, 2010b, 2014) has shown that sequences of complex tones varying in F0 (for brevity, sequences of sounds varying in frequency or F0 will be referred to as “pitch sequences”) are processed more easily than sequences of complex tones varying in intensity (which for brevity will be referred to as “loudness
sequences”), if at least some harmonics of the tones can be resolved by the auditory system. In these experiments, listeners made same-different judgments on pairs of sequences of variable length (N). Each element of a given pair of sequences could take only two possible values (A or B) along a given physical dimension, fundamental frequency (F0) or intensity. For each listener
and dimension, the difference between A and B was initially adjusted in order to obtain a fixed performance level (d' ≈ 2) when the sequences consisted of a single element (N = 1). When N was subsequently increased from 1 to 4, it was found that listeners' discrimination performance decreased less rapidly in the pitch-varying condition than in the loudness-varying condition, if and only if the tones contained resolved harmonics. The authors suggested that the source of this advantage for pitch sequences over loudness sequences was identical to the source of the
paradoxical effect reported by Demany and Ramos (2005); they hypothesized, in other words, that the FSDs uncovered by Demany and Ramos were at work in both cases.
One aim of the study reported here was to test the latter hypothesis. To this end, in Experiment 1, we measured sound-sequence discrimination performance using again the paradigm just described but with new stimuli. While Cousineau et al. (2009, 2010a, 2010b, 2014) only used complex tones, we also used here three other types of sounds eliciting pitch sensations: namely, "dichotic-pitch" stimuli, narrow noise bands, and pure tones. The set of studies initiated by Demany and Ramos (2005) suggested that these three types of sounds are 67
able to activate FSDs. We thus wanted to determine if pitch sequences based on such sounds are processed better than sequences of sounds that cannot activate FSDs.
The pitch of complex tones with resolved harmonics (hereafter referred to as resolved complexes) is much more salient than the pitch of complex tones with only unresolved harmonics (hereafter referred to as unresolved complexes), as shown by the fact that the latter tones lead to much poorer F0 discrimination thresholds (Hoekstra, 1979; Houtsma and
Smurzynski, 1990). The second aim of the present study was to test the hypothesis that sequence-processing performance for pitch sequences depends on pitch salience, independently of
resolvability. To this end, in Experiment 2, we used sequences of very short (10 ms) pure tones, with a low pitch salience reflected by a high frequency discrimination threshold, and sequences of longer (100 ms) pure tones, with a high pitch salience reflected by a low frequency
discrimination threshold.
In the previous studies of Cousineau et al. (2009, 2010a, 2010b, 2014), d’ was computed
by measuring the discriminability of different sequences rather than the discriminability of the A and B elements composing the sequences. When N = 1, the two measures are the same. However, for sequences with N > 1 these two measures will be different1. Currently, to the best of our
knowledge, there are no formulas to compute d’ as the discriminability of the A and B elements in the task of Cousineau et al. (2009, 2010a, 2010b, 2014) when N > 1. In Section II we outline an ideal observer model of this task and describe Monte Carlo simulations that allow the calculation of d’ as the standardized difference between the means of the sensory observations elicited by the A and B elements of the sequences. This measure was used to assess the
performance of listeners in the two experiments outlined above, and described in detail in
89
Sections III and IV of this paper. The results of two previous experiments of Cousineau et al. (2009) were also re-assessed using this measure to check the validity of the key conclusions previously drawn from them.
II. Ideal-Observer Simulations
Traditionally, d’ is defined as the standardized difference between the means of the sensory observations elicited by the elements composing a sequence. For example, in the ABX task there are four possible stimulus sequences, <S1 S2 S1>, <S2 S1 S2>, <S1 S2 S2>, <S2 S1 S1>. Signal-detection theory (SDT) analyses of the ABX task seek to find the standardized
difference between the means of the “sensory observations” elicited by the S1 and S2 elements rather than the difference between the sensory observations elicited by the whole sequences (e.g. Macmillan et al., 1977). Besides conforming to the traditional SDT definition of d’, measuring the discriminability of the A and B elements composing the sequences in the same-different tasks of Cousineau et al. (2009, 2010a, 2010b, 2014) has other practical advantages. For example, the discriminability of the sequences is expected to decrease as N increases even for an ideal
observer. The reason for this is that when N > 1 the observer does not know which of the elements composing the sequence (if any) may change. This uncertainty, which increases as N increases, has a cost for the observer. However, for an ideal observer without specific sequence-processing capabilities (i.e. assuming independence of the observations within each sequence), the discriminability of the A and B elements composing the sequence will not change as a function of N. If human observers behave like ideal observers, the slope of the line relating d’ to N should be zero. Measuring the discriminability of the A and B elements of the sequence thus 111
provides a direct way of comparing changes in performance as a function of N between human observers and the ideal observer.
In a same-different task with sequences consisting of a single element (N = 1), the ideal observer computes the likelihood that the sensory observations Ψ1, and Ψ2were elicited by a “same” stimulus sequence (<AA> or <BB>), and the likelihood that they were elicited by a “different” stimulus sequence (<AB> or <BA>). The observer then responds “same” if the ratio of these two likelihoods exceeds a certain criterion threshold β (Noreen, 1981). When the prior probabilities of each possible stimulus sequence are equal, an unbiased observer would set β=1. This strategy can be extended to sequences containing more than one element. For example, when N = 2, the ideal observer will compute the likelihood that the four sensory observations obtained in a given trial, Ψ1, Ψ2, Ψ3, and Ψ4, were elicited by a “same” stimulus sequence (<AAAA>, <BBBB>, <ABAB>, or <BABA>), and the likelihood that they were elicited by a “different” stimulus sequence (<AAAB>, <AABA>, <BBAB>, <BBBA>, <ABBB>, <ABAA>, <BAAA>, <BABB>); the response will be “same” if the ratio of these likelihoods exceeds a certain criterion threshold β. Assuming that the sensory observations in a trial are independent and follow Gaussian distributions with equal variance, it is possible to obtain equations for the probability of hits and false alarms for an ideal observer with a given d’ and β. However, when N > 1, finding an analytical formula for d’ from the observed proportion of hits and false alarms
is not trivial. Instead, we used Monte Carlo simulations to tabulate the proportions of hits and false alarms obtained in 1,000,000 trials by an ideal observer for d’ values ranging from 0 to 5 in 0.005 steps and log β values ranging from the lowest to the highest likelihood ratio obtained in a given simulation with 0.01 steps. These tables could then be searched to find the approximate
133
values of d’ and β for an observer with a given proportion of hits and false alarms. Specifically, we performed the search by looking up the row that minimized the sum of the squared distances between the observed hit and false alarm rates and the hit and false alarm rates in each row of the table. The ideal observer simulations were implemented in Julia v0.6 (Bezanson et al., 2017) and the simulation code, as well as the d’ tables are available as supplementary material2.
Dai et al. (1996) provided analytical formulas for computing the proportion of hits and false alarms for an ideal observer with a given d’ and β in the same-different task with N = 1. For each entry in the tables generated by our ideal observer simulations for N = 1 the proportions of hits and false alarms in the table entry were compared to those calculated with the formulas of Dai et al. (1996) using the d’ and β values of the table entry. The maximum absolute difference between the proportion of hits and false alarms in the table and those calculated using Dai et al.’s formula was 0.003. This confirms the validity of our ideal-observer simulations for N = 1.
To check the internal consistency of our simulations, as well as the accuracy of the table lookup method used to find d’ from hit and false alarm rates, 100,000 hit rate values were randomly drawn from a uniform distribution between zero and one; for each hit rate value a corresponding false alarm rate value was randomly drawn with the constraint that it could not be larger than the corresponding hit rate value (i.e. it was drawn from a uniform distribution
between zero and the corresponding hit rate value). The table lookup method was then used to find the d’ and β values for N = 1, 2, and 4 for each pair of hit and false alarm rates. These d’ and β values were then used to compute the proportions of hits and false alarms from the ideal
observer simulations for each N. If our method is internally consistent, the discrepancy between the original randomly drawn proportions of hit and false alarm rates and the proportions of hits 155
and false alarm rates calculated from the simulations should be small. Because of the large computing time necessary for the ideal-observer simulations we used only 100,000 trials for these checks rather than 1,000,000 trials as in the simulations used to generate the d’ tables. This reduction in the number of trials used in the ideal-observer simulations for the consistency checks can only lead to an underestimation of the internal consistency of our method. The maximum absolute difference between the original randomly drawn proportions of hits and false alarms rates and the proportions of hits and false alarm rates calculated from the simulations was 0.023 for all values of N. This indicates that our ideal-observer simulations as well as our table lookup method to compute d’ are internally consistent within a small margin of error which is to be expected in the context of Monte Carlo sampling.
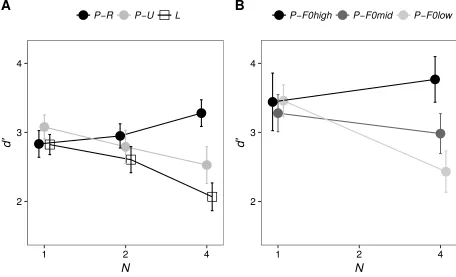
Cousineau et al. (2009) simulated the performance of a virtual observer in the same-different binary-melody task. In their simulations, the virtual observer would categorize each element of the sequence as A or B, then compare the outcome of such a categorization process across the two sequences in a trial, and respond “same” if the categorizations for all the elements matched across the two sequences. While this is a plausible strategy for an observer in the task, it is not the optimal strategy. The key difference between the ideal observer and the virtual observer simulated by Cousineau et al. (2009) is that the ideal observer does not make binary decisions based on each element of the sequence. Instead, the ideal observer combines the evidence across all the elements of the sequences, and then makes a decision based on the likelihood ratio. The two models are equivalent only when N = 1.
Cousineau et al. (2009) found that the slope relating d’ to N in the “pitch” condition with resolved complexes was less negative for their listeners of Experiment 1 than for their virtual
177
observer; in other words, the performance of listeners degraded less rapidly as a function of N than the performance of their virtual observer. In the “pitch” condition with unresolved
complexes and in the “loudness” condition, the slopes for real listeners were more negative than for the virtual observer; in other words, the performance of listeners degraded more rapidly as a function of N than the performance of the virtual observer. When the data of Cousineau et al. (2009) were reanalyzed with the new d’ measure obtained from our ideal-observer simulations, these relationships still held. The data of Experiment 1 of Cousineau et al. (2009) are plotted using the new d’ measure in Figure 1(A). The analyses with this d’ measure showed that the slope relating d’ to N in the “pitch” condition with resolved complexes was significantly greater than zero [t(12) = 2.21, p = 0.047], while the slope relating d’ to N in the “pitch” condition with unresolved complexes [t(12) = -2.55, p = 0.025] and in the “loudness” condition [t(12) = -3.55, p = 0.004] was significantly smaller than zero. As mentioned above, the slope of the line relating d’ to N for the ideal observer is always equal to zero. Therefore, as N increases, real listeners
perform better than the ideal observer for pitch sequences with resolved complexes, but worse than the ideal observer for pitch sequences with unresolved complexes or loudness sequences.
Other key findings from Cousineau et al. (2009) were confirmed when their data were reanalyzed with the d’ measure obtained from our ideal-observer simulations. In particular, for their Experiment 1, the d’ slope for pitch sequences with resolved complexes was significantly more positive than for pitch sequences with unresolved complexes [t(12) = 3.44, p = 0.005] and for “loudness” sequences [t(12) = 3.78, p = 0.003], while the d’ slope did not differ significantly between pitch sequences consisting of unresolved complexes and loudness sequences [t(12) = 0.68, p = 0.51].
In Experiment 1 of Cousineau et al. (2009), resolvability was manipulated by varying the frequency region for a fixed F0. Experiment 2 of Cousineau et al. (2009) used instead pitch sequences composed of complexes bandpass filtered within a fixed frequency region with different F0s. The data of Experiment 2 of Cousineau et al. (2009) are plotted using the d’ measure obtained from our ideal-observer simulations in Figure 1(B). A significant interaction between N and F0 was again found [F(2,8) = 11.71, p = 0.004]. Post-hoc Fisher’s LSD tests
2
3 4
1 2 4
N
d'
P−R P−U L
A
2 3 4
1 2 4
N
d'
[image:13.612.73.529.77.354.2]P−F0high P−F0mid P−F0low
B
FIG. 1. Data from Cousineau et al. (2009) plotted using the d’ measure derived in the current study. (A) Mean value of d' as a function of stimulus type and N in Experiment 1 (conditions: P-R, “pitch resolved”; P-U, “pitch unresolved”; L, “loudness”). (B) Mean value of d' as a function
of stimulus type and N in Experiment 2 (conditions: P-F0high, “pitch resolved”; P-F0mid, “pitch intermediate resolvability”; P-F0low, “pitch unresolved”). Error bars denote ± 1 standard error of the mean.
confirmed that while for N = 1 performance did not differ significantly between the resolvability conditions [p > 0.5 for each comparison], for N = 4 performance was significantly better for the high-F0 (fully resolved) condition than for the low-F0 (fully unresolved) condition [p < 0.001]. Performance for the mid-F0 (intermediate resolvability) condition with N = 4 was intermediate, being significantly worse than for the high-F0 condition [p = 0.004], but significantly better than for the low-F0 condition [p = 0.024]. Overall, the results of these reanalyses of the data of Cousineau et al. (2009) indicate that their key findings hold when the measure of
discriminability based on the ideal observer developed in the current study is used.
III. EXPERIMENT 1
A. Method
Eleven listeners (6 males), including author SC, took part in Experiment 1. The listeners ranged in age between 19 and 29 years (mean = 23), and had absolute pure-tone thresholds below 20 dB HL for both ears at octave frequencies from 250 to 8,000 Hz. All listeners, except author SC, were paid an hourly wage.
On each trial, listeners were presented with two successive sound sequences. Both sequences contained only two possible elements, A and B. Several types of A-B pairs were used, in different experimental conditions (described in the next paragraphs). In a given condition, the first sequence was constructed by choosing at random, for each element, either A or B. The second sequence could be, equiprobably, either identical to the first sequence or different from it with respect to a single element, chosen at random; in the latter case, A was replaced by B or vice 227
versa. Listeners had to indicate whether the two sequences were the same or different; visual
feedback was provided following each response. The number of elements (N) in each sequence was either 1, 2, or 4. Each element had a duration of 300 ms, including 25-ms onset and offset raised-cosine ramps. As in previous studies of the same-different binary-sequence task
(Cousineau et al., 2009, 2010a, 2010b, 2014), there was no silent interval between the elements of a sequence. The two sequences presented in a trial were separated by a 400-ms silence. The A and B sounds evoked pitches corresponding to frequencies of 150 and 150+ΔF Hz, respectively. ΔF was chosen separately for each listener and stimulus type, so that with sequences consisting
of a single element (N = 1) d' would be similar for all stimulus types. The selection of the individual ΔF values occurred during a preliminary phase of the experiment that lasted for several sessions and served also to familiarize the listeners with the task. The ΔF values tested during this phase, its length, and the final ΔF selection for each listener were determined heuristically by the experimenter; the experimenter adjusted the ΔF values until d’ in each condition was close to 2.5 and appeared to be relatively stable3.
There were four stimulus types: Res, Unres, Noise-Dicho and Noise-Mono. Res and Unres stimuli were harmonic complexes with an F0 of 150 Hz (for the A stimuli) or 150+ΔF Hz
(for the B stimuli). Res complexes were low-pass filtered at 1.2 kHz while Unres complexes were band-pass filtered between 3.3 and 4.5 kHz. Therefore, Res complexes contained mainly resolved harmonics while Unres complexes contained only unresolved harmonics. The level of each harmonic of the A complexes was set at 50 dB SPL. The level of each harmonic of the B complexes was set at 50 + 10log10[(150+ΔF) /150] dB SPL, so that the overall level of the A and B complexes within the filter passband was the same. A pink noise built by summing
249
phase sinusoids from 40 to 5000 Hz in 10-cent steps was added to the complexes. The overall level of the noise was 53 dB SPL (its spectrum level at 1 kHz was 16.2 dB SPL), so that the overall level of the Res and Unres stimuli (consisting of the complex tones with the added noise) was 60 dB SPL.
The Noise-Dicho stimuli evoked pitch sensations based on binaural processing (Bilsen, 1977). They were built by first summing random-phase sinusoids from 40 to 5000 Hz in 10-cent steps, in order to obtain a pink noise with an overall level of 60 dB SPL. An interaural phase shift of π radians was then applied to narrow frequency regions with a 100-cent bandwidth centered on the first 8 harmonics of 150 Hz (for the A stimuli) or 150+ΔF Hz (for the B stimuli).
In order to produce the Noise-Mono stimuli, a 60-dB SPL pink noise was generated by summing random-phase sinusoids from 40 to 5000 Hz in 10-cent steps. Spectral "humps" were then added to this noise, by a 5-dB increment in the level of the 100-cent frequency bands centered on the first 8 harmonics of 150 Hz (for the A stimuli) or 150+ΔF Hz (for the B stimuli). These 5-dB increments gave rise to a faint pitch which was similar in quality to the pitch evoked by the Noise-Dicho stimuli, while requiring only monaural processing to be audible. The value of 5 dB for the increments was chosen to equate the salience of the pitch evoked by the Noise-Mono and Noise-Dicho stimuli. The choice was based on the results of a preliminary
pitch-salience matching experiment performed by three listeners. This pitch-pitch-salience matching experiment followed the forced-choice adaptive procedure described by Jesteadt (1980).
There were in total 12 conditions given by the combination of the four stimulus types (Res, Unres, Noise-Dicho and Noise-Mono) and the three possible lengths of the sequences (N = 1, 2, or 4). Listeners completed a total of 300 trials per condition, in six sessions lasting about 45 271
minutes each. During each session they performed a block of 50 trials for each condition. The
order of the conditions within a session was random.
B. Results
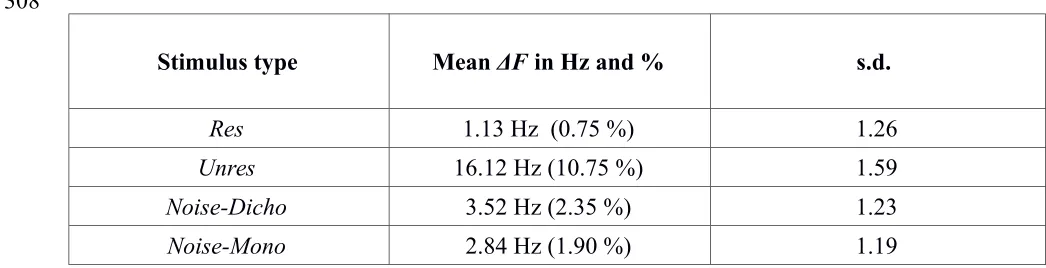
Table I displays the average ΔF values used in the experiment, following the preliminary phase intended to select ΔF values equalizing performance for N =1. As expected from the literature on F0 discrimination (e.g., Plack and Oxenham, 2005), in order to achieve a similar
[image:17.612.38.561.493.627.2]level of performance listeners needed on average a much larger ΔF for the Unres stimuli than for the Res stimuli. For the Noise-Mono and Noise-Dicho stimuli, intermediate ΔF values were selected. It was found that ΔF had to be similar in these two conditions; this confirmed that the 5-dB humps of the Noise-Mono spectra produced a pitch that was well matched in salience to the pitch of the Noise-Dicho stimuli.
TABLE I. Geometric means and geometric standard deviations (s.d.) of the ΔF values used in Experiment 1. The second column shows the frequency changes expressed in Hz and as
percentages (relative to the "A" stimulus).
Stimulus type Mean ΔF in Hz and % s.d.
Res 1.13 Hz (0.75 %) 1.26
Unres 16.12 Hz (10.75 %) 1.59
Noise-Dicho 3.52 Hz (2.35 %) 1.23
Noise-Mono 2.84 Hz (1.90 %) 1.19
293 294 295 296 297 298 299 300 301 302 303 304 305 306 307 308
1 2 4 1 2 4 1 2 4
1 2 4
1 2 3
1 2 3
1 2 3
N
d'
1 2 4
2.0 2.4 2.8 3.2
d'
[image:18.612.82.476.76.517.2]Res Unres Noise−Dicho Noise−Mono
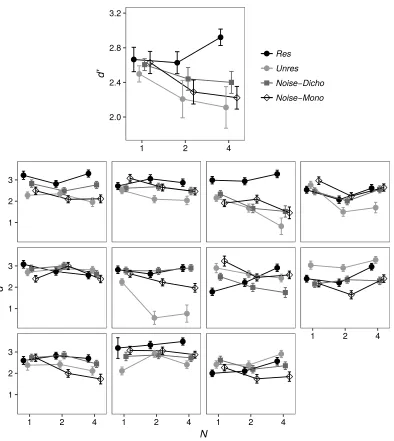
Figure 2 shows the d' values obtained for each stimulus type as a function of N by each listener, as well as the average d' values across listeners. For N = 1, the data points for the averages across listeners are close to each other, indicating that, on average, the choice of ΔF values in the preliminary phase had been successful, although for some listeners the match at N = 1 was not very good. For most listeners performance with the Res stimulus tended to increase or to remain constant as N increased. For the other stimuli the performance change as a function of N was quite variable across listeners, but on average performance tended to decrease as N
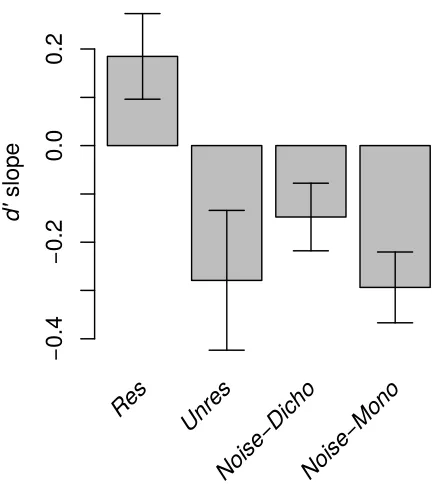
increased. A repeated-measures analysis of variance (ANOVA) showed no significant effect of stimulus type on d' for N = 1 [F(3, 30) = 0.38, p = 0.765]. However, across all the values of N, another repeated-measures ANOVA revealed a significant interaction between N and stimulus type [F(6, 60) = 3.74, p = 0.003]. This reflects the fact that as N increased, performance tended to worsen for the Unres, Noise-Dicho and Noise-Mono stimuli and to improve for the Res stimuli. The change in performance as a function of N was quantified by measuring the slope of least-square lines fitted to the individual listeners' data, using a log scale for N. The average d' slope
obtained for each stimulus type is displayed in Figure 3. Planned paired t-tests (two-tailed)
showed that the d' slopes generated by the Res stimuli were significantly more positive than
those generated by any other stimulus type [Unres: t(10) = 2.88, p = 0.016; Noise-Dicho: t(10) =
2.53, p = 0.03; Noise-Mono: t(10) = 3.92, p = 0.003]. The Noise-Dicho and the Noise-Mono
slopes were not significantly different from each other [p = 0.107] or from the Unres slope [p >
0.4 in each case].
311
C. Discussion
The results of this experiment confirm previous evidence (Cousineau et al., 2009, 2010a, 201b) that sequences of tones varying in pitch are processed more easily when the tones contain resolved harmonics than when they contain only unresolved harmonics. For the other stimuli used here, which were derived from noise, pitch sequences appeared to be processed similarly to unresolved harmonics: processing performance was worse than for resolved harmonics. At first sight, the latter result does not seem consistent with the hypothesis that the sequence-processing advantage found for resolved harmonics originates from the FSDs identified by Demany and
−0
.4
−0
.2
0.
0
0.
2
Res Unres
Noise −Dich
o
Noise −Mon
o
d'
sl
op
[image:20.612.189.405.74.316.2]e
FIG. 3. Mean value of the d' slope summarizing the change in performance from N = 1 to N = 4 for the three stimulus types of Experiment 1. Error bars denote ± 1 standard error of the mean. 331
Ramos (2005): previous results indicate that the FSDs should be activated by narrowband noises similar to those used here, as well as by dichotic-pitch stimuli (Carcagno et al., 2011). However, according to Moore et al. (2013), the strength of activation of the FSDs may depend on pitch salience. If so, it could be argued that in the current experiment the Dicho and Noise-Mono stimuli activated the FSDs, but only weakly and not sufficiently to elicit a strong
sequence-processing benefit. Another important fact to consider is that in the study of Carcagno et al. (2011), listeners had to judge the direction of a frequency shift between a component of a
chord formed by pure tones and a dichotic-pitch stimulus or a narrow noise band. In contrast, in the present experiment, the frequency shifts occurred between consecutive dichotic-pitch stimuli or consecutive narrow noise bands. This could have further reduced the activation of FSDs.
An additional factor to consider is that the different ΔF values used to equate the discriminability of the sequence elements across stimulus types may have led to differential activation of the FSDs. Demany et al. (2009) found that the FSDs respond maximally to frequency shifts of about 0.1 octave (i.e., 7 %) between a chord formed by pure tones and a single pure tone. The FSD tuning function for stimuli other than these is not known. If the FSD tuning function for dichotic-pitch stimuli and narrow noise bands is the same as for pure tones, then the ΔF values for the Noise-Dicho and Noise-Mono stimuli were closer to the optimal FSD shift than the ΔF value used for the Res stimuli (see Table I). If the FSD tuning function differs across stimulus types, a plausible assumption is that the tuning function is proportional to the F0
difference limen for a given stimulus type. Therefore, while we cannot completely rule out the
possibility that the shifts for Res stimuli were better matched to the FSD tuning function than the
shifts to Noise-Dicho and Noise-Mono stimuli, this hypothesis seems highly unlikely.
340
Overall, the results of Experiment 1 do not support, but do not clearly rule out, the hypothesis that pitch sequences based on resolved harmonics are processed proficiently owing to activation of FSDs.
IV. EXPERIMENT 2
A. Rationale
In Experiment 1, as well as in the previous studies using the same paradigm, pitch-sequence processing was better with stimuli evoking a salient pitch (complex tones containing resolved harmonics) than with stimuli evoking a less salient pitch (unresolved complex tones, dichotic-pitch stimuli, narrow noise bands). It may thus be that performance in the sequence-processing task was related to pitch salience, even though the elements of the sequences had a constant level of discriminability. Some evidence against this hypothesis comes from the observation that, in Experiment 1, pitch salience was higher for the Dicho and Noise-Mono stimuli than for the Unres stimuli (ΔF had to be higher for the Unres stimuli), and yet the
d' slopes for these three types of stimuli were relatively similar. However, the function relating
the d' slope to pitch salience might show a plateau, which could account for the latter finding. Experiment 2 provided a further test of the pitch-salience hypothesis by comparing performance in the sequence-processing task between "long" (100-ms) pure tones, with a high pitch salience, and very short (10-ms) pure tones, with a low pitch salience. In a third experimental condition, we used unresolved complex tones, for which sequence-processing performance was expected to be poor on the basis of the results of Experiment 1 as well as the studies of Cousineau et al. 362
(2009, 2010a, 2010b).
Pure tones were chosen as stimuli in Experiment 2 for two reasons: 1) their salience could be easily manipulated by changing their duration, in order to test the pitch-salience hypothesis; 2) because pure tones are expected to strongly activate FSDs, they provided a new test of the idea that pitch sequences based on resolved harmonics are processed proficiently via FSDs. According to the latter hypothesis, pitch-sequence processing performance should be higher when the sequence elements are pure tones than when they consist of unresolved harmonics.
B. Method
Seven listeners (4 males), including author SC, took part in Experiment 2. Three of these seven listeners had taken part in Experiment 1. The listeners ranged in age between 20 and 29 years (mean = 22), and had absolute pure-tone thresholds below 20 dB HL for both ears at octave frequencies from 250 to 8,000 Hz. All listeners, except author SC, were paid an hourly wage.
The general procedure was the same as in Experiment 1, but new stimuli were used. There were three stimulus types: PT-Long, PT-Short, and Unres. The PT-Long stimuli were 60-dB SPL pure tones with a duration of 100 ms, including 4-ms onset and offset raised-cosine ramps. The PT-Short stimuli were also pure tones, but their duration was 10 ms, including 4-ms onset and offset raised-cosine ramps. The PT-Short tones were presented at a level of 62.8 dB SPL to match their root-mean-square (RMS) amplitude after gating to the RMS amplitude of the PT-Long tones after gating. The Unres stimuli were identical to those used in Experiment 1,
except for having a shorter duration of 200 ms, including 4-ms onset and offset raised-cosine
384
ramps. The Unres stimuli again had an F0 of 150 Hz (for stimulus A) or 150+ΔF Hz (stimulus B). For the PT-Long and PT-Short tones, the frequency of stimulus A was 500 Hz. This frequency
was chosen because it fell approximately at the center of the dominance region for pitch (Plack and Oxenham, 2005) of the Res tones used in Experiment 1.
The durations of 100 and 10 ms for the long and short pure tones were chosen to maximize their difference in salience. For a 500-Hz pure tone, improvements in frequency discrimination as a function of duration start to asymptote around 100 ms (Moore, 1973). At a duration of 10 ms, the “short”, 500-Hz pure tone consisted of only five waveform cycles, and the effective number of cycles was further reduced by the presence of the onset and offset ramps. Frequency difference limens for 500-Hz pure tones close to this short duration are at least five times larger than for 100-ms pure tones (Moore, 1973). It is arguable whether a pure tone with only five waveform cycles can evoke a “musical” pitch. Patterson et al. (1983) measured the ability of listeners to identify which note of a four-note pure tone melody of the diatonic scale had changed by one step across two presentation intervals, for several pure tone frequencies and durations. If threshold is defined as 62.5% correct performance, the midpoint between chance and ceiling performance on this 4-alternative forced-choice task, their results indicate that about seven waveform cycles are necessary for melodic pitch perception. However, performance with just four waveform cycles was close to 50% correct, a value that while below threshold as defined before, was still well above the chance level. This suggests that some residual melodic pitch perception was present even with just four waveform cycles. Hsieh and Saberi (2007) found that musicians with absolute pitch could identify the pitch of a pure tone above the chance level with just four waveform cycles. Therefore, it is reasonable to assume that the short pure 406
tone used in our study could still evoke a “musical”, albeit weak, pitch.
Because stimuli with different durations had to be used in this experiment, it was not possible to keep both the within-sequence inter-stimulus interval (ISI) and the stimulus-onset asynchrony (SOA) constant across stimulus types. We chose to keep the SOA constant because varying it could have changed the memory load of the task as N increased. A side effect of this decision was that the sequences of short pure tones had to contain silent gaps. Although we had no reason to believe that the presence of these silent gaps could affect sequence processing performance as a function of N, a SOA of 300 ms was chosen, so that gaps would also be present in the sequences of long pure tones, and the SOA would be the same as in Experiment 1. As mentioned above, the Unres stimuli had a duration of 200 ms; thus, the sequences of Unres stimuli also contained gaps. For an envelope repetition rate of 150 Hz, F0 discrimination of 200-ms unresolved complex tones is close to asymptotic (White and Plack, 2003). The two
sequences presented on each trial were separated by a 300-ms silent interval. As in Experiment 1, the ΔF values between the A and B tones were chosen separately for each listener during a preliminary phase of the experiment, in order to obtain similar performance at N = 1 for all stimulus types.
There were in total nine conditions given by the combination of the three stimulus types and the three possible lengths of the sequences (N = 1, 2, or 4). Listeners completed a total of 400 trials per condition in four sessions lasting about one hour each. During each session, listeners completed first one block of 50 trials in each condition, in random order. Then they completed another block of 50 trials in each condition, again in random order.
428
C. Results
The average ΔF values used in the experiment, after the preliminary adjustment phase, are displayed in Table II. As expected from the literature (e.g., Moore, 1973), in order to achieve
similar levels of performance listeners needed, on average, a much larger ΔF in the PT-Short
condition than in the PT-Long condition. In percentage terms, however, ΔF had to be even larger in the Unres condition.
TABLE II. Geometric means and geometric standard deviations (s.d.) of the ΔF values used in Experiment 2. The second column shows the frequency changes expressed in Hz and as
percentages (relative to the "A" stimulus).
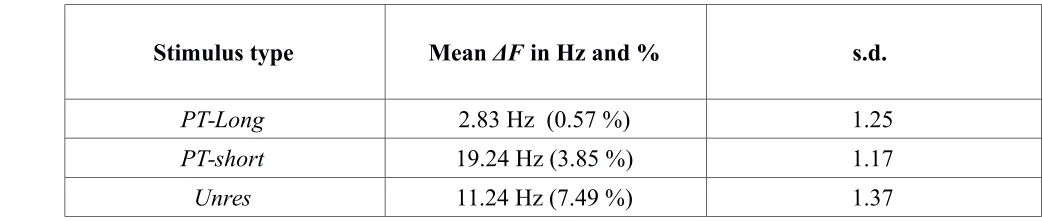
Stimulus type Mean ΔF in Hz and % s.d.
PT-Long 2.83 Hz (0.57 %) 1.25
PT-short 19.24 Hz (3.85 %) 1.17
[image:26.612.40.561.332.443.2]Unres 11.24 Hz (7.49 %) 1.37
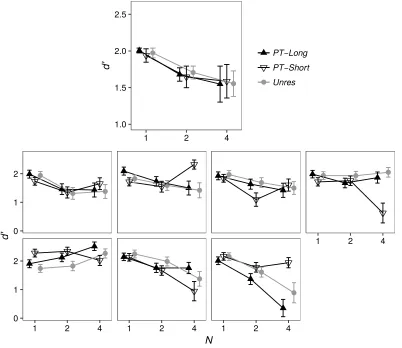
Figure 4 shows the d' values obtained for each stimulus type as a function of N by each listener, as well as the average d' values across listeners. For N = 1, the data points are close to each other for each listener, indicating that the preliminary adjustments of ΔF had been
successful. Although there was some degree of variability across listeners, with a few listeners
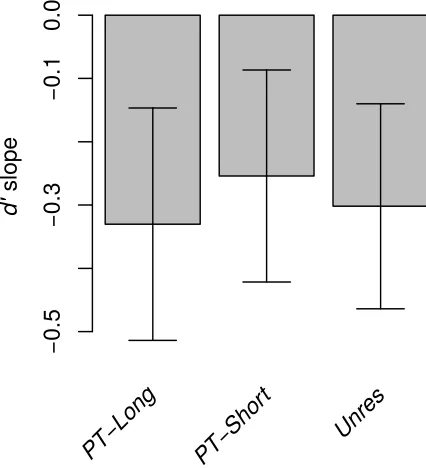
showing greater performance changes for one stimulus type over the others as N increased, on average performance decreased very similarly for all stimulus types as N increased. This is confirmed by Figure 5, which shows the d' slopes summarizing the performance change as a function of N. The slopes did not differ significantly between any of the stimulus types [p > 0.7].
450 451 452 453 454 455 456 457 458 459
It is noteworthy that the average slope for the Unres stimuli in this experiment was similar to the corresponding slope in Experiment 1 despite the slight methodological differences between the
1 2 4 1 2 4 1 2 4
1 2 4
0 1 2
0 1 2
N
d'
1 2 4
1.0 1.5 2.0 2.5
d'
[image:27.612.90.492.127.475.2]PT−Long PT−Short Unres
FIG. 4. Values of d' as a function of stimulus type and N in Experiment 2. The upper panel presents the mean data, and the lower panels present the data of the
individual listeners. Error bars denote ± 1 standard error of the mean. The standard errors for individual listeners’ data points were obtained using a bootstrap procedure by simulating 1,000 times the performance of a virtual observer with d’ and β values equal to those of the datapoint in 400 trials of the experiment in order to obtain the sampling distribution of the d’ value.
two experiments for these stimuli (shorter stimulus duration and presence of a silent gap between sequence elements in Experiment 2). Pitch-sequence processing was thus "poor" for all the stimulus types tested in Experiment 2. This was the case even in the PT-Long condition, where we expected to obtain results similar to those found in the Res condition of Experiment 1. A cross-experiment comparison revealed that the d' slopes for the Res stimuli were significantly more positive than the d' slopes for the PT-Long stimuli [t(10) = 2.82, p = 0.012, two-tailed test].
The results obtained in our PT-Long condition are seemingly at odds with results reported
−0
.5
−0
.3
−0
.1
0.
0
PT−L ong
PT−S
hort Unres
d'
sl
op
[image:28.612.196.409.249.483.2]e
FIG. 5. Mean value of the d' slope
summarizing the change in performance from
N = 1 to N = 4 for the three stimulus types of
Experiment 2. Error bars denote ± 1 standard
error of the mean. 472
473 474 475 476 477
using binary sequences of 200-ms pure tones differing in either frequency, intensity, or duration. Efficiency was found to be markedly greater when the tones differed in frequency than when they differed in intensity or duration. However, the relative frequency differences used by McFarland and Cacace were at least three times larger than those used in the PT-Long condition of the present study, and their listeners had to memorize long sequences. As pointed out by Cousineau et al. (2009), it can be suspected that performance in the tasks of McFarland and Cacace was mainly limited by high-level cognitive factors. This was presumably not the case here.
V. GENERAL DISCUSSION
In this study, we developed an ideal-observer model of the same-different binary-sequence task of Cousineau et al. (2009). This ideal-observer model allows the computation of d’ in the task as the standardized difference between the means of the sensations evoked by the A
and B stimuli of the sequence, in line with traditional SDT analyses (e.g. Macmillan et al., 1977). The ideal observer has perfect memory, and although it is not clear whether human listeners can employ the optimal strategy used by the ideal observer in this task, the ideal-observer model provides a benchmark against which the performance of human listeners can be compared. If human listeners behaved like our ideal observer, the slope relating their d’ to N should be zero. A reanalysis of the results of Cousineau et al., (2009) indicated that for pitch sequences consisting of unresolved complex tones or for loudness sequences the d’ slope was lower than zero, while for pitch sequences consisting of resolved complex tones the d’ slope was higher than zero. The
480
drop in performance of human listeners as N increases with pitch sequences consisting of
unresolved complex tones, and with loudness sequences, could be plausibly attributed to memory limitations or the use of sub-optimal strategies. On the other hand, the improvement in
performance of human listeners as N increases with pitch sequences consisting of resolved complex tones is hard to explain without postulating the existence of specific
sequence-processing mechanisms. An improvement in performance as N increases indicates that, when N > 1, human listeners are performing better than an ideal observer processing the sounds
independently of each other. Cousineau et al. (2009) previously came to the same conclusion when comparing the performance of a virtual observer to the performance of human listeners. Their virtual observer, however, was a sub-optimal observer that did not make use of all available information. It was thus important to check that their conclusion would hold when an ideal observer model is used. A reanalysis of two experiments of Cousineau et al. (2009) using the d’ measure developed with our ideal-observer model confirmed their key findings, namely a sequence-processing advantage for pitch sequences consisting of resolved complex tones over pitch sequences consisting of unresolved complex tones or sequences of complex tones varying in loudness.
In order to elucidate the origin of the sequence-processing advantage found for pitch sequences consisting of resolved complex tones, we used several types of pitch-evoking stimuli. We confirmed previous evidence (Cousineau et al., 2009, 2010a, 2010b) that sequences of complex tones containing resolved harmonics are processed better than sequences of unresolved complex tones. This sequence-processing advantage, however, did not extend to sequences of dichotic-pitch stimuli, narrow noise bands, or even pure tones. The latter finding is clearly at 502
odds with the previously proposed interpretation of the perceptual advantage of resolved
harmonics: our study suggests that this advantage does not originate from the activation of FSDs, even though there is substantial evidence that such entities do exist in the auditory system (Demany and Ramos, 2005; Demany et al., 2009, 2010, 2011; Carcagno et al., 2011; Moore et al., 2013). Demany et al. (2009) suggested that the FSDs are optimally sensitive to frequency
shifts of about 0.1 octave for resolved components of complex tones. Shifts of this size are well above the frequency discrimination threshold of pure tones presented in isolation or within complex tones (Moore et al., 1984; Gockel et al. 1987). Thus, the just-detectable shifts used in the present experiments and those of Cousineau et al. were unlikely to elicit a strong activation of the FSDs.
Our results are also at odds with the hypothesis that the proficiency of pitch-sequence processing depends on pitch salience. In Experiment 2, similar d' slopes were found for stimuli varying widely in pitch salience (100-ms pure tones, 10-ms pure tones, and unresolved complex tones). Moreover, the d' slopes obtained for the 100-ms pure tones were markedly different from those obtained for the resolved complex tones of Experiment 1, even though pitch salience was high in both cases. With the resolved complex tones, for single-element sequences, listeners needed an average frequency change of 0.75 % to achieve an average d' of 2.7. With the 100-ms pure tones, on the other hand, an average frequency change of 0.57 % yielded an average d' of 2.0. Assuming a linear relationship between log d’ and the log of the percentage F0 difference (Plack and Carlyon, 1995), these two performance levels are nearly equivalent, suggesting that pitch salience was also similar.
Given that resolved complex tones are formed by multiple pure tones, it could be
524
speculated that the advantage of resolved complex tones over pure tones in the sequence-processing task is due to their simultaneous elicitation of multiple frequency shifts, activating FSDs in independent frequency channels. However, the results obtained in Experiment 1 with the dichotic-pitch stimuli and narrow noise bands argue against this hypothesis, because these stimuli should have also activated the FSDs in multiple independent channels. Thus, the advantage found for resolved complex tones can hardly be explained in terms of pitch salience alone or number of channels alone. Nonetheless, it is conceivable that the advantage stems from an interaction of these two factors.
Another hypothesis, suggested by an anonymous reviewer of this paper, is that the efficiency of pitch-sequence processing for resolved complex tones is due to the availability of multiple salient place cues in the auditory periphery for these stimuli. Although peripheral place cues were available also in several conditions for which pitch-sequence processing was found to be poor, these place cues were either weak (Noise-Mono), limited to a single channel (PT-Long), or both (PT-Short). If this hypothesis were true, pitch-sequence processing should be better in the Noise-Mono, PT-Long, and PT-Short conditions than in the Unres and Noise-Dicho conditions.
Our data do not provide evidence of this, but we cannot rule out the possibility that our
experiments lacked sufficient power and/or measurement precision to detect subtle differences in pitch-sequence processing performance between these conditions. It is also conceivable that pitch-sequence processing performance does not improve gradually with the availability of peripheral place cues but becomes good once the availability of these cues crosses a certain threshold point.
The results of this study suggest that the activation of FSDs is not necessary for good 546
performance in the sequence-processing task. In another study, conducted in parallel (Cousineau et al., 2014), we came to the same conclusion. The sequence elements in that study were dyads
of pure tones one octave apart. These elements varied (to a small extent, once more) in either pitch (F0), loudness (overall level), or brightness of timbre (spectral profile: the relative level of the two components of the dyads). As expected from previous research, sequence processing was found to be worse for the loudness sequences than for the pitch sequences. For the brightness sequences, processing proficiency appeared to be as good as for the pitch sequences. The latter result is hard to account for in terms of FSDs since changes in brightness were produced without frequency changes.
To some extent, the brightness sequences used by Cousineau et al. (2014) mimicked sequences of vowels and hence speech. From this point of view, they were less "artificial" than the loudness sequences. Among the pitch sequences used here, those most resembling "natural" melodies (for humans) were certainly the sequences based on complex tones including resolved harmonics. Overall, therefore, it could be argued that there is a processing advantage for
"natural" rather than "artificial" sequences ("naturalness" being associated with familiarity). However, this does not imply, of course, that the advantage should be explained in such terms. Its origins remain unclear.
Acknowledgments
The experiments reported here were performed at the Institut de Neurosciences Cognitives et
Intégratives d'Aquitaine (INCIA) while the first author (SC) was a post-doctoral researcher in
this laboratory. We would like to thank Prof. Brian Moore and an anonymous reviewer for
568
helpful comments on an earlier version of this manuscript.
1Another issue with the measure of performance used by Cousineau et al. (2009, 2010a, 2010b, 2014) is that d' was
computed from the formula appropriate for the Yes/No task rather than a formula based on the same-different model
for N=1 (see Macmillan and Creelman, 2004).
2See supplementary material at [please insert URL] for ideal observer simulation code, as well as d’ tables, and R
and Julia functions to compute d’ from hit and false alarm rates using the tables. The d’ tables are stored in the
Hier-archical Data Format version 5 (HDF5) and can be accessed from several programming languages commonly used
for scientific computing including Julia, R, Python, and MATLAB.
3 The intended target d’ value was 2, but during the preliminary phase of Experiment 1 the formula for the Yes/No
task was used to compute d'. As a result the ΔF values actually targeted a d’ of about 2.5 when performance was
recomputed using the d’ tables from our ideal-observer simulations. 590
591 592 593
594 595 596 597
598
References
Bezanson, J., Edelman, A., Karpinski, S., and Shah, V. (2017). Julia: A fresh approach to numerical computing. SIAM Rev., 59, 65–98.
Bilsen, F. A. (1977). "Pitch of noise signals: evidence for a "central spectrum"," J. Acoust. Soc. Am. 61, 150–161.
Carcagno, S., Semal, C., and Demany, L. (2011). "Frequency-shift detectors bind binaural as well as monaural frequency representations," J. Exp. Psychol. Human Percept. Perform. 37, 1976–1987.
Cousineau, M., Carcagno, S., Demany, L., and Pressnitzer, D. (2014). "What is a melody? On the relationship between pitch and brightness of timbre," Front. Systems Neurosci., 7:127. Cousineau, M., Demany, L., Meyer, B., and Pressnitzer, D. (2010a). "What breaks a melody:
Perceiving F0 and intensity sequences with a cochlear implant," Hear. Res. 269, 34–41. Cousineau, M., Demany, L., and Pressnitzer, D. (2009). "What makes a melody: The perceptual
singularity of pitch sequences," J. Acoust. Soc. Am. 126, 3179–3187.
Cousineau, M., Demany, L., and Pressnitzer, D. (2010b). "The role of peripheral resolvability in pitch-sequence processing," J. Acoust. Soc. Am. 128, EL236–EL241.
Dai, H., Versfeld, N. J., & Green, D. M. (1996). The optimum decision rules in the same-different paradigm. Percept. Psychophys., 58, 1–9.
Demany, L., Pressnitzer, D., and Semal, C. (2009). "Tuning properties of the auditory frequency-shift detectors," J. Acoust. Soc. Am. 126, 1342–1348.
Demany, L., and Ramos, C. (2005). "On the binding of successive sounds: Perceiving shifts in
601
602
603 604 605 606 607 608 609 610 611 612 613 614 615
nonperceived pitches," J. Acoust. Soc. Am. 117, 833–841.
Demany, L., and Semal, C. (in press). "Automatic frequency-shift detection in the auditory system: A review of psychophysical findings," Neuroscience.
Demany, L., Semal, C., Cazalets, J. R., and Pressnitzer, D. (2010). "Fundamental differences in change detection between vision and audition,". Exp. Brain Res. 203, 261-270.
Demany, L., Semal, C., and Pressnitzer, D. (2011). "Implicit versus explicit frequency comparisons: Two mechanisms of auditory change detection," J. Exp. Psychol. Human Percept. Perform. 37, 597-605.
Gockel, H., Moore, B. C. J., Carlyon, R. P., and Plack, C. J. (2007). "Effect of duration on the frequency discrimination of individual partials in a complex tone and on the discrimination of fundamental frequency," J. Acoust. Soc. Am. 121, 373-382.
Hoekstra A. (1979) Frequency discrimination and frequency analysis in hearing. PhD Thesis. Groningen.
Houstma A. J. M., Smurzynski J. (1990). Pitch identification and discrimination for complex tones with many harmonics. J. Acoust. Soc. Am. 87, 304–310.
Hsieh, I.-H., & Saberi, K. (2007). “Temporal integration in absolute identification of musical pitch,”. Hear. Res., 233, 108–116.
Jesteadt, W. (1980). "An adaptive procedure for subjective judgments," Percept. Psychophys. 28, 85–88.
Macmillan, N. A., & Creelman, C. D. (2004). Detection Theory: A User’s Guide (2nd ed.). London: Lawrence Erlbraum Associates.
Macmillan, N. A., Kaplan, H. L., & Creelman, C. D. (1977). The psychophysics of categorical 619
620 621 622 623 624 625 626 627 628 629 630 631 632 633
perception. Psychological Review, 84, 452–471.
McFarland, D. J., & Cacace, A. T. (1992). "Aspects of short-term acoustic recognition memory: Modality and serial position effects," Audiology 31, 342-352.
Moore, B. C. J. (1973). "Frequency difference limens for short-duration tones," J. Acoust. Soc. Am. 54, 610–619.
Moore, B. C. J., Glasberg, B. R., and Shailer, M. J. (1984). "Frequency and intensity difference limens for harmonics within complex tones," J. Acoust. Soc. Am. 75, 550-561.
Moore, B. C. J., and Gockel, H. E. (2011). "Resolvability of components in complex tones and implications for theories of pitch perception," Hear. Res. 276, 88-97.
Moore, B. C. J., Kenyon, O., Glasberg, B. R., and Demany, L. (2013). "Assessing the possible role of frequency-shift detectors in the ability to hear out partials in complex tones," in Basic Aspects of Hearing: Physiology and Perception, edited by B. C. J. Moore, R. D.
Patterson, I. Winter, R. P. Carlyon, and H. E. Gockel (Springer, New York), pp. 127–135. Noreen, D. L. (1981). Optimal decision rules for some common psychophysical paradigms. In S.
Grossberg (Ed.), Mathematical psychology and psychophysiology. Proceedings of the Symposium in Applied Mathematics of the American Mathematical Society and the Society
for Industrial and Applied Mathematics (Vol. 13, pp. 237–279). Providence, RI: American
Mathematical Society.
Patterson, R. D., Peters, R. W., & Milroy, R. (1983). Threshold duration for melodic pitch. In R. Klinke & R. Hartmann (Eds.), Hearing - Physiological bases and psychophysics (pp. 321– 326). Berlin: Springer-Verlag.
Plack, C. J., & Carlyon, R. P. (1995). "Differences in frequency modulation detection and
636
fundamental frequency discrimination between complex tones consisting of resolved and unresolved harmonics," J. Acoust. Soc. Am., 98, 1355–1364.
Plack, C. J., and Oxenham, A. J. (2005). "The psychophysics of pitch," in Pitch: Neural Coding and Perception, edited by C. J. Plack and A. J. Oxenham (Springer, New York), pp. 7-55.
White, L. J., & Plack, C. J. (2003). "Factors affecting the duration effect in pitch perception for unresolved complex tones,” J. Acoust. Soc. Am. 114, 3309–3316.
Yin, P., Mishkin, M., Sutter, M., and Fritz, J. B. (2008). "Early stages of melody processing: Stimulus-sequence and task-dependent neuronal activity in monkey auditory cortical fields A1 and R," J. Neurophysiol. 100, 3009-3029.
646 647