ISSN Online: 2327-4379 ISSN Print: 2327-4352
DOI: 10.4236/jamp.2018.67132 Jul. 30, 2018 1558 Journal of Applied Mathematics and Physics
Revisit Language Modeling Competition and
Extinction: A Data-Driven Validation
Chosila Sutantawibul
1, Pengcheng Xiao
2*, Sarah Richie
1, Daniela Fuentes-Rivero
21Department of Physics, University of Evansville, Evansville, USA 2Department of Mathematics, University of Evansville, Evansville, USA
Abstract
Understanding language competition and extinction is an interdisciplinary challenge, and math models provide a tool for interpreting linguistic census data and possibly predict the language shift trend at the population scale. In this study, new data from previously examined areas were modeled, specifi-cally Catalan and Spanish in Catalonia, Spanish and English in Houston, Tex-as, Dutch and French in Brussels, Euskera and Spanish in Spain and French and English in Canada. Three mathematical models of the language competi-tion have been validated. The first is the Abrams-Strogatz model, which treats populations as having two monolingual groups. The second is the Castelló model, which considers bilingual speakers. The third is the Mira model, which considers language competition when the two languages have high similari-ties. It was found that the some of the data matched Abrams-Strogatz original model, but some divergences could still be addressed. It was also found that the Mira model needs some improvement in how it treats the differences be-tween languages.
Keywords
Language Competition Model, Parameter Estimation, Nonlinear Regression
1. Introduction
Throughout history, languages have been significantly morphed or have gone extinct. It is estimated that 90% of the languages that exist today are expected to be extinct within the next generation [1]. This is due to a multitude of reasons such as empires conquering regions and coercing the inhabitants to speak their language and globalization in which native speakers must learn the languages of their neighbors. This leads to bilingual speakers and in some cases death of a language entirely [2] [3] [4].
How to cite this paper: Sutantawibul, C., Xiao, P.C., Richie, S. and Fuentes-Rivero, D. (2018) Revisit Language Modeling Com-petition and Extinction: A Data-Driven Validation. Journal of Applied Mathematics and Physics, 6, 1558-1570.
https://doi.org/10.4236/jamp.2018.67132
Received: May 7, 2018 Accepted: July 27, 2018 Published: July 30, 2018
Copyright © 2018 by authors and Scientific Research Publishing Inc. This work is licensed under the Creative Commons Attribution International License (CC BY 4.0).
http://creativecommons.org/licenses/by/4.0/
DOI: 10.4236/jamp.2018.67132 1559 Journal of Applied Mathematics and Physics
1.1. Language Modeling
Many mathematical models have been proposed to describe the dynamics of competition between two languages in a given region. There are two primary type of models describing language competition: microscopic and macroscopic. Macroscopic models of language competition treat the population as homogeneous (all members are the same, and evenly dispersed in an area) and fully connected (all members interact with other members) [5]. These macroscopic models are usually described by differential equations. Microscopic models treat individual persons as nodes in a network, allowing each node to be connected to a certain number of other nodes, as well as individual transitioning probabilities. In this paper, we focus on three macroscopic version of language competition models: Abrams-Strogatz Model, Castelló Model, and Mira Model.
1.2. Abrams-Strogatz Model
Abrams and Strogatz proposed one of the first models to describe language competition using statistical physics and complex systems, which fueled other models of similar ideas to be published as well [6]. Abrams and Strogatz proposed a model, Abrams-Strogatz (AS) model, that describes language competition similar to the Lotka-Volterra predator-prey model, except both languages act as predator and prey to each other, as one speaker could switch from one language to another and vice versa. It assumes that the population is homogeneous and fully connected, which may not represent rural areas with sparse population or geographical separation, but could describe densely populated areas like cities. This model is described by the differential equations
[7]:
( )
( )
( )
( )
d , ,
d
d , ,
d
yx xy
xy yx
x yP x s P x s t
y xP x s P x s t
= −
= − (1)
where x y, are the fraction of the population speaking languages x and y respectively, which means that the sum of the two fractions should equal one.
xy
P is the probability that an individual would switch from speaking language x to language y. This probability is defined by:
(
1)(
1)
,a yx
a xy
P sx
P s x
=
= − − (2)
where a is the volatility of a language, or how easy it is for an individual to switch over to the other language, and s is the prestige of the language, which is how attractive a language is to switch to. These two parameters are acquired by fitting this model to the data of population speaking a specific language in an area.
DOI: 10.4236/jamp.2018.67132 1560 Journal of Applied Mathematics and Physics people speaking y to change to x (people speaking y changing to speak
x) minus the population of language x times the probability of changing from x to y (people speaking x changing to y). This model considers the speakers of each language to be strictly monolingual.
At high volatility (a>1), the few stable state (fraction of population speaking one language and the other no longer changes) of this model are when the entire population speaks one language while the other dies (s≠0.5) and when both languages have the same amount of speakers (s=0.5). Since the condition for stability where both languages survive is so precise, the AS model almost always predicts that one language will eventually go extinct while the rest of the population adapts to the other language.
1.3. Castelló Model
Inspired by the original proposal of Wang and Minett [8], Castelló, et al.’s model extends the AS model by considering a third possible state which the population could be in, which is bilingual. This allows the population to change from speaking the only language x to speaking both languages b to speaking the only language y, and vice versa. This model also assumes homogeneous and fully connected population. The presence of a third intermediate state slows down the process of language extinction, but still does not indefinitely prevent it [9].
The differential equations that describe this model are:
(
)
(
)
(
)
d d d d d dYX BX XY XB
XY BY YX YB
XB YB BX BY
x yP bP x P P t
y xP bP y P P t
b xP yP b P P t
= + − +
= + − +
= + − +
(3)
Again, these equations are simply rate equations, with the probabilities:
(
)
(
)(
)
(
)(
)(
)
1
1 1
1 1 1
a XB a YB a BX a BY
P s xy
P syx
P s x y y
P s x y x
= − =
= − − −
= − − − −
(4)
Qualitative and quantitative analyses were both explored on complex networks and two-dimensional square lattices, and details in Ref. [10]. Castelló, et al. found that there exists a transition from one language dominance state to language coexistence state, and maintaining the coexistence state is very challenging under the bilinguals situation. The parameters in this model are also acquired by fitting the model to data.
1.4. Mira Model
DOI: 10.4236/jamp.2018.67132 1561 Journal of Applied Mathematics and Physics factor that describes the similarity between the two languages, k, a, s, and k are all acquired by fitting the model to the data as well. Mira talks about the possibility of calculating k based on the similarity of the language, such as words, grammar, and structure. Mira had k = 1 to be the situation where the languages are identical and k = 0 to be where the languages are entirely different. The process of calculating can be very complicated and has yet to be developed [11].
The differential equation that describes Mira’s model is the same as Equation (3), but the transition probabilities are different, as the transition probabilities must contain the k value [12]:
(
)
(
) (
)
(
)
(
) (
)
1
1 1
1
1 1
a XB Y
a
XY Y
a
YB X
a
YX X
P ks x
P k s x
P ks y
P k s y
= −
= − −
= −
= − −
(5)
Mira’s work focus on the time evolution of two coexisting languages (Castillian Spanish and Galician) under the framework of AS model. It claims that if the languages in the competition are similar enough, then a stable bilingual situation is possible. A sufficiently large value of k is needed for this particular situation [6] [12].
1.5. Questions to Be Answered
While the models thus far have found the volatility to be constant to fit their model, this was something that could still be examined with more data. Also, the prestige of other languages could be determined if other data sets were considered. The other question was how these models could be added upon or improved. Given the full range of areas where language competition exists, looking at more data sets would lend to more possibilities for improving these models, especially Mira and Castelló’s models. In this research work, we focus on the macroscopic model. Macroscopic modeling was also more frequently reported, so it would be easier to check if our results are accurate.
The paper is organized as follows. Section 2 describes the method for the model validation. The first part is devoted to introduce the method we used for computing the parameters, while the second part describes the accumulated data from eight different regions. In Section 3, we carry on parameters fitting results based on the data from Section 2. The paper concludes with a discussion in Section 4.
2. Method
DOI: 10.4236/jamp.2018.67132 1562 Journal of Applied Mathematics and Physics allow for that distance to be the smallest. This method is different from Abrams and Strogatz’s method, as they wrote their own routines to numerically compute the differential equation as well as well as their own routine to compute the parameters. They used least absolute value regression, rather than least square regression, to compute their parameters, which may lead to discrepancies in their acquired parameters and our parameters [7].
Data Accumulation
The dataset that we considered were of those that have direct language competition, which means that other languages are spoken in the area beside the main two account for less than 10% of the population. Most data were taken from country censuses, and some data manipulation was required.
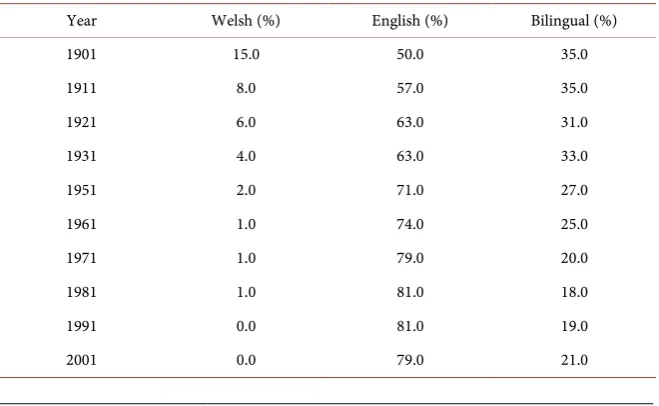
1) Welsh-English
This data (Table 1) [13] was chosen because it was one of the data that Abrams and Strogatz fit in their paper. The results from fitting this could be compared to the original paper.
2) Gaelic-English
This is also one of the data (Table 2) [13] that Abrams and Strogatz fit in their paper. The results from fitting this could be compared to their work.
3) Euskera-Spanish (Spain)
Euskera and Spanish are the two main languages spoken in northern Spain. This data (Table 3) only consider people who speak either Euskera, Spanish, or both. People who do not speak either are not accounted for. This data were taken from Sociolinguistic Maps Reports [14].
4) French-English (Canada)
[image:5.595.210.540.536.739.2]People who speak neither French nor English were not accounted for in this dataset. Canadian government has policies that support their citizens to be bilingual, as well as preserve both languages. Data (Table 4) were taken from Statistics of Canada [15].
Table 1. Welsh-English data.
Year Welsh (%) English (%) Bilingual (%)
1901 15.0 50.0 35.0
1911 8.0 57.0 35.0
1921 6.0 63.0 31.0
1931 4.0 63.0 33.0
1951 2.0 71.0 27.0
1961 1.0 74.0 25.0
1971 1.0 79.0 20.0
1981 1.0 81.0 18.0
1991 0.0 81.0 19.0
DOI: 10.4236/jamp.2018.67132 1563 Journal of Applied Mathematics and Physics
Table 2. Gaelic-English data.
Year Gaelic (%) English (%) Bilingual (%)
1891 5.2 27.6 67.2
1901 2.2 32.1 65.7
1911 9.3 41.3 57.7
1921 3.8 47.8 51.9
1931 1.5 56.0 43.9
1951 0.1 75.7 24.3
1961 0.1 82.7 17.3
[image:6.595.209.540.277.376.2]1971 0.0 86.0 14.0
Table 3. Euskera-Spanish data.
Year Euskera (%) Spanish (%) Bilingual (%)
1991 10.0 84.5 5.5
2001 13.5 78.2 8.3
2006 12.5 81.4 6.1
2011 12.7 80.0 7.3
2016 13.4 79.5 7.1
Table 4. French-English data.
Year French (%) English (%) Bilingual (%)
1996 68.2 14.5 17.3
2001 68.6 13.5 17.9
2006 68.8 13.5 17.7
2011 69.4 12.8 17.8
2016 69.6 12.15 18.2
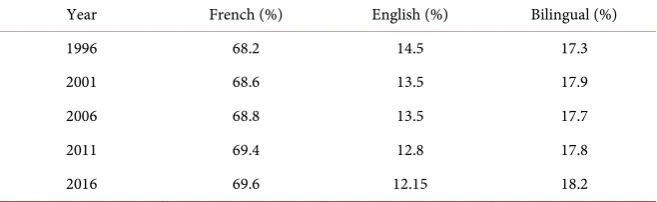
5) French-English (Montreal)
Since the models assume even density within the population, we decided to also look at Montreal, which is a fairly dense city. Values from this dataset could be compared to values calculated from all of Canada. Data (Table 5) were also taken from Statistics of Canada [15].
6) Spanish-English (Houston)
We looked at English and Spanish spoken in Houston, Texas. The data (Table 6) were taken from the American census [16].
7) Catalan-Spanish
[image:6.595.210.539.411.512.2]DOI: 10.4236/jamp.2018.67132 1564 Journal of Applied Mathematics and Physics
Table 5. French-English data.
Year French (%) English (%) Bilingual
1996 8.7 40.6 50.7
2001 7.7 38.5 53.8
2006 7.5 39.8 52.8
2011 7.6 37.7 54.8
[image:7.595.209.539.225.325.2]2017 7.2 36.9 55.9
Table 6. Spanish-English data.
Year Spanish (%) English (%)
1970 2.6 97.4
1980 13.0 83.0
1990 30.0 70.0
2000 34.0 76.0
2014 38.0 54.0
the census only goes back to 2003. This data (Table 7) were taken from Language Use of the Population of Catalonia [17].
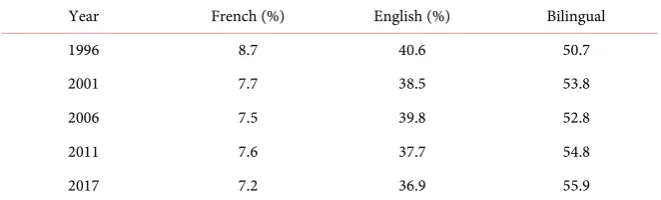
8) French-Dutch(Brussels)
The French and Dutch data spoken in Brussels, Belgium. This dataset (Table 8) [18] may not be very accurate, as the census only indicates knowledge of each language, and not if a person is bilingual or not.
3. Results
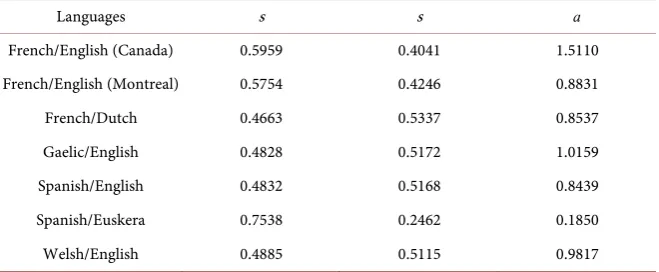
3.1. Abrams-Strogatz Model
Table 9 summarizes the fitted parameters of the different language competitions using the AS model. The second s value was calculated by subtracting the first s value from 1. Most of the s values for the first language are in the mid-range (4≤ ≤s 6) except for the competition between Spanish and Euskera in Spain, where sSpanish =0.7538 and sEuskera=0.2462 . The a values acquired were
unexpectedly low (a≤1), since Abrams and Strogatz got a values that were close to 1.33. This could be caused by the fact that we used a different fitting routine than Abrams and Strogatz.
DOI: 10.4236/jamp.2018.67132 1565 Journal of Applied Mathematics and Physics
Table 7. Catalan-Spanish data.
Year Spanish (%) Catalan (%) Bilingual (%)
2003 46.0 49.0 4.7
2008 35.6 52.4 12.0
[image:8.595.209.539.191.377.2]2013 36.3 56.6 6.8
Table 8. French-Dutch data.
Year French (%) Dutch (%)
1842 37.6 60.8
1846 28.4 60.3
1866 20.0 39.1
1880 25.0 26.4
1890 20.1 23.0
1900 23.0 19.7
1910 16.4 26.7
1920 8.2 32.8
1930 12.0 33.6
1947 9.6 35.3
Table 9. Parameters of different language competitions using the Abrams-Strogatz model.
Languages s s a
French/English (Canada) 0.5959 0.4041 1.5110
French/English (Montreal) 0.5754 0.4246 0.8831
French/Dutch 0.4663 0.5337 0.8537
Gaelic/English 0.4828 0.5172 1.0159
Spanish/English 0.4832 0.5168 0.8439
Spanish/Euskera 0.7538 0.2462 0.1850
Welsh/English 0.4885 0.5115 0.9817
population over the years, or the dataset only contained data for a short period. The determination of a and s depends heavily on the shape and length of the rapid growth/decay region of the graphs, so without sufficient data in that region, the values of a and s could vary depending on what initial value was given to lsqcurvefit. This problem applies to all three models.
[image:8.595.210.540.410.546.2]DOI: 10.4236/jamp.2018.67132 1566 Journal of Applied Mathematics and Physics
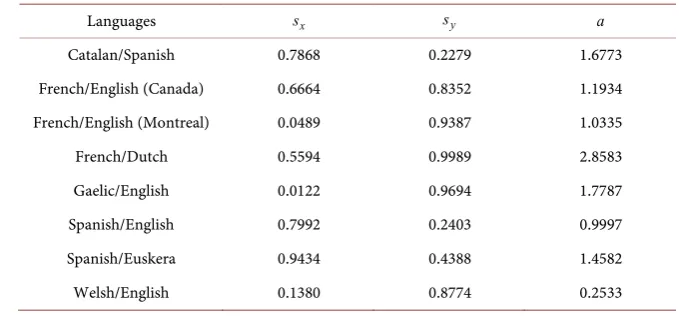
3.2. Castelló Model
Table 10 shows the resulting parameter values from fitting the Castelló model to different language competition data. In this model, the s values of the second language should be assumed to be 1−sfirst language ; however, in data for
French/Dutch, Spanish/Euskera, and French/English (Montreal), we were not able to acquire proper fit to the data, due to the lack of strictly increasing or decreasing trend. To get the fit to work properly, we allowed lsqcurvefit to fit different s values for the two languages, instead of treating the other as (1 − s). This allowed the graphs to have a nice fit, but the s values for the two languages could add up to more than 1. Other data that are not problematic fitted with this method still yielded s values that add up very close to 1.
Besides languages that turn out having higher than one sum of s values, other exciting points include French in Montreal having a shallow s value of 0.0489. This is very interesting as the s value for French in all of Canada is 0.6664, which is much higher. This could be due to the fact that, despite a large number of people living in Canada are French monolinguals, most people in Montreal are English monolinguals.
The s value for Gaelic is very small as well, 0.0122. This could be explained by the fact that the number of people who speak Welsh is tiny, even to begin with, 5.2%, and after 1971, there are no more monolingual Welsh speakers.
As mentioned in the previous section, parameters for some datasets were also heavily dependent on the initial value declared for the parameter, so the values in the table displayed were chosen by what gives the best looking fit.
The parameters calculated in this model also predict that one language would disappear eventually, except for Spanish/English in Houston. This could possibly be caused by the last several data in the dataset slowing down in decay, leading the model to predict that the population steadies out.
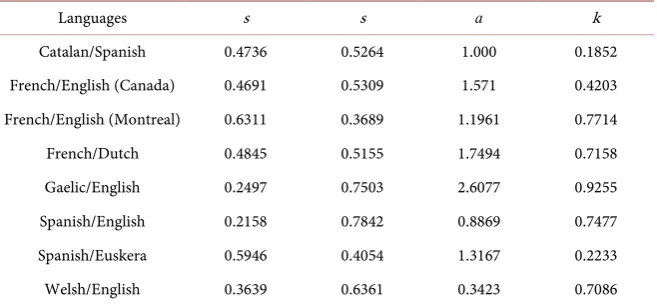
3.3. Mira Model
Table 11 shows the fitted s s ax, ,y and k values for each language. As mentioned in Introduction section that the similarity between languages, k, is
Table 10. Parameters of different language competitions using the Castelló model.
Languages sx sy a
Catalan/Spanish 0.7868 0.2279 1.6773
French/English (Canada) 0.6664 0.8352 1.1934
French/English (Montreal) 0.0489 0.9387 1.0335
French/Dutch 0.5594 0.9989 2.8583
Gaelic/English 0.0122 0.9694 1.7787
Spanish/English 0.7992 0.2403 0.9997
Spanish/Euskera 0.9434 0.4388 1.4582
DOI: 10.4236/jamp.2018.67132 1567 Journal of Applied Mathematics and Physics
Table 11. Parameters of different language competitions using the Mira model.
Languages s s a k
Catalan/Spanish 0.4736 0.5264 1.000 0.1852
French/English (Canada) 0.4691 0.5309 1.571 0.4203 French/English (Montreal) 0.6311 0.3689 1.1961 0.7714
French/Dutch 0.4845 0.5155 1.7494 0.7158
Gaelic/English 0.2497 0.7503 2.6077 0.9255
Spanish/English 0.2158 0.7842 0.8869 0.7477
Spanish/Euskera 0.5946 0.4054 1.3167 0.2233
Welsh/English 0.3639 0.6361 0.3423 0.7086
not calculated but fitted with data instead, since the calculation for k has yet to be done, and if so, it would be very complicated. Some interesting results regarding k values fitted with the data include: Catalan/Spanish (k = 0.1852) and Gaelic/English (k = 0.9255). k = 0 means that a language is completely different while k = 1 means the languages are identical. Catalan and Spanish are similar enough that Catalonan speakers and Spanish speakers should be able to understand each other; however, in our fit, Catalan and Spanish only have a k value of 0.1852, indicating minimal similarity. This could be due to the fact that the Catalan/Spanish dataset only contains 3 points over ten years, which is not long enough to see a significant increase or decrease in the fraction of people speaking a language, which could make it hard to determine fitting parameters for the dataset.
4. Discussions
In the Abrams-Strogatz model, the primary assumption made was that only monolingual people exist. This is not quite accurate in the real world since these type of situations rarely exist, especially for a very long time. In this paper, only the macroscopic level was examined, which assumed that all people spoke to each other. The results presented in the Abrams-Strogatz model are reasonably accurate for modeling how languages die since the trend for AS tends to match the trends seen in the Castelló model. The results presented within were a relatively close to what was reported, and the main reason for possible discrepancies is that Abrams created his fitting which was no longer available.
DOI: 10.4236/jamp.2018.67132 1568 Journal of Applied Mathematics and Physics the prestige and volatility seemed, for the most part, to vaguely match what was expected. If the fit was bad, this is most likely due to insufficient data. This is especially true for Catalonia. Another reason our model yielded unexpected results is that some countries have policies in place to keep these languages alive. Montreal is very adamant about keeping French as an active language, so there isn’t a precise curve because of this.
For the Mira model, similar assumptions were made from the Castelló model. Mira, et al. assumed that the similarity, k, could be found from a fitting parameter. However, this parameter doesn’t seem to accurately depict the similarity between languages. It assumes that languages that have no similarity have k = 0. However this doesn’t seem to be accurate. It was found that languages that should have had high values of k did not and languages that should have had low k values sometimes had high k values. This was even found for extensive data sets such as that from Welsh and English. k for Welsh and English was found to be about 0.7, which is much too high for languages that do not have commonalities. This problem for adding in language similarity could be rectified by defining k as value determined from the languages themselves and not from a best fit line.
In this paper, we have carried out the validations for three macroscopic language models with datasets from eight different regions. Through linear regression method, we have derived the key fitting parameters for each model. The results imply that Abrams-Strogatz original model corporates well with most of the datasets. A similar conclusion can be derived for Castelló model, although small divergences can also be addressed. However, the parameter of language similarity in Mira model has a limited description regarding the fitting data.
Modeling language competition can be mainly divided into two categories: equation-based model and agent-based model. While equation-based models have been a very popular approach for describing language shift and most of them perform good fit with empirical data, the limitations still cannot be ignored. Coupling with agent-based model is one of the key obstacles. More details regarding the limitation of equation-based model can be viewed in Ref.
[19]. Prochazka and Vogl’s model [20] presented a new approach through a microscopic description of language shift from Slovenian to German in southern Carinthia on a fine spatial scale.
Acknowledgements
This research is supported by UE Global Scholar Grant. The authors appreciate the anonymous referee for the constructive review of the paper which has greatly improve the quality of the article. The authors would also like to thank the generous support from the mathematics department at University of Evansville.
Conflicts of Interest
DOI: 10.4236/jamp.2018.67132 1569 Journal of Applied Mathematics and Physics
References
[1] Krauss, M. (1992) The World’s Languages in Crisis. Language, 68, 4-10. https://doi.org/10.1353/lan.1992.0075
[2] Grenoble, L.A. and Whaley, L.J. (2006) Saving Languages: An Introduction to Lan-guage Revitalization. Cambridge University Press, Cambridge, UK.
[3] Sutherland, W.J. (2003) Parallel Extinction Risk and Global Distribution of Lan-guages and Species. Nature, 423, 276-279. https://doi.org/10.1038/nature01607 [4] McMahon, A. (1994) Understanding Language Change. Cambridge University
Press, Cambridge, UK. https://doi.org/10.1017/CBO9781139166591
[5] Kandler, J. and Steele, J. (2017) Modeling Language Shift. Proceedings of the Na-tional Academy of Sciences of the United States of America, 114, 4851-4853. https://doi.org/10.1073/pnas.1703509114
[6] Patriarca, M. and Castelló, X. (2012) Modeling Two-Language Competition Dy-namics. Advances in Complex Systems, 15, Article ID: 1250048.
https://doi.org/10.1142/S0219525912500488
[7] Abrams, D. and Strogatz, S. (2003) Modelling the Dynamics of Language Death. Nature, 424, 900. https://doi.org/10.1038/424900a
[8] Wang, W.S.-Y. and Minett, J.W. (2005) The Invasion of Language: Emergence, Change and Death. Trends in Ecology & Evolution, 20, 263-269.
https://doi.org/10.1016/j.tree.2005.03.001
[9] Castelló, X., Eguíluz, V.M. and San Miguel, M. (2006) Ordering Dynamics with Two Non-Excluding Options: Bilingualism in Language Competition. New Journal of Physics, 8, 308. https://doi.org/10.1088/1367-2630/8/12/308
[10] Vazquez, F., Castelló, X. and San Miguel, M. (2010) Agent Based Models of Lan-guage Competition: Macroscopic Descriptions and Order-Disorder Transitions. Journal of Statistical Mechanics: Theory and Experiment, 2010, P04007.
https://doi.org/10.1088/1742-5468/2010/04/P04007
[11] Mira, J. and Paredes, Á. (2005) Interlinguistic Similarity and Language Death Dy-namics. EPL (Europhysics Letters), 69, 1031.
https://doi.org/10.1209/epl/i2004-10438-4
[12] Mira, J., Seoane, L. and Nieto, J. (2011) The Importance of Interlinguistic Similarity and Stable Bilingualism when Two Languages Compete. New Journal of Physics, 13, Article ID: 033007. https://doi.org/10.1088/1367-2630/13/3/033007
[13] Zhang, M. and Gong, T. (2013) Principles of Parametric Estimation in Modeling Language Competition. Proceedings of the National Academy of Sciences of the United States of America, 110, 9698-9703. https://doi.org/10.1073/pnas.1303108110 [14] Sociolinguistic Maps Reports (Mapa Sociolingüístico).
http://www.euskara.euskadi.eus/r59-738/es/contenidos/informacion/argitalpenak/es
_6092/mapas_sociolinguisticos.html
[15] Statistics of Canada. https://www.statcan.gc.ca
[16] (2013) United States Census and American Community Survey: Language Use in the United States.
https://www.census.gov/topics/population/language-use.html
[17] Ministry of Culture. Government of Catalonia (2013) Language Use of the Popula-tion of Catalonia.
http://llengua.gencat.cat/web/.content/documents/publicacions/altres/arxius/EULP
DOI: 10.4236/jamp.2018.67132 1570 Journal of Applied Mathematics and Physics [18] Leuvensteijn, J.A., van Tooren, M.C., Pijnenburg, W.J.J. and van der Horst, M. (1997) Language Faculty of Humanities. Amsterdam University Press, Amsterdam. [19] Wichmann, S. (2014) The Challenges of Languages Dynamics: Comment on
“Mod-elling Language Evolution: Examples and Predictions” by Gong, Shuai, and Zhang. Physics of Life Reviews, 11, 303-304. https://doi.org/10.1016/j.plrev.2014.01.015 [20] Prochazka, K. and Vogl, G. (2017) Quantifying the Driving Factors for Language