Consistent prevalence of inadequate micronutrient
intakes across six years of second-year medical
school students
Lynn Seabolt, Taren B. Spence, Heidi J. Silver*
Department of Medicine, Division of Gastroenterology, School of Medicine, Vanderbilt University, Nashville, USA;
*Corresponding Author: Heidi.j.silver@vanderbilt.edu
Received 8 February2012; revised 20 March2012; accepted 17 April 2012
ABSTRACT
Background: The dietary behaviors of physic- cians and medical students are strongly associ- ated with their nutrition counseling practices. Little research to date describes their dietary intakes and no recent studies have assessed the adequacy of their micronutrient intakes. As mi- cronutrient imbalances are associated with a variety of chronic diseases, public guidelines target increasing dietary nutrient density. The purpose of this study was to identify micronu- trient imbalances in the diets of medical stu- dents and determine whether intakes are be- coming more compliant with dietary guidelines over time. Methods: From 2000 to 2006, 409 second-year Vanderbilt University medical stu- dents completed the Block Brief 2000 food fre- quency questionnaire prior to the required “In- troduction to Clinical Nutrition” course. Nutrient data were compared to Dietary Reference Intake values. Results: Dietary intakes of male students were consistently inadequate for vitamin E, vi- tamin D, calcium, magnesium and potassium across the six cohorts. Despite a significant in- crease over time in the number of vegetable servings consumed, the intakes of female stu- dents revealed the same inadequacies, as well as inadequate folate and iron intakes. Multivita- min and multimineral supplementation, con- sumed regularly by 51% of students, closed the gap in meeting estimated micronutrient re- quirements, except vitamin E. Conclusions: These data can be used to inform the content of nutrition interventions for medical students fo- cused on making optimal food selection choices as well as the content of nutrition education in the medical school curriculum. It is important to enhance medical students’ preparedness as fu-
ture health care providers—not only to serve as role models for healthy dietary behaviors, but also to better recognize the nutrition needs of their future patients.
Keywords: Micronutrients; Students; Physicians; Dietary Intake
1. INTRODUCTION
Healthy People 2000, 2010 and 2020 objectives in- clude increasing the proportion of patients who routinely receive nutrition assessments and the proportion of phy- sician office visits that include nutrition/diet education and counseling [1]. These objectives stem from the com- pelling body of evidence elucidating the importance of dietary intakes for health maintenance and chronic dis- ease risk reduction. Shifting the focus of health care de- livery from treatment to prevention requires a parallel adjustment in the content of nutrition education in medi- cal schools and in the health behaviors of practicing phy- sicians. In fact, studies show that physicians and medical students’ awareness of their dietary behaviors and know- ledge of their nutrient imbalances impacts their nutrition counseling practices and provision of appropriate nutria- tion care to patients [2-5]. Not only are physicians and medical students who consume more fruits and vegeta- bles more likely to provide nutrition counseling, they also consider their advice to be more believable [4,6]. Further, physicians who share their own beneficial diet and exercise behaviors during patient counseling are perceived by patients to be more credible and more mo- tivating [7]. These findings underscore the potential role of future physicians as models for healthy behaviors and the likelihood that patients will become more engaged in dietary behavior change when recommended by physi- cians who practice what they counsel.
ing [11-17], and nutrition counseling practices [18,19] of US physicians and medical students, few investigations describe their dietary intakes. Using 24-hour recall, Heim- burger and colleagues [20] reported a significant decline in total fat intake along with a trend for decreasing satu-rated fat intake in first-year medical students attending the University of Alabama from 1989 to 1992. Similarly, Banks and colleagues [21] observed a decline in total fat intake during medical school in students who completed repeated food frequency questionnaires (FFQ). In a more recent investigation, Spencer and colleagues [22] showed that while medical students who reported being vege-tarians consumed significantly more fruit, vegetable and dairy servings daily than non-vegetarians, average fruit and vegetable consumption of all students was lower than dietary guidelines and declined during medical school.
Interestingly, little attention has been paid to the mi- cronutrient intakes of medical students. Yet, national data indicate that most Americans consume inadequate amounts of several micronutrients, especially vitamin A, vitamin C, vitamin E, calcium, magnesium and potas- sium [23]. These inadequacies are concerning as subop- timal micronutrient intakes are associated with a wide range of health conditions and chronic disease states [24-38]. Consequently, the US Departments of Health and Human Services and Agriculture in the Dietary
Guidelines for Americans, 2010 emphasize increasing
the micronutrient density of the diet by consuming greater amounts of foods rich in vitamins, minerals, and fiber, while reducing consumption of energy-dense foods [23]. It is expected that physicians will participate in implementing public adherence to these recommenda- tions.
As prior investigation of the micronutrient adequacy of physicians or medical students’ diets is scant, the main objective of this study was to identify micronutrient im- balances in the diets of current US medical students and determine whether intakes are becoming more compliant with dietary guidelines over time. Although often over- looked by health care providers, the wide prevalence of micronutrient inadequacies in the general population indicates that regardless of healthcare setting future phy- sicians will interact with patients at risk. Hence, it is necessary for medical students to become well-prepared to incorporate appropriate nutrition counseling into their future clinical practices and be able to recognize patients in need of referral to registered dietitians. Having spe- cific information about their own diet and nutrient in- takes may be an indicator of their preparedness for meeting the Healthy People objectives to provide rele- vant nutrition services and it may also provide insight into their nutrition education needs.
2. METHODS
2.1. Administration of Food Frequency Questionnaire
Beginning December 2000 and ending December 2006, all second year Vanderbilt University School of Medicine (VUSM) students registered for the required spring semester “Introduction to Clinical Nutrition” course received a Block Brief 2000 FFQ (Block Dietary Data Systems, Berkeley, CA) in their campus mailboxes four weeks prior to the beginning of the semester. Writ- ten instructions were provided describing how to com- plete the FFQ and use a food serving size poster (2D Food Portion Visual, Nutrition Consulting Enterprises, Framingham, Mass.) to estimate portion sizes. Students were instructed to return the FFQ within two weeks in the addressed stamped envelopes provided. Question- naires were reviewed for completeness upon return. The primary purpose of the FFQ exercise in the context of the Introduction to Clinical Nutrition course was to familiar- ize students with a common method of dietary assess- ment, to promote reflection on personal dietary habits and food choices, and to identify nutrient imbalances. The study conformed to Health Insurance Portability and Accountability Act guidelines and was deemed exempt by the Vanderbilt University Institutional Review Board.
2.2. Food Frequency Questionnaire Data
The Block Brief 2000 FFQ [39] is a practical and eas- ily administered instrument that contains a food list of 70 items designed to assess usual food and beverage con- sumption over the past year. This instrument was also chosen because the food list and portion sizes were iden- tified as the largest contributors to nutrient intakes in the average American diet by the Third National Health and Nutrition Examination Survey (NHANES III) die-tary recall data [39]. In addition, the nutrient database was developed from the USDA Nutrient Database for Standard Reference [40]. Further, it has been validated against three- and seven-day food records in males and females [39]. Frequency of consumption of the 70 foods was reported at nine levels of intake from “never” to “every day”. In addition, there were seven dietary be- havior queries on food preparation methods and fat in- take, one query on fiber intake, and 13 queries on vita- min and mineral intakes. Seven demographic variables were included to describe gender, age, height, weight, smoker status, pregnancy status and supplement use.
2.3. Data Analysis
trient data were excluded from further analyses if total daily energy intake values were out of the range of the normal distribution curve, i.e., <600 kcal (n = 8) or >4000 kcal (n = 2). To assess the adequacy of energy, protein and fiber intakes, paired two-sample t tests were performed for males and females separately to compare intakes to nutrient-based reference values using the Ac- ceptable Macronutrient Distribution Ranges [41] for young adults aged 19 - 30 years. Likewise, micronutrient intakes were compared to the Estimated Average Re- quirement (EAR) or Adequate Intake (AI) value as de- fined by the Institute of Medicine Food and Nutrition Board in the Dietary Reference Intakes [42]. To compare differences in intakes over time, general linear models (GLM) were conducted for univariate analyses of nutria- ent outcome variables with school year and gender as fixed effects (interaction effect of gender with year in study). Energy (calories) was included in the GLM mod- els as a covariate to control for the relationship between energy and nutrient intakes. Nutrient outcome variables were analyzed from food and from dietary supplements. A conservative type I error rate of ≤ 0.01 was maintained for tests of statistical significance. Values are expressed as means ± SD.
3. RESULTS AND DISCUSION
Overall, 409 of 627 (65%) eligible VUSM students re- turned their FFQ within the two-week data collection period. No significant differences were detected by year for demographic variables. The self-reported ethnic make- up of students was 74% Caucasian, 19% Asian, 5% Afri- can American and 2% Hispanic. Fifty-one percent were male and the mean age was 24 ± 2 years. The mean BMI for males was 23.8 ± 2.9 kg/m2 and 21.0 ± 2.3 kg/m2 for females. Only two students reported current smoking and no females reported pregnancy. Sixteen (4%) students re- ported consuming no meat, chicken or fish.
Over the six-year period of student cohorts, no signi- ficant changes in the amounts of energy or macronu- trients being consumed were detected (P = 0.683). Ave- rage reported daily energy intakes was 1825 ± 580 kcal/ day for males and 1388 ± 540 kcal/day for females. Di- etary macronutrient composition averaged 31% ± 6% fat, 51% ± 8% carbohydrate and 18% ± 4% protein for males and 30% ± 6% fat, 53% ± 7% carbohydrate and 17% ± 3% protein for females. Energy, protein and total fiber intakes were significantly less than estimated require- ments for males and females in all years (Ps < 0.001). In contrast, saturated fat intakes (males: 22% ± 10%, females: 17% ± 9%) were significantly greater than the current recommendation of <10% total calories. Notably, these findings are inconsistent with advances in national recommendations for healthful eating as depicted in the
Dietary Guidelines for Americans, 2005 or the US De-
partment of Agriculture MyPyramid Food Guidance Sys- tem [43,44].
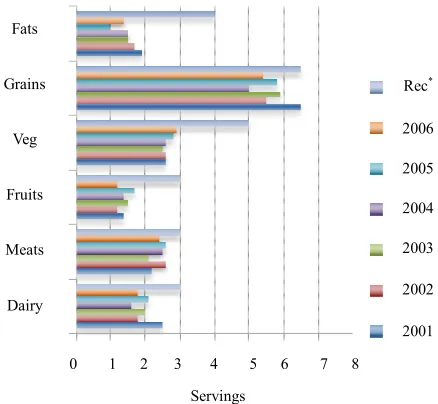
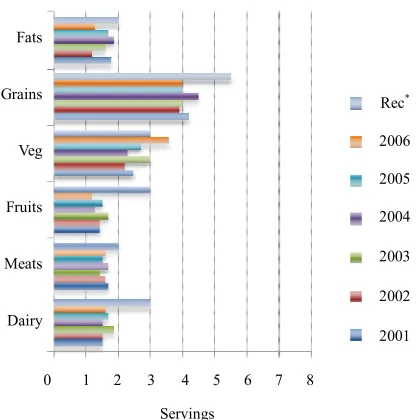
As reported energy intakes were low, it follows that average daily consumption from key food groups was also low (Figures 1 and 2). Overall, male students re- ported consuming 2.4 ± 1.6 meat servings/d, 2.0 ± 1.2 dairy servings/d, 5.7 ± 2.1 grain servings/d, 1.4 ± 0.8 fruit servings/d, 2.7 ± 1.6 vegetable servings/d and 1.6 ± 1.0 fat servings/d. Female students reported consuming 1.6 ± 0.8 meat servings/d, 1.6 ± 0.9 dairy servings/d, 4.1 ± 1.9 grain servings/d, 1.4 ± 0.7 fruit servings/d, 2.8 ± 1.8 vegetable servings/d and 1.6 ± 1.1 fat servings/d. The only food group for which there was a significant in- crease in the number of servings consumed across the cohorts was the vegetable group, increasing from 2.6 ± 1.5 to 3.3 ± 2.1 servings/d (P = 0.014) across female cohorts.
Food and beverage intakes were consistently high in sodium, phosphorus and vitamin A (Tables 1). Overall, 90.7% of males and 63.6% of females reported consum- ing more sodium than the recommended AI. Sodium in- takes were mainly from regular consumption of lunch meats, chips, pizza and French fries. In addition, 97% of males and 90.3% of females reported consuming more phosphorus than the EAR, primarily from consuming milk, cheese and soft drinks.
Simultaneously, males’ food intakes were consistently inadequate in vitamin E, vitamin D, calcium, magnesium and potassium (Table 1(a)). Overall, 87.3% of males re- ported consuming foods that provided less than the EAR for vitamin E. The main sources of vitamin E intakes
0 1 2 3 4 5 6 7 8 Fats
Grains
Veg
Fruits
Meats
Dairy
Servings
Rec*
2006
2005
2004
2003
2002
2001
Figure 1. Average reported number of food group servings
consumed each year by male medical students in comparison to
[image:3.595.314.533.492.694.2]0 1 2 3 4 5 6 7 8 Fats
Grains
Veg
Fruits
Meats
Dairy
Servings
Rec*
2006
2005
2004
2003
2002
[image:4.595.74.282.85.295.2]2001
Figure 2. Average reported number of food group servings
consumed each year by female medical students in comparison
to MyPyramid recommendations (Rec*).
were derived from consuming chips, salad dressing and peanut butter. Although males reported regular consump- tion of milk, cheese, yogurt and ice cream, 61% of males had intakes that provided less than the AI for calcium and 61.8% had intakes that provided less than the AI for vitamin D. Similarly, 62.7% of males consumed foods that provided less than the EAR for magnesium, derived primarily from vegetable and legume intakes. As daily fruit servings were low (Figure 1(a)), primarily from limited orange juice, apple and banana intakes, 94.6% of males consumed less than the AI for potassium.
For females, food intakes consistently provided inade- quate amounts of folate, vitamin D, vitamin E, calcium, potassium, magnesium and iron (Table 1(b)). Overall, 51.8% of females had intakes that provided less than the EAR for folate despite daily consumption of eggs or (fortified) cereals. As displayed in Figure 1(b), females reported consuming a variety of dairy products (i.e., milk, cheese, yogurt and ice cream), 73.8% had intakes that provided less than the AI for calcium and 73.3% had intakes providing less than the AI for vitamin D. Simi- larly to male students, females derived most of their vita- min E intakes from consuming salad dressing and peanut butter, but 95.4% had intakes providing less than the EAR. Almost all (99%) females’ intakes provided less than the AI for potassium and 45.1% consumed less than the EAR for magnesium. In addition, 25.6% of females reported intakes that provided less than the EAR for iron, although the majority of iron intakes were from heme protein sources (i.e., chicken, hamburger, other beef and pork).
The finding of high sodium, phosphorus and vitamin
A intakes in the setting of insufficient intakes of other key micronutrients emphasizes the need for medical stu- dents to learn how to optimize the nutrient density of their daily intakes. Certain simple additions or substi- tutions could be recommended that are likely to yield significant improvements. For example, substituting foods from the legumes group (i.e., dry beans, peas and lentils) as protein sources in main meals and adding various types of nuts and seeds as between-meal snacks would be a relatively easy strategy to better balance dietary in- takes and a potential solution to improving the intakes of vitamin E as well as folate, iron, calcium, magnesium, potassium, fiber and protein [45]. Students could also be taught to make intentional choices regarding their sta- ple foods such as selecting calcium-fortified orange juice and cereals that are folate-fortified and high in fiber.
While foods and beverages are the preferred sources of micronutrient intakes because of the variety, synergy and bioavailability of nutrients provided, the present data suggest that inadequate total food intake may be a prob- lem in this population. In light of this concern, multivi- tamin multimineral (MVM) supplementation may be another strategy to close the gap between intakes and requirements [46]. Consistent with prior literature [47], the present data showed that about half (51%) of students in each cohort reported taking MVM regularly for an average of three years. For supplement users, total folate, vitamin E, vitamin D, calcium, magnesium and iron in- takes were significantly greater than non-supplement users (all Ps < 0.001). Thus, supplement use increased total micronutrient intakes to levels that met the respective nutrient reference values, except for vitamin E which re- mained deficient in 14% - 28% of students in each co- hort.
In interpreting these data, some limitations should be noted. The data were not collected from a random sam- ple but rather a convenience sample of medical students.
Table 1. (a) Average micronutrient intakes from reported food and beverage intakes of male second year medical students across six
years; (b) Average micronutrient intakes from reported food and beverage intakes of female second year medical students across six years.
(a)
Source* 2001 2002 2003 2004 2005 2006
n = 38 n = 33 n = 31 n = 33 n = 30 n = 38
Vitamins
Thiamin (mg) 1.2 1.9 ± 0.6 1.2 ± 0.5 1.8 ± 0.6 1.5 ± 0.6 1.9 ± 0.7 1.5 ± 0.5
Riboflavin (mg) 1.3 2.3 ± 0.9 1.8 ± 0.6 2.0 ± 0.8 1.8 ± 0.7 2.2 ± 0.9 1.8 ± 0.7
Niacin (mg) 16 23.2 ± 8.6 20.1 ± 8.2 20.9 ± 6.9 20.1 ± 8.0 24.0 ± 8.8 20.4 ± 8.8
Folate (mcg) 400 455.4 ± 159.2 379.9 ± 127.7 429.8 ± 154.6 380.6 ± 135.0 451.8 ± 185.5 381.7 ± 131.6
Vit B6 (mg) 1.3 2.2 ± 0.8 1.9 ± 0.7 2.1 ± 0.7 1.9 ± 0.7 2.3 ± 0.9 1.9 ± 0.7
Vit B12 (ug) 2.4 6.2 ± 3.5 5.2 ± 2.5 5.5 ± 4.1 4.8 ± 2.6 7.2 ± 4.7 4.8 ± 2.4
Vit A (IU) 3000 10635.4 ± 7469.9 9236.0 ± 7295.7 10800.4 ± 5798.4 10102.6 ± 7233.9 10936.6 ± 5351.5 10872.7 ± 7952.8
Vit C (mg) 90 150.8 ± 78.6 110.0 ± 51.0 135.8 ± 67.6 109.0 ± 57.6 138.8 ± 74.6 101.0 ± 62.9
Vit D (IU) 200 226.2 ± 159.2 171.6 ± 120.2 195.7 ± 163.6 161.0 ± 116.2 236.1 ± 159.3 175.6 ± 112.0
Vit E (mg) 15 7.3 ± 5.0 6.1 ± 2.1 6.9 ± 4.9 6.1 ± 2.6 8.5 ± 6.6 5.9 ± 2.5
Vit K (ug) 120 115.4 ± 83.0 126.8 ± 110.0 166.3 ± 132.1 145.0 ± 127.5 169.7 ± 127.4 169.9 ± 125.2
Minerals
Sodium (mg) 1500 2647.2 ± 847.7 2548.4 ± 854.1 2447.2 ± 854.2 2410.3 ± 1012.4 2735.7 ± 894.2 2360.4 ± 836.4
Phosphorus (mg) 700 1437.8 ± 479.4 1265.1 ± 413.4 1317.8 ± 483.1 1224.4 ± 475.8 1408.9 ± 483.7 1248.8 ± 419.3
Calcium (mg) 1000 1098.4 ± 412.1 857.8 ± 350.1 950.3 ± 458.5 808.5 ± 364.4 960.4 ± 472.5 843.6 ± 337.9
Magnesium (mg) 400 317.1 ± 102.6 275.2 ± 87.0 307.9 ± 95.0 294.7 ± 113.7 325.5 ± 120.7 291.6 ± 100.2
Potassium (mg) 4700 3219.2 ± 970.1 2766.0 ± 973.2 3032.6 ± 803.0 2878.4 ± 1153.4 3252.3 ± 1157.9 2763.9 ± 925.1
Iron (mg) 8 18.1 ± 7.3 14.9 ± 5.9 15.9 ± 6.4 14.2 ± 5.3 18.1 ± 7.9 14.5 ± 5.9
Zinc (mg) 11 12.5 ± 5.9 10.7 ± 4.3 11.5 ± 4.9 11.2 ± 5.0 14.0 ± 6.2 11.1 ± 4.6
Antioxidants
Carotene (ug) 5131.5 ± 4368.4 4694.6 ± 4316.2 5553.4 ± 3492.5 5256.5 ± 4233.1 5526.6 ± 3143.8 5668.2 ± 4700.5
α-carotene (ug) 950.8 ± 1085.3 682.5 ± 755.4 832.3 ± 717.3 725.0 ± 900.1 729.2 ± 628.5 866.6 ± 1041.5
β-carotene (ug) 3558.7 ± 2761.9 3494.9 ± 3150.0 4123.3 ± 2583.2 4097.2 ± 3273.0 4400.1 ± 2549.4 4249.4 ± 3318.0
Cryptoxanthin (ug) 230.9 ± 176.1 129.9 ± 116.6 177.9 ± 173.0 148.6 ± 121.1 187.4 ± 152.9 117.9 ± 145.9
Lutein (ug) 1579.7 ± 1177.3 1501.8 ± 1446.2 2231.0 ± 2473.7 2023.6 ± 2272.2 2319.3 ± 2208.9 2276.5 ± 1879.5
Lycopene (ug) 9702.1 ± 5226.3 8896.4 ± 4937.5 7957.2 ± 5081.6 6811.3 ± 4195.0 7472.5 ± 4407.3 6148.7 ± 4066.7
*Recommended Dietary Allowance or Adequate Intake value for men age 19 - 30 years.
(b)
Source* 2001 2002 2003 2004 2005 2006
n = 30 n = 18 n = 31 n = 33 n = 45 n = 37
Vitamins
Thiamin (mg) 1.1 1.2 ± 0.5 1.3 ± 0.6 1.3 ± 0.5 1.4 ± 0.7 1.2 ± 0.4 1.1 ± 0.4
Riboflavin (mg) 1.1 1.5 ± 0.6 1.5 ± 0.8 1.7 ± 0.7 1.6 ± 0.9 1.6 ± 0.6 1.5 ± 0.6
Niacin (mg) 14 15.2 ± 8.0 16.3 ± 8.8 15.5 ± 6.6 16.5 ± 8.4 15.5 ± 6.6 14.9 ± 7.3
Folate (mcg) 400 331.5 ± 130.9 319.6 ± 163.4 346.9 ± 139.2 353.1 ± 194.2 338.2 ± 128.6 351.3 ± 143.2
Vit B6 (mg) 1.3 1.5 ± 0.5 1.6 ± 0.9 1.7 ± 0.7 1.6 ± 0.8 1.6 ± 0.6 1.5 ± 0.6
Vit B12 (ug) 2.4 4.6 ± 3.8 3.5 ± 2.9 4.3 ± 2.9 4.2 ± 3.2 3.4 ± 2.1 3.6 ± 2.6
Vit A (IU) 2333 9918.7 ± 9218.6 10970.4 ± 10798.7 12688.3 ± 9859.2 8479.7 ± 6009.8 12427.8 ± 8680.7 14097.3 ± 11057.7
Vit C (mg) 75 100.4 ± 51.3 102.9 ± 63.3 111.6 ± 46.2 103.3 ± 58.6 100.4 ± 52.6 94.7 ± 38.6
Vit D (IU) 200 139.6 ± 100.7 139.4 ± 94.9 165.9 ± 113.8 127.5 ± 95.2 154.7 ± 90.7 133.1 ± 130.3
Vit E (mg) 15 5.7 ± 2.4 5.4 ± 6.2 6.4 ± 5.2 7.1 ± 6.7 5.5 ± 2.8 5.3 ± 2.0
Vit K (ug) 90 123.6 ± 99.3 106.1 ± 77.9 171.6 ± 153.5 110.7 ± 91.6 194.3 ± 181.7 263.3 ± 277.0
Minerals
Sodium (mg) 1500 1839.5 ± 895.5 1725.1 ± 634.9 1921.2 ± 632.1 1985.0 ± 899.0 2004.2 ± 760.3 1897.6 ± 797.9
Phosphorus (mg) 700 983.6 ± 406.7 942.1 ± 294.8 1058.9 ± 353.7 998.4 ± 437.5 1036.7 ± 350.9 1036.6 ± 385.8
Calcium (mg) 1000 716.6 ± 311.2 700.1 ± 284.3 857.8 ± 320.2 724.6 ± 396.8 804.4 ± 319.3 784.5 ± 318.9
Magnesium (mg) 310 237.5 ± 99.7 213.6 ± 69.8 241.1 ± 69.1 227.6 ± 102.5 250.2 ± 85.9 268.8 ± 103.9
Potassium (mg) 4700 2350.4 ± 855.4 2215.3 ± 749.5 2495.6 ± 612.4 2244.3 ± 858.1 2450.0 ± 824.5 2476.1 ± 888.6
Iron (mg) 18 11.4 ± 4.9 12.3 ± 7.5 12.9 ± 5.9 13.1 ± 7.6 12.3 ± 5.6 11.4 ± 5.1
Zinc (mg) 8 8.2 ± 4.1 8.8 ± 5.3 9.0 ± 4.7 9.4 ± 5.8 8.9 ± 3.6 8.5 ± 3.7
Antioxidants
Carotene (ug) 5252.8 ± 5559.7 5889.4 ± 6167.1 6747.3 ± 5882.5 4326.8 ± 3536.8 6697.8 ± 5195.3 7784.9 ± 6658.7
α-carotene (ug) 933.7 ± 1285.5 1083.2 ± 1667.2 1247.8 ± 1399.1 742.9 ± 804.3 955.1 ± 958.0 1172.4 ± 1361.4
β-carotene (ug) 3648.6 ± 3546.3 4115.4 ± 3647.8 4671.7 ± 3971.7 3159.7 ± 2240.2 5128.2 ± 3987.8 5974.7 ± 4992.3
Cryptoxanthin (ug) 125.5 ± 112.4 141.6 ± 129.5 122.0 ± 102.0 122.0 ± 113.3 125.6 ± 130.6 86.2 ± 80.5
Lutein (ug) 1552.5 ± 1453.3 1467.5 ± 1366.6 2168.4 ± 2502.7 1411.7 ± 1448.0 2932.5 ± 3260.3 3934.2 ± 4599.6
Lycopene (ug) 6584.8 ± 6388.1 4064.8 ± 3339.9 5850.4 ± 3981.4 6145.7 ± 5059.1 5015.8 ± 3093.1 5797.7 ± 4864.8
*Recommended Dietary Allowance or Adequate Intake value for men age 19 - 30 years.
Values are means ± SD.
[21]. Moreover, using the FFQ allowed investigation of the absolute, unadjusted levels of micronutrient intakes, and thus, how much of each micronutrient subjects con-sumed (i.e., in milli- or micrograms). By doing so, com-parison to the Dietary Reference Intakes was performed, as opposed to assessing only percentages or percentiles of intakes [50]. The other strengths of this study are the consistency of data collection methodology over several
years and the assessment of important dietary factors that have not been previously reported in this population.
4. CONCLUSIONS
was that dietary intakes were especially low in male and female students for key nutrients related to maintaining health and preventing chronic disease, that is, folate, vi-tamin D, vivi-tamin E, calcium, magnesium, potassium and iron. Insufficient dietary intakes for these specific nutri-ents were consistent across all studnutri-ents in all years and lower than demographically-matched population-based data [51,52]. It is notable that only 25% of males and 22% of females reported consuming more than 2 serv-ings of fruits per day. Likewise, only 23% of males and 19% of females reported consuming 3 or more servings of milk and dairy products per day. Even with the in-creased number of daily vegetable servings observed in female cohorts across the six years, vegetable intakes did not meet most recent guidelines which suggest consum-ing twice as many vegetable servconsum-ings as previously rec-ommended to achieve adequate intakes of the variety of vitamins, minerals and other micronutrients necessary for maintaining health [44].
Inadequate or excessive intakes of micronutrients can lead to various disorders. For one example, vitamin D deficiency combined with inadequate calcium intakes predisposes persons to demineralization of the skeleton which leads to osteomalacia, bone loss, osteopenia and/ or osteoporosis [53]. In addition to bone health, vitamin D may also have a role in risk for certain types of cancer and type 2 diabetes. For another example, iron, folate and vitamin B12 cause varying forms of anemia [54]. While the occurrence of macrocytic anemia from folate or vitamin B12 deficiency is rarer than iron deficiency anemia, folate intake is also crucial for prevention of neural tube defects, a serious consideration for women of reproductive age, such as those studied herein. Other functions of suboptimal B vitamin intake, including the role on plasma homocysteine concentration and devel- opment of cardiovascular disease continue to be investi- gated. Moreover, inadequate micronutrient intake (ie, vitamin A, vitamin D, the B vitamins, calcium, iron and zinc) may be associated with increased adiposity, a major public health concern as obesity is epidemic worldwide [55].
The reasons for the micronutrient inadequacies identi-fied herein are likely multi-factorial and may include the significant time constraints inherent in the medical school environment [56], the high level of stress in that environment that has the potential to affect appetite and eating behaviors [57], financial considerations that may influence food purchasing patterns [58], as well as per-ceptions of body image that may limit the quantity of foods consumed [59]. Clearly, further investigation is war- ranted to elucidate the determinants of the dietary prac-tices of medical students, as well as other health care professionals.
Nevertheless, the findings from this study may be used
to design practical interventions for medical student populations to help them improve their dietary intakes, especially to improve the balance of micronutrients con- sumed, which may serve to reduce risk for development of chronic disease in these young adults. These data may also be used to enhance the nutrition education content of the medical school curriculum, possibly using publicly available tools such as those produced under the Nutri- tion Academic Award Program [17]. Ultimately, the goal is to stimulate greater awareness among medical students of their dietary intakes—not only to identify their per- sonal dietary imbalances, and thus, improve their food selection choices to better meet public dietary recom- mendations, but also to enhance their preparedness as future healthcare providers so they are better able to identify and meet the nutrition needs of their patients.
5. ACKNOWLEDGEMENTS
The authors thank Charles D. Keil and Jessica Landsgesell, RD for assistance with data analysis and manuscript preparation.
REFERENCES
[1] US Department of Health and Human Services.
http://health.gov/dietaryguidelines/2010.asp
[2] Frank, E., Galuska, D., Elon, L. and Wright, E. (2004) Per-
sonal and clinical exercise-related attitudes and behaviors
of freshmen US medical students. Research Quarterly for
Exercise & Sport, 75, 112-121.
[3] Frank, E. (2004) Physician health and patient care. The
Journal of the American Medical Association, 291, 637.
doi:10.1001/jama.291.5.637
[4] Frank, E., Rothenberg, R., Lewis, C. and Belodoff, B.F.
(2000) Correlates of physicians’ prevention-related prac- tices Findings from the Women Physicians’ Health Study.
Archives of Family Medicine, 9, 359-367. doi:10.1001/archfami.9.4.359
[5] Frank, E., Wright, E.H., Serdula, M.K., Elon, L.K. and Bald-
win, G. (2002) US women physicians’ personal and
clini-cal nutrition-related practices. The American Journal of
Clinical Nutrition, 75, 326-332.
[6] Spencer, E.H., Frank, E., Elon, L.K., Hertzberg, V.S., Ga-
luska, D. and Serdula, M.K. (2006) Predictors of nutrition counseling behaviors and attitudes among US medical students. The American Journal of Clinical Nutrition, 84, 655-662.
[7] Frank, E., Breyan, J. and Elon, L. (2000) Physician dis-
closure of healthy personal behaviors improves credibility and ability to motivate. Archives of Family Medicine, 9,
287-290. doi:10.1001/archfami.9.3.287
[8] Podell, R.N., Gary, L.R. and Keller, K. (1975) A profile
of clinical nutrition knowledge among physicians and medical students. Journal of Medical Education, 50, 888-
892.
students. Journal of Medical Education, 46, 86-90.
[10] Mlodinow, S.G. and Barrett-Connor, E. (1989) Physicians’
and medical students’ knowledge of nutrition. Academic
Medicine, 64, 105-106.
doi:10.1097/00001888-198902000-00017
[11] Davis, C.H. (1994) The report to Congress on the appro-
priate federal role in assuring access by medical students, residents, and practicing physicians to adequate training in nutrition. Public Health Report, 109, 824-826.
[12] Conroy, M.B., Delichatsios, H.K., Hafler, J.P. and Rigotti,
N.A. (2004) Impact of a preventive medicine and nutria-
tion curriculum for medical students. The American Jour-
nal of Preventive Medicine, 27, 77-80.
doi:10.1016/j.amepre.2004.03.009
[13] Talip, W.A., Steyn, N.P., Visser, M., Charlton, K.E. and
Temple, N. (2003) Development and validation of a know- ledge test for health professionals regarding lifestyle modi- fication. Nutrition, 19, 760-766.
doi:10.1016/S0899-9007(03)00101-1
[14] Frankle, R.T., Williams, E.R. and Christakis, G. (1972) Nu-
trition education in the medical school: Experience with
an elective course for first-year medical students. The
American Journal of Clinical Nutrition, 25, 709-719.
[15] Thomson, C.A., Taren, D., Koff, N., Marian, M., Canfield,
L., Bassford, T. and Ritenbaugh, C. (2000) An integrated
nutrition curriculum in medical education. Journal of
Cancer Education, 15, 127-129.
[16] Ammerman, A., McGaghie, W.C., Siscovick, D.S., Max-
well, K., Cogburn, W.E. and Simpson, R.J. Jr. (1989) Medi- cal students’ knowledge, attitudes, and behavior concern-
ing diet and heart disease. The American Journal of Pre-
ventive Medicine, 5, 271-278.
[17] Van Horn, L. (2006) The nutrition academic award: Brief
history, overview and legacy. The American Journal of
Clinical Nutrition, 83, 936S-40S.
[18] Wong, V., Millen, B.E., Geller, A.C., Rogers, A.E., Maury,
J.J. and Prout, M.N. (2004) What’s in store for medical students? Awareness and utilization of expert nutrition
guidelines among medical school preceptors. Preventive
Medicine, 239, 753-759.
doi:10.1016/j.ypmed.2004.02.046
[19] Mellen, P.B., Palla, S.L., Goff, D.C. Jr. and Bonds, D.E.
(2000) Prevalence of nutrition and exercise counseling for patients with hypertension. United States, 1999 to 2000.
Journal of General Internal Medicine, 19, 917-924.
doi:10.1111/j.1525-1497.2004.30355.x
[20] Heimburger, D.C., Ullmann, D.O., Ramsey, M.J., Woold-
ridge, N.H., Epps, L.A., Hardin, J.M. and Hsu, C. (1994) Dietary habits of first-year medical students assessed dur- ing clinical nutrition course. Nutrition, 10, 214-220.
[21] Banks, W.L. Jr., Chan, W.M. and Williams, W.L. (1989) Use
of food frequency questionnaire results to emphasize nutri-tional concepts for first year medical students—Medical
College of Virginia. Bulletin of the New York Academy of
Medicine, 65, 928-934.
[22] Spencer, E.H., Elon, L.K., Hertzberg, V.S., Stein, A.D.
and Frank, E. (2005) Validation of a brief diet survey in-
strument among medical students. Journal of the Ameri-
can Dietetic Association, 105, 802-806.
doi:10.1016/j.jada.2005.02.003
[23] US Department of Health and Human Services (2010)
Dietary Guidelines for Americans. Office of Disease Pre- vention and Health Promotion.
http://health.gov/dietaryguidelines/2010.asp
[24] Holick, M.F. (2004) Vitamin D: Importance in the pre-
vention of cancers, type 1 diabetes, heart disease, and os-
teoporosis. The American Journal of Clinical Nutrition,
79, 362-371.
[25] Bakhireva, L.N., Barrett-Connor, E., Kritz-Silverstein, D.
and Morton, D.J. (2004) Modifiable predictors of bone
loss in older men: A prospective study. The American
Journal of Preventive Medicine, 6, 436-442.
doi:10.1016/j.amepre.2004.02.013
[26] Centers for Disease Control and Prevention (1991) Use of
folic acid for prevention of spina bifida and other neural
tube defects: 1983-1991. Morbidity and Mortality Weekly
Report, 30, 513-516.
[27] Blot, I., Papiernik, E., Kaltwasser, J.P., Werner, E. and
Tchernia, G. (1981) Influence of routine administration of
folic acid and iron during pregnancy. Gynecologic and
Obstetric Investigation, 6, 294-304.
doi:10.1159/000299659
[28] Krishna, G.G. and Kapoor, S.C. (1991) Potassium deple-
tion exacerbates essential hypertension. Annals of Inter-
nal Medicine, 115, 77-83.
[29] Coruzzi, P., Brambilla, L., Brambilla, V., et al. (2001)
Potassium depletion and salt sensitivity in essential hy-
pertension. The Journal of Clinical Endocrinology &
Metabolism, 86, 2857-2562. doi:10.1210/jc.86.6.2857
[30] Sommer, A. and West, K.P. Jr. (1996) Vitamin A defi-
ciency: Health, survival and vision. Oxford University Press, New York.
[31] Dawson, H.D. and Ross, A.C. (1999) Chronic marginal
vitamin A status effects the distribution and function of T
cells and natural T cells in aging Lewis rats. Journal of
Nutrition, 129, 1782-1790.
[32] Stephensen, C.B. (2001) Vitamin A, infection and immune
function. The Annual Review of Nutrition, 21, 167-192.
doi:10.1146/annurev.nutr.21.1.167
[33] Mocchegiani, E., Giacconi, R., Muzzioli, M. and Cipriano,
C. (2000) Zinc, infections and immunosenescence. Mech-
anisms of Ageing and Development, 121, 21-35.
doi:10.1016/S0047-6374(00)00194-9
[34] Wintergerst, E.S., Maggini, S. and Hornig, D.H. (2006)
Immune-enhancing role of vitamin C and zinc and effect
on clinical condition. Annals of Nutrition and Metabolism,
50, 85-94. doi:10.1159/000090495
[35] Selhub, J., Jacques, P.F., Wilson, P.W., Rush, D. and Ro-
senberg, I.H. (1993) Vitamin status and intake as primary determinants of homocysteinemia in an elderly popula-
tion. The Journal of the American Medical Association,
270, 2693-2698.
doi:10.1001/jama.1993.03510220049033
[36] Ali, M.M. and Vaidya, R.R. (2007) Vitamin D and cancer.
Journal of Cancer Research, 4, 225-230.
[37] White, E., Shannon, J.S. and Patterson, R.E. (1997) Re- lationship between vitamin and calcium supplement use
and colon cancer. Cancer Epidemiology, Biomarkers &
Prevention, 6, 769-774.
[38] Kampman, E., Slattery, M.L., Caan, B. and Potter, J.D.
(2000) Calcium, vitamin D, sunshine exposure, dairy
products and colon cancer risk (United States). Cancer
Causes Control, 11, 459-466.
doi:10.1023/A:1008914108739
[39] Block, G., Hartman, A.M. and Naughton, D. (1990) A re-
duced dietary questionnaire: Development and validation.
Epidemiology, 1, 58-64.
doi:10.1097/00001648-199001000-00013
[40] United States Department of Agriculture (2000) Agricul-
tural Research Service. Nutrient Data Laboratory. http://www.ars.usda.gov/nutrientdata/
[41] Institute of Medicine (2005) Food and Nutrition Board.
The dietary reference intakes for energy, carbohydrates, fiber, fat, protein and amino acids (macronutrients). Na- tional Academies Press, Washington DC.
[42] Institute of Medicine (2000) Food and Nutrition Board.
Dietary reference intakes: Applications in dietary assess-ment. National Academies Press, Washington DC.
[43] United States Department of Agriculture.
http://www.mypyramid.gov/
[44] Britten, P., Marcoe, K., Yamini, S. and Davis, C. (2006)
Development of food intake patterns for the MyPyramid
food guidance system, Journal of Nutrition Education
and Behavior, 38, S78-S92.
doi:10.1016/j.jneb.2006.08.007
[45] Mitchell, D.C., Frank, L.R., Hartman, T.J. and Curran,
J.M. (2009) Consumption of dry beans, peas, and lentils
could improve diet quality in the US population. Journal
of the American Dietetic Association, 109, 909-913. doi:10.1016/j.jada.2009.02.029
[46] American Dietetic Association (2000) Position of the
American Dietetic Association: Fortification and
nutria-tional supplements. Journal of the American Dietetic As-
sociation, 105, 1300-1311.
[47] Spencer, E.H., Bendich, A. and Frank, E. (2006) Vitamin
and mineral supplement use among US medical students:
A longitudinal study. Journal of the American Dietetic
Association, 106, 1975-1983.
doi:10.1016/j.jada.2006.09.003
[48] Frank, E., Carrera, J.S., Elon, L. and Herzberg, V.S. (2006) Basic demographics, health practices, and health status of
US medical students. The American Journal of Preventive
Medicine, 31, 499-505. doi:10.1016/j.amepre.2006.08.009 [49] Subar, A.F., Kipnis, V., Troiano, R.P., et al. (2003) Using intake biomarkers to evaluate the extent of dietary mis- reporting in a large sample of adults: The OPEN study.
American Journal of Epidemiology, 158, 1-13.
doi:10.1093/aje/kwg092
[50] Block, G. (2000) Invited commentary: Another perspec-
tive on food frequency questionnaires. American Journal
of Epidemiology, 154, 1103-1104.
doi:10.1093/aje/154.12.1103
[51] Wakimoto, P. and Block, G. (2001) Dietary intake, dietary
patterns, and changes with age: An epidemiological per- spective. The Journals of Gerontology: Series A, 56, 65-
80.
[52] US Department of Agriculture and US Department of
Health and Human Services (2000) What we eat in Amer-
ica, NHANES 2007-2008.
[53] Chung, M., Balk, E.M., Brendel, M., Ip, S., Lau, J., Lee, J.,
et al. (2009) Vitamin D and calcium: Systematic review of health outcomes. Agency for Healthcare Research and Quality, Rockville.
[54] Selhub, J. and Paul, L. (2011) Folic acid fortification:
Why not vitamin B12 also? Biofactors, 37, 269-271.
doi:10.1002/biof.173
[55] Garcia, O.P., Long, K.Z. and Rosado, J.L. (2009) Impact
of micronutrient deficiencies on obesity. Nutrition Re-
views, 67, 559-572.
doi:10.1111/j.1753-4887.2009.00228.x
[56] Mothersbaugh, D.L., Hermann, R.O. and Warland, RH.
(1993) Perceived time pressure and recommended dietary practices: The moderating effect of knowledge of nutri- tion. Journal of Consumer Affairs, 27, 106-126.
doi:10.1111/j.1745-6606.1993.tb00740.x
[57] Dyrbye, L.N., Thomas, M.R. and Shanafelt, T.D. (2006)
Systematic review of depression, anxiety, and other indi- cators of psychological distress among US and Canadian medical students. Academic Medicine, 81, 354-373.
doi:10.1097/00001888-200604000-00009
[58] Drewnowski, A. and Darmon, N. (2005) Food choices and
diet costs: An economic analysis. Journal of Nutrition,
135, 900-904.
[59] Futch, L.S., Wingard, D.L. and Felice, M.E. (1988)
Eat-ing pattern disturbances among women medical and grad- uate students. Journal of Adolescent Health, 9, 378-383.