RESEARCH ARTICLE
BUDGETING AND THE INCLUSIVE ECONOMIC GROWTH
*Surinder Singh Parihar
Department of Economics, Govt. Degree College Bhaderwah, Jammu and Kashmir, India
ARTICLE INFO ABSTRACT
The world is divided into two categories where majority have to walk miles for the meal and few walk to digest the meal. Among the former category are the third world countries especially from Asia, Africa and L.America which came out of colonial clutches in 1950s.Since 1950s these countries have embarked on the tempo of the development. India is one among them which can be called divided India with 70% poor and 30% non-poor at 2$ poverty line, so Public-Private-Foreign Collaboration (PPFC) model should work just not only for the short term profits but for improving the living standards of these 70% consumers to ensure sustainable demand in the future .As the WDR 2013 calls for jobs provisioning to escape the poverty, such type of jobs which ensure freedom to exit the poverty. In India we have five year plans which are divided into the annual plans reflected through budgets. Thus budgeting has an important role in the planning to meet the objectives and targets set by the
planning authority. It is now the 12FYP which started on 1st April 2012 and will end on 31st march 2017. Since the
11FYP the Govt. Of India (GOI) is having turned the attention of the common masses towards the inclusive
economic growth i.e. the growth with human face to ensure the sustainability in the economy. The budget reflects the behaviour of the fiscal policy so has much to do with the inclusive growth. The underlying assumption beyond the present study is that economic planning facilitates the inclusive growth. The objectives of the area(I) to assess the impact of the budget on the poverty, unemployment and the inequities(II)to measure the indicators of the inclusive growth and(III) to find the loopholes and their corrective measures. The methodology used is Time Series Analysis based on secondary data and the use of graphs, tables and diagrams has been made for precision and attractiveness for different periods of time. The sources of the data are the budgets, the Economic Surveys, the
WB, the IMF and other online or printed sources. The present study has been divided into five section as 1st
section introduces the problem,2nd deals with meaning and the concept , indicators and strategies for inclusive
growth,3rd with the budgeting process,4th with data analysis and findings ,5th and the final section is the conclusive
part.
Copyright, IJCR, 2013, Academic Journals. All rights reserved.
INTRODUCTION
India claiming to be a super power by 2020 is still even after six decades of independence is a nation of super unemployment, inequities and poverty. Every year we bring dream budgets but with little success to reach the so called disadvantaged sections. What is budget? Budget is the annual financial statement that shows the income and outgo of the public authorities be they are Centre Govt., State govts, or the Local govts. including rural and urban govt. That is the budget tells from where money comes and where it goes. The objective is to ensure the efficient allocation of the resources, growth with stability and the distributive justice so that the benefits of the grow down to the bottom pyramid of the population, thus including the excluded sections of the society. The process of the budget involves three stages i.e. enactment, execution and implementation. The exercise begins as the Ministry of the Finance issues the four
column skeleton form to all the departmental heads .The 1st column is
for actual figures of the previous year, 2nd for the budget estimates for
the current year, 3rd for the revised estimates and the 4th for the
estimates for the coming year. The heads get the figures filled and the completed forms are send to the finance ministry for consolidation and compilation and thus the final budget draft is prepared with the help of other ministries. The budget has has two parts i.e. the revenue part and the capital part as e.g. for the fiscal 2013-14 shown in the Table1.1: Once the Budget is ready, it is presented by the Finance Minister in the Loksabha (Council of the people) on the day called the Budget Day usually the last day of the the February at fixed hours i.e. 11a.m. In Rajya Sabha (council of the states), the Budget is presented by the junior Finance Minister. The budget speech is divided into the
*Corresponding author: pariharsurinder@gmail.com
two parts. The first part is overview of the the economy in the current year and the Money or the Appropriation Bill which reflects the Budget estimates and authorises the governments to spend out of the CFI (Consolidated Fund of India). There are votable items as demands from ministries and non-votable items salaries of the President, the Speaker, the Chairman and the Judges including debt charges etc. The budget is discussed in detail and then the Money Bill
is passed. The 2nd part is the Finance Bill which authorises the
government to raise resources to finance the expenditure and are credited to the CFI, for emergency there is CFI (Contingency Fund of India) at the disposal of the President of India. When both the Bills are passed the budget is said to be passed. Then it is send to Rajya Sabha for recommendation to be returned after 14 days. Finally the budget is send to the President for the ascent who usually gives as ascent because having limited powers. Next comes the execution part which is the responsibility of the Executive i.e. from the President to the peon.
Rupees Comes From
Pie-Chart1.1. The chart reflects that tax receipts share 9%, non-debt capital receipts 4%, borrowing and other liabilities 27%, corporate tax 21%, income tax 12%, custom duties 9%, union excise duty 10%, service tax and other receipts share in total receipts for 2013-14 is 9%.
And Rupee Goes To
Pie-Chart1.2: The chart reflects that 17% of budget expenditure goers for states share of taxes and duties, 4% to states/union territories as non-pan assistance, 7% as plan assistance to Gs/UTs, 21% to central
ISSN: 0975-833X
International Journal of Current Research
Vol. 5, Issue, 05, pp.1159-1164, May,2013
INTERNATIONAL JOURNAL
OF CURRENT RESEARCH
Article History:
Received 28th February, 2013
Received in revised form
11th March, 2013
Accepted 20th April, 2013
Published online 12th May, 2013
Key words: Budget,
Inclusive Economic Growth, Third World,
Source:-India Today
Source:-India Today
plan, 18% to interest payments,10% for defence, 12% for subsidies, and 11% for other non-pan expenditure in 2013-14 Budget. Thus more than 55% goes for non-plan or unproductive purpose and rest for plan purpose.
Meaning and Concept
Distributional and beneficial effects of economic growth can be traced to Sir Smith, Ricardo, Marshall, and Keynes and K.Marx. Till 1950s economic growth and development were taken as synonymous, but Prof. Jacob Viner voiced for distinction .However his voice could not get recognition till 1970s when Sir Paul Streeten raised three questions in regard to economic development i.e. what is happening to the poverty? What is happening to the unemployment? and what is happening to the inequities? Thus growth started to be seen as a quantitative concept and development as a qualitative concept and the two became distinguished even though GDP growth is a pre-condition for development in the economy. In 1980s Brunt land Commission
brought the concept of Sustainable Development i.e. development without destruction. In India on the basis of socialist pattern of development started the 1stFYP with the focus on agriculture, food
security, rehabilitation, 2nd plan focussed mainly on industrialisation,
3rd plan on the Green Revolution, 4th plan on the the self reliance, 5th
on poverty, unemployment and inequities, 6th on agriculture, 7th on
modernisation ,8th, 9th,10th on Economic reforms and the 11thand 12th
plans continued reforms as the objective but 11th gave more focus to
the inclusive growth and the 12th plan has kept focus on faster and
more inclusive growth. Thus the inclusive growth was implicit in the
planning process since 5th plan onwards. Now it is the major target so
that the poor, downtrodden, landless, Schedule Castes (SCs)/Schedule Tribes (STs)/Other Backward Classes (OBCs), marginalised, neglected, disadvantaged and other excluded sections of the society share the benefits of the growth and development. Thus inclusive growth of the economy takes care of all those sections of the society who are at the bottom of the pyramid. This pyramid suffers from access to food, clothing, shelter, drinking water, milk, medicines, education, job markets, income opportunities, financial system, landed assets, information. This group needs to be the stake holder in the growth process. In simple words growth in inclusive when it caters needs of not only the rich and middle classes of the society but also the low and under privileged classes.
Indicators of Inclusive Economic Growth
The various indicators to measure the inclusive growth could be listed as shown in the Table below:
Strategies to Make Growth Inclusive
The following programmes have been launched from time to time by the GOI to ensure the inclusive growth in the country. They are
Swaranjyanti Gram Swarozgar Yojna:-SGSY was launched on 1st
april, 1999 by integrating IRDP, DWCRA, Ganga Kalyan Yojana (1997), MWS (1989), SITRA (supply of improved tool-kits to rural artisans-1992), to benefit the excluded sections aiming at covering 50% SC/STs, 40%, women and 3% disable groups of the all beneficiaries at least.
Pradhan Mantri Gramodaya Yojana: PMGY was started in
2000-01 having two components as PMGSY (25 DEC., 2004) and PMGY (april1, 2000) like IAY, to take care of pry. Health, pry. Education, rural roads, housing and drinking water in rural areas.
Bharat Nirman Yojana: This was launched in on Dec., 16, 2005 to
take care of rural development by provisioning irrigation, all weather
roads, housing, drinking water, electrification and rural
[image:2.595.84.513.71.225.2]communication.
Table 1.1. Budget 2013-14 Rs in lac Cr.
S.No Heads Actual for
2011-12
Budget Estimates for 2012-13
Revised Estimates for 2012-13
Budget Estimates for 2013-14
1 Revenue Budget
A Revenue Expdt. 8.91 9.69 10.01 11.09
B Revenue Receipts 7.51 9.35 8.71 10.56
2 Capital Budget
A Capital Expenditure 4.12 5.21 4.29 5.55
B Capital Receipts:
a. Loan recoveries
b.Market borrowings and other liabilities c.Disinvestment Receipts
5.52 5.55 5.58 6.09
3 Budget Receipts 13.04 14.90 14.30 16.65
4 Budget Expenditure 13.04 14.90 14.30 16.65
5 Rev. Deficit(1a-1b) 3.94 3.50 3.91 3.80
6 Fiscal Deficit(3+2b) 5.16 5.13 5.21 5.42
7 Primary Deficit 2.42 1.93 2.04 1.71
Swaranjayanti Shary Rozgar Yojna: SJSRY was launched in Dec. 1997 by integrating NRY, UBSP and PMIUPEP (Prime Minister
Integrated Urban Poverty Eradication Programme).
Antodaya Anna Yojana: AAY was launched on 19 March, 1999 to
provide food grains to the BPL sections. It provides 35kr of rice and wheat at Rs2/kg.
Prime Minister Rozgar Yojna: PMRY was started on 2nd Oct., 1993
for urban self employment by providing the loans.
Sarva Shiksha Abhiyan: SSA was launched in 2001 subsuming
Operation Black Board (1987).
NREGS: This scheme is a milestone since 2nd Feb, 2006 by replacing
EAS (SGRY+NFFWP) and JGSY(Jawahar Gram Samridhi Yojana). This scheme is now called MNREGA and guarantees 100 days of employment, failing which there is provision of daily unemployment allowance (DUA).
Aam Aadmi Bima Yojana (Common Man Insurance Policy: This
policy was launched for the insurance of the rural landless people since Dec. 2012 has been merged with Jan shree Bima Yojana.
Swabhiman: A vast banking project has been started for extending
banking facilities to unbanked rural area.
Budgeting For the Inclusive Growth: The 11th FYP budgeting for
the inclusive growth was as shown in the Table 1.3
However in the 12th FYP, the Budget 2013-14 has caused a serious
tragedy which will keep the inclusive growth in doldrums as the Finance Minister has increased the plan assistance to states and union territories by just 4.6%, IAY BY 37.1%, roads and bridges nil, SAP BY 13.8%, RKVY BY 7.8%, SSA by 6.8% which mean cuts if inflation is accounted and further there has been cut in AIBS BY 9%, BRGF (Backward Region Grant Fund) by 4.5% and PMGSY by 21.3% over the Budget 2012- 13.
Data Trends, Analysis and Findings
- Bar Chart1.1a: GDP Performance
[image:3.595.308.560.186.335.2]Source: An approach to 12FYP and Economic Survey 2012-13(TRGT. and ACTL. G. Rates in %)
Table 1.2. Indicators of Inclusive Growth
High Real GDP growth rate Equal distribution of purchasing power
Right to own minimum assets Access to education, skills & training
Right to job guarantee Right to good housing
Adequate availability of land per capita Right to food guarantee
Access to safe drinking water Right to healthy life
Access to milk &fruits Low IMR & MMR
Right to vote with right to reject Right to information
High life expectancy Access to credit facility
Cultural & religious freedom Low interest rates
Time bound delivery of basic services Well road, rail and air connectivity
Freedom to exit poverty Access to LPG , kerosene oil for cooking at affordable prices
Low level of unemployment High HDI value
Low & affordable prices Low poverty level
High value of gender HDI Access to pollution free environment
Low rural-urban gap in terms of development No gender disparities
Dignity of life No digital divide
Insurance cover for the poor against various risks Free access to judicial system
Right to secured life Right to participate in political & economic decisions
Percentage of women in economic activities Percentage of SC/STs/OBCs /Minorities/Landless in Economic Activities
[image:3.595.65.531.386.600.2]Low under5 IMR Low Gini Coefficient
Table 1.3. Rs in Cr.
S.NO Programme Ministry 2007-08 Actual Expndt. 2011-12 BE 11TH FYP Total
01 MNREGA Rural Development 12661 40,000 156,301
02 IAY Rural Development 3886 10000 41481
03 NSAP Rural Development 3104 6158 23536
04 PMGSY Rural Development 6500 20000 65002
05 NRHM Health &Family Welfare 10509 18115 69224
06 ICDS Women &Child Development 5,193 10000 38980
07 MDM School Education and Literacy 5832 10380 38602
08 SSA School Education Literacy 11477 21000 77,576
09 JNNURM Urban Development 5508 13700 48085
10 AIBP AIBP& Other water resources 5446 12650 46622
11 RGGVY Power 3913 6000 25,913
12 RGDWM NRDWP and TSC, Drinking Water Supply 7320 11,000 46722
13 Rashtriya Krishi Vikas Yojana Agriculture & Cooperation 1200 7811 18550
G. Total 81817 1,86,539 691,976
Bar-chart1.1b: Status of inclusive
growth:-Source:-HDR 2013
Pie-Chart1.3: Tax structure:-
Source:-India Today
Pie-Chart 1.4: Tax Str. in 2011-12
[image:4.595.31.561.50.243.2]Source:-India Today
Table 1.5. Inflation: Consumer Price Index and Wholesale Price Index
year CPI WPI
2007-08 6.2 4.7
2008-09 9.1 8.1
2009-10 12.4 3.8
2010-11 10.4 9.6
2011-12 8.4 8.9
2012-13 10 7.6
Source: India Today,dtd 11th March,2013
Bar Chart 1.2 Inflation: Consumer Price Index and Wholesale Price Index
Source:- India Today, dated 11 March, 2013
Bar Chart 1.3: Unemployment Measures for 2009-10:
Source:-http://pib.nic.in
Pie-Chart1.5: Poverty level at 1.25$:
Source:- .http://povertydata.worldbank.org/poverty/home
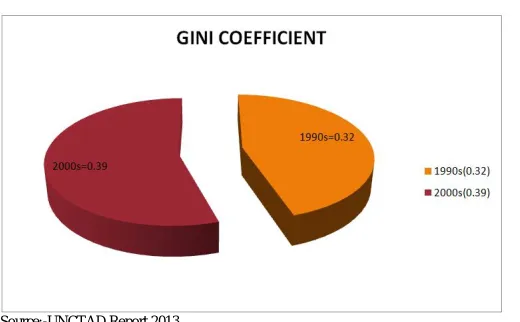
Chart1.6: Poverty at 2$:-
Chart1.7: Inequities in India: Gini’s Coefficient increased in 2000s:
Source:-UNCTAD Report 2013
From data it appears that
The GDP Figures in bar-chart 1.1(a) as TGRs and AGRs show
fluctuating GDP growth rates and below targets. According to the World Bank, India’s population went from 70 crore to 124crore from 1980 t0 2011 and that of China from 90crore to 134cr. In the same period but poverty at 2$ fell from 84.6 % (1990) to 29.8% in 2008 but in India it fell from 81.7% to 68.7% just as reflected in Pie-chart 1.6. Further India’s share in the world’s population is 17.7% but share in world GDP is just 2.57% in 2011, for China same Figures are 19.2% and 10.4%. Financial crisis, Euro zone melt down and near global recession like condition could not impact China her GDP is better and its defence budget for the fiscal 2013-14 went to 5.4% but in India it is 1.79% of GDP, Investment has fallen to 34.7% in 2011-12 from 38.1% in 2007-08. GDP growth rate is fluctuating in India over the years as reflected in the Bar chart 1.1(a) showings target failures. Even though growth not considered an important indicator of economic development, still it is a necessary condition for the the economy to move and progress ahead. Govt is perusing economic reforms in haste by cutting subsidies, capping access to subsidised cooking gas, permitting FDI in the retail sector and other cuts in the social spending which directly indirectly will cause serious negative impact on the inclusive growth. Agriculture sector has been neglected, industry is sluggish and the service sector growth is mainly determined by the global demand, so economy has come down to the 5% for 2011-12 from 7-8% in 1990s and 2000s.
The current status of inclusive growth in India is not
encouraging as reflected in bar-chart1.1b. HDI value is just
0.554 putting India at 136th rank in HDI. Further the
opportunities to acquire knowledge and real GDP per capita are also low when compared to developed economies like the USA and even when compared to developing economies like China.
GDP growth is jobless because of capital intensities so poverty
[image:5.595.38.298.66.227.2]and inequities are not falling in India as Gini Coefficient is up from 0.32 in 1990s to 0.39 in 2012 according to UNCTAD (United Nations Conference on Trade and Development) Report 2013 as reflected in Pie chart1.7. According to International Labour Organisation’s (ILO) latest estimates 910mn people employed globally are living at less than 2$, of them 63.7% live in Africa and 54.2% in Asia. In India at present 3.3% of the labour force is unemployed i.e. very low rate by glimpse at this figure but actually poor are 70% or even more at 2$ international poverty line. The gaps between poverty and employment figures reflect the reality that people are in jobs either in formal or informal sectors but without the right to escape the poverty. The working population in India is 63.5% in the age group 15-59 years and the actual labour force is 487mn which constitutes 39% of the population according to Census 2011. The unemployment figures on UPS, UPSS, and CDS and CDS have been depicted by bar- chart 1.3.
Poverty, unemployment and inequities, inflation are worst
ruining the lives of the neglected and disadvantaged groups of the population.
Inflation is not falling and thus making it difficult to meet food,
water, shelter, healthcare and educational needs. There by preventing the birth rate, IMR, MMR to fall and productivity to rise. Even though the tax structure has become progressive, as shown in Pie-charts 1.1 and 1.2 but benefits of this have been nullified by the double digit prices in February 2013 on annual basis prices of cereals shot up to 17.04%, pulses to 12.39%, oil and fats to 14.56%, fish and meat to 15.72%, milk to 8.06%, spices 4.94%, vegetables 21.29%, fruits 10% and sugar gone to 12.10%. The govt. is financing the pro- inclusive growth schemes, but the Non Plan Expenditure is 55%, which constrains the budget for the social spending. Not only is this major chunk of allocated funds siphoned off to personal pockets. In the year 2011-12 total allocation for inclusive growth schemes was 2lac
Crore and for the 11th FYP it was 7lac crore.
Problems and Suggestive Measures
Now where the problem lies is a big question? This because of huge budgeting, strategies and programmes, outcomes is still poor, why? These un for fortunate outcomes are inevitable because of various reasons which include historical, political, social, cultural, religious, technological, financial, informational, spiritual and moral, educational. The historical because of colonial bleedings, political because of vote bank politics, social because of social inequities, cultural because of traditional values , norms, religious because of restrictiveness attitudes towards development, technological because of low innovative capacity, financial because of exclusion from finance, informational because of ignorance, spitual and moral because of deficit in this area, educational because of deprivation. So can we put the things in reverse order? If yes growth will become inclusive, if not the growth will remain exclusive and real progress on poverty, unemployment, inequities and values of HDI, HPI, GEM, and PQLI would not take place. Thus the integrated three pronged strategy can be adopted to make the growth more inclusive:-
First Things First
Willing or non willingly we have to provide the first things first and they include food security in terms of availability, access, affordability, housing infrastructure, water infrastructure, knowledge infrastructure, agrigarion reforms in terms of distribution, inputs, marketing for produce, insurance cover against risks, develop and nurse small and medium enterprises, conditional subsidies e.g. subsidy if children are given education, access to information, access to finance through mobile banking, catering urban infrastructure problems, ensure people participation in development, empowering women and girl child, improving basic services delivery mechanism
by ensuring corruption free governance.
Strenthening the Manufacturing base
According to the World Bank, it was the industrial revolution and the technological advances in agriculture that helped to cut the people at less than1$ from 75% in1820 to 22% to in 2011 in world. Thus in India the need is to inflate the farm income, diversify and strengthen the manufacturing base, meet the infrastructure deficit, boost the exports, tourism but first the basic needs approach needs to be followed. As if the labour force of the country is healthy, knowledgeable, well off, skilled trained, it will be more productive and will help to the economy to progress and prosper and thereby benefits would flow down to the bottom of the economy.
Prudencial Norms for Accountability
Newspapers, on TV, internet etc are reflecting malpractices both in the public and the private sector, hence the prudential norms and criteria needs to be developed to ensure the discipline at the Local Govt. Level. The Direct Cash Transfer scheme is one of the ways. The other option can be field based performance indicators and progress on such indicators, feedback from beneficiaries, online confidential feedback, beneficiary care cells to redress the problems and complaints, village and town level computer kiosks with internet facility to get the information on different schemes and their benefits, information on agriculture, employment, filing complaints online, displays of telephone numbers and email addresses of Authorities tackling complaints rural urban areas in bold letters and numerics, ads and campaigns in media for complaints against corrupt and errant officials. It would be better to cut some non-pan expenditure and invest for prudency to give a sigh of relief to the common masses who suffer for a months together just to get a certificate or two, a relief to the poor and down trodden who work but find their wages dirverted to Meany pockets, a sigh of relief to those who are brow beaten and dealt inhumanly by those in power.
Conclusion
Thus what type of budgeting we need for economic growth of the country that can ensure the faster and inclusive growth that the 12thFYP intends is a matter of policy making and it requires a greater insight and huge exercise to think over which path will take us to a high trajectory ensures first things first, the globalisation without reins, allowing Multinational Corporations (MNCs) to capture the big market through Foreign Direct Investment(FDI) route, throughing open the service sector, cutting the subsidies on agriculture and K. oil, gas etc or alternatively strengthen the domestic agriculture sector, making the country as industrial and manufacturing hub and thus streamlining the globalisation. As continue bleedings in euro zone is the result of blindly followed globalisation, slowdown in Indian GDP to 5% in fiscal 2011-12 is again the result of fall in external demand due to euro zone crises. At least we have to find the hedge, otherwise the unrestricted forces of globalisation would engulf us, this is they want. No force can stop us to become a super power provided that we could use the democracy and democratic dividend in a right way and find hedge for the economy. We have to turn the globalisation to work for the inclusive growth and our budget policy needs to be consistent and clear here rather than turning ourselves toward where globalisation directs us.
If the developed economies like the USA, the UK, the Germany are protecting their self interests by giving protection through visa cuts, subsidies to farmers through green boxes, banning out sourcing etc, then why we are so crazy to bring the Wal-Mart to India to develop the cold food stores and benefit the farmers. Is it going to happen? Will they (MNCs) not operate under excess capacity models and keep prices high? Then who will be benefitted. Or they will open franchisee and work on commission basis, again drain of wealth? Where are Reliance fresh stores and Subiksha Mobile stores today? So the poor and down trodden can’t hope anything. Further if the things are not corrected now, allow the markets to rule the economy, replication of euro crisis in India would be the eventual outcome. Thus we need to think on different lines, undertake research, deep insights so meet the needs of inclusive growth model to take country in the Super power club rather than wait for the crises to come.
REFERENCES
a. BOOKS:
i. Misra and Pure, Indian Economy ii. M.P, Todaro, Economic Development iii. Tyagi, B.P, Public Finance
iv. Musgrave.R, Public Finance
v. Mishra and Puri, Economic Development and planning b. E.BOOKS:
i. Swaminathan, M., India Superpower: Fiction or Future, 2009 ii.en-wikipedia.org./wiki. Aam-Aadmi
ii. en-wikipedia.org./wiki/poverty-reduction c. websites:
i.www.winentrance.com/../important-antipoverty-employment-generation.html
ii.www.onemint.com/.../India’s-unemployment-rate-standsat-9-4. iii. http://povertydata.worldbank.org/poverty/home
iv. http://pib.nic.in
v.www.igidr.ac.in/conf./ysp/MP.ppt. vi. http://indiabudget.nic.in
vi. maps.napc.gov.ph/.../National. Antipoverty-programmes part? d. journals/magazines:
i. India Today, dtd 11th March,2013
ii.www.epw.in/.../understanding-poverty-and-inequality-in-u f. Newspapers:
i. Times of India Dtd.07 Dec, 2011
ii. Business Standard Dated. 06and 19 March, 2013 iii. Deccan Chronicle Dated. 06 March, 2013 iv. Times of India dated 13and19 March, 2013