© 2019, IRJET | Impact Factor value: 7.211 | ISO 9001:2008 Certified Journal | Page 3488
NON-LINEAR CONTACT ANALYSIS AND DESIGN OPTIMISATION OF
LOAD CELL FOR HIGH CAPACITY APPLICATIONS BY FINITE ELEMENT
METHODS
NEHA NANDIKOL
1, Pro. S.S. CHAPPAR
21
PG student, Department of Mechanical engineering, BLDEA’s V P Dr. P G H CET VIJAYAPURA, KARNATAKA, INDIA.
2
Professor, Department of Mechanical engineering, BLDEA’s V P Dr. P G H CET VIJAYAPURA, KARNATAKA, INDIA.
---***---Abstract –
In the existing design of 600ton capacitycompression type load cell the stresses induced when the maximum load is applied on the load-cell is exceeding the allowable stress. The hollow section of the load cell where the Strain Gauges (sensing elements) are placed, the stress level is not within the desirable range, Hence, there is a scope for evolution of new design. The Finite Element Method is used to determine the stresses developed in the load cell. The analytical work consisted of Finite Element Analysis (FEA) of the load cell to make design modifications and optimize the design. Linear Static Finite Element Analysis of the load cell is conducted to obtain the stresses induced in the Load-cell model and the area of interest being the hollow section of the load cell where the Strain Gauges (sensing elements) are placed, design modifications are made to get the desired stress levels at this region. The results of the FEA are then compared with the theoretical results and the performance characteristics of the load cell such as Linearity plots are plotted. The general-purpose Finite Element analysis software MSC. Nastran, MSC PATRAN and are used for this project.
Key Words: Load cell, Strain gauge, MSC PATRAN, MSC NASTRAN, Finite Element Method (FEA), Static analysis, Von mises stress.
1. INTRODUCTION
Load cells are transducers that effectively senses the force for a very wide scope of conditions. They are the most important part of any load measurement system, which
converts the mechanical force acting on it into proportional electrical signal. When a force is applied to a body it flexes, resulting in minute compression or elongation. The amount of movement being directly proportional to the change in resistance an accurate indication of weight can be given.
Fig 1. Load cell-based weighing system Block diagram
© 2019, IRJET | Impact Factor value: 7.211 | ISO 9001:2008 Certified Journal | Page 3489
1.1
Components of Load cell
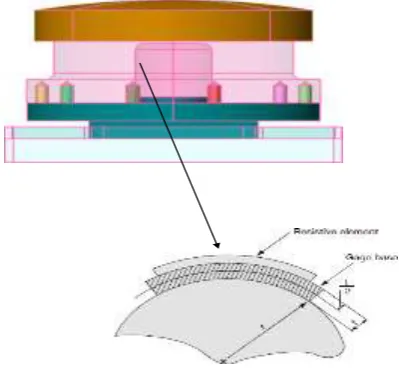
The typical components of a load cell that are considered in the current work are given below in the current section. A column type load cell consists of a hollow or solid cylinder with strain gauges mounted along the longitudinal axis of the element and electrically configured into a Wheatstone bridge circuit. Two of the gauges are mounted with their axes parallel to the longitudinal axis of the column and a corresponding number of gauges are mounted with their axes perpendicular to the axis of the column type load cells could be used both for compression or tensionmeasurement.
Fig 1.1 Hollow column type of load cell used for the Compressive force measurement
1.2
Material Properties
The material specified for the linear static analysis is EN – 24 Steel. The corresponding data is given table 1.2.
[image:2.595.49.249.330.515.2]Table 1.2 Material properties
2. Process Methodology
Finite element method is employed for analysing the Load Cell.
Steps involved:
Step-1: Designing the Load cell in CATIA V5 and then imported into NASTRAN software as shown below
Fig 2. CAD Model of the Load Cell Setup
[image:2.595.339.558.411.521.2]Step-2: The given material properties are applied to the imported CAD model
Fig 2.a Attributing Material Properties to the Elements
Step-3: For meshing of the load cell model TET10element is considered. Because Tet4 is stiffer compared to real
Specification EN –24 Steel
Poisson’s Ratio 0.3
Young’s Modulus 211000 N/mm2
Static Yield Stress 940 N/mm2
Ultimate Stress 1075 N/mm2
Density 78500 N/m^3
TOP PLATE
LOAD CELL
[image:2.595.310.534.595.700.2]© 2019, IRJET | Impact Factor value: 7.211 | ISO 9001:2008 Certified Journal | Page 3490
component and hence not used for the analysis thereforeTet10 element is adopted for meshing.
[image:3.595.315.548.149.457.2]Total number of Elements: 13633 Total number of Nodes: 23745
Fig 2.b Meshed Model using TET 10 Element
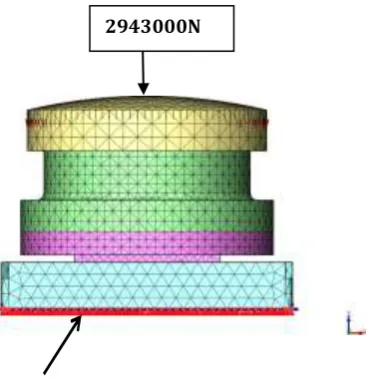
Step-4: Applying loads and boundary conditions:
A load of 300 ton (i,e.,2943000N) is applied on the top plate and Bottom plate is fixed i.e., all DOF is arrested as shown below.
[image:3.595.53.265.197.330.2]FIXED
Fig 2.c Load and Boundary conditions for the given model
Step-4: Static analysis of Load cell is done using MSC PATRAN and Von-Misses stresses are obtained.
Fig 2.d Von mises stress distribution pattern for the load cell model
The Von Mises stress distribution pattern for the load cell model is given in figure 5.4, it is herewith seen from the figure that the solid von mises stress varies from a minimum of 1.32704 e-003 MPa to a maximum of 9.6047 e+002 MPa for the load cell assembly comprising of a bottom plate, top plate and a square plate assembly while, the solid von mises stress varies from a minimum of 1.54647 e+001 MPa to a maximum of 8.13864 e+002 MPa for the load cell component.
Theoretical Values for 300 tons Load Case
[image:3.595.38.223.460.653.2]© 2019, IRJET | Impact Factor value: 7.211 | ISO 9001:2008 Certified Journal | Page 3491
cell where the strain gauges are placed, and this is shown [image:4.595.328.511.327.499.2]below.
Fig 2.e Two-Dimensional Draft of Load Cell
DATA:
Load = 300 ton (2943000N)
Outer diameter (Do) = 142mm
Inner diameter = 45mm
CALCULATIONS:
Maximum stress =
Maximum stress = 206.58 N/mm2
[image:4.595.43.275.525.694.2]The Max stress value is determined to be 210.5 N/mm2 for a load of 3000000 N, which clearly indicates that the analytical stress values are less than the maximum stress for the load case considered.
Fig 2.f Von mises stresses at the region of interest where the strain gauges are placed
The static analysis for the load cell is done using MSC PATRAN and MSC Nastran. The Von-mises stress distribution patterns are shown and the stresses induced are well within the yield stress of the load cell model. Also, the stresses induced at the region of interest are shown and are within the desirable range. This clearly indicate that the design holds good, since the analytical stresses are very much less than the maximum stress values.
2.1 Analysis of Load Cell Design for 600-ton
capacity:
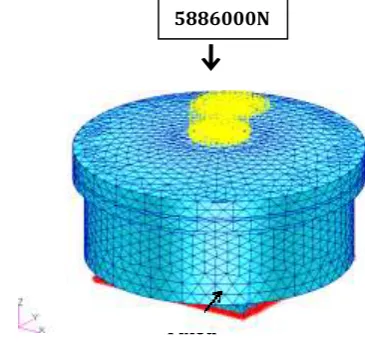
Same procedure is carried out as that of 300-ton case but only the difference is 600-ton load is applied instead of 300-tons.
Fixed
Fig 2.1a Meshed Model of the Load Cell Setup
Theoretical and Analytical Values for 600ton Load Case
Data:
Load = 600 tons(5886000N)
Outer Diameter Do = 228 mm
Inner diameter Di = 38 mm
Calculations:
Maximum stress =
Maximum stress = 148.28 N/mm2
© 2019, IRJET | Impact Factor value: 7.211 | ISO 9001:2008 Certified Journal | Page 3492
Fig 2.1b Von misses stress at the region of interestThe static analysis for the load cell is done using MSC PATRAN and MSC Nastran. The Von mises stresses induced at the region of interest are shown in figure – 5.10 and the stress value is found to be around 406 N/mm2, hence the stress value is exceeding desirable range. Therefore, the design modifications should be done to the existing design of 600-ton capacity load cell.
2.1.1 Design Modification with 2 mm radius Fillet
for 600-ton capacity Load Cell:
In order to reduce the stresses induced in the load cell, the first modification made is the introduction of 2mm fillet as shown in figure below. The fillet region of the load cell helps in reduction of stress concentration and thereby brings about compatibility in the design.
[image:5.595.73.218.590.692.2]
Fig 2.1.1a Design modification with 2 mm fillet radius
Fig 2.1.1b Von mises stress at the region of interest The static analysis for the load cell model with the first design change that is introduction of fillet at the load cell region is done, and the analysis results have clearly showed that the stress values at region of interest where the strain gauges
would be placed reduced from around 406 N/mm2 to around
320 N/mm2.The fillet provided has thus reduced the stress concentration and has enhanced its load bearing capacity.
2.1.2 Design Modification with Bottom plate:
The next analysis is for the load cell with the introduction of bottom plate to the previous load cell model.
Fig 2.1.2a Modified bottom plate
The static analysis for the load cell model with the bottom plate is done, and the analysis results have shown that the stress values at the region of interest where the strain gauges would be placed reduced from around 320 N/mm2 to around 220 N/mm2. The Von mises stress at the region of interest is
thus varying in between 210 N/mm2 and 220 N/mm2, thereby facilitating the need for incorporation of design concepts for further reduction in the stress values as shown in fig 2.1.2b.
© 2019, IRJET | Impact Factor value: 7.211 | ISO 9001:2008 Certified Journal | Page 3493
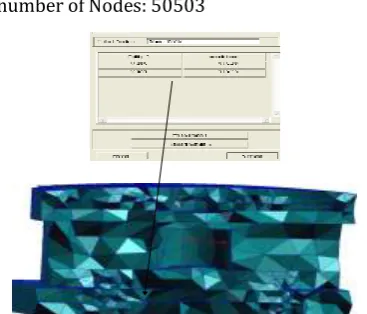
Element Type: Tet10 [image:6.595.62.246.138.295.2]Total number of Elements: 30922 Total number of Nodes: 50503
Fig 2.1.2b Von mises stress at the region of interest
2.1.3 Load Cell with Flat Top Plate:
The curved top plate in the earlier design is changed to flat top plate as shown below and the analysis for the load cell model is carried out.
Fig. Old design Fig. New design
The static analysis for the load cell with flat top plate is effectively carried out. The Von mises stresses induced at the region of interest are as shown in the fig 5.17.
The stress value is around 157.61 N/mm2, and comparing this stress value with the Theoretical stress value, the induced stresses are within the desirable range.
The Von mises stresses at the area of interest is given fig 2.1.3
Element Type: Tet10
Total number of Elements: 16684 Total number of Nodes: 30103
Fig 2.1.3 Von mises stress at the region of interest
3. Comparison of results:
SI No Design case Stress (N/mm2)
1 Existing design of 600-ton capacity load cell
406
2 600-ton load cell with 2mm fillet 320
3 600-ton load cell with bottom plate
220
4 600-ton load cell with flat top plate
157.61
Table 3. Results of Stress for different Load Cases
DESIGN MODIFICATIONS
STRESS (N/mm2)
STRAIN
Theoretical Nastran Theoretical Nastran Load cell with
curved top plate and with bottom
plate
151.15 220 0.716×1 0-3
1.04×10⁻³
Load cell with flat top plate and
with bottom plate
151.15 157.61 0.716×1 0-3
746×10-3
[image:6.595.314.554.278.457.2] [image:6.595.43.282.407.515.2]© 2019, IRJET | Impact Factor value: 7.211 | ISO 9001:2008 Certified Journal | Page 3494
4. CONCLUSIONS
The linear static finite element analysis was performed using MSC Nastran finite element code.
The equivalent von misses stress contours at the region of interest are shown in figures.
Further in order to reduce the stress induced to the desirable range the relevant design modifications were employed and analysis was carried out.
In order to give validations for the FEA results the theoretical stress values were calculated and the results of FEA were compared with the theoretical results.
It is evident from the results that the load cell withdesign modifications in terms of the bottom plate and the fillet has reduced the stress accumulation in the load cell and thereby enhanced its load bearing capacity.
REFERENCES
[1] I. Muller, de Brito, R.M., C.E. Pereira and V.Brusamarello,
‘‘Load cells in force sensing analysis - thoery and a novel application,’’ IEEE Instrument & Measurement Magazine, Feb. 2010.
[2] R.P.Taylor, W.G. Streele, and F,Douglas, ‘‘Uncertainty
analysis of rocket motor thrust measurements with correlated biases,’’ ISA Transactions, Vol. 34, No. 3, pp. 253–259, 1995.
[3] F.K.Chang, Structural health monitoring, 2005: advancements and challenges for Implementation. Pennsylvania, U.S.A.: A DES Tech Publications, IMC., 2005.
[4] H.Otsuka, E.Takeshita, W.Yabuki, Y.Wang, T.Yoshimura
and M.Tsunomot, ‘‘Study on the seismic performance of reinforced concrete columns subjected to torsional moment, bending moment and axial force,’’ in 13th World Conference on Earthquake Engineering, Vancouver, B.C., Canada, Paper No. 393, Aug. 2004.
[5] De Lucena, S.E., de Aquino, M.G.S. and Caporalli-Filho, ‘‘A
load cell for grain-propelled ballistic rocket thrust
measurement,’’ in IEEE Instrumentation and Measurement Technology Conference, Ottawa, Canada, pp. 1767–1772, May 2005.
[6] Precision Load Cells, Himmelstien S and Company, IL 60195, USA, 1991.
[7] Load and Torque Cells, Interface Force Measurement
Ltd., Crowthorne, Berks., UK, 1995.
[8] Load Cell and Torque Sensor Handbook, Lebow Product
Inc., Don Mills, 2003.
[9] Mechanical Measurements by Thomas G Beckwith (3rd
Edition), Wiley Publications, 2004.
[10] Practical Finite Element Analysis by Nitin .S Gokhale,
Sanjay Deshpande, Sanjeev Bedekar and Anand N Thite.
[11] “MSC/NASTRAN user’s Manual”, user’s guide,
MSC/NASTRAN linear static analysis.
[12] Machine Design Data Hand Book – PSG Coimbatore.
[13] M.Makabe and Harada, S., ‘‘Research of protection
equipment for load cell receiving a large impact load,’’ in SICE-ICASE International Joint Conference, Bexco, Busan, Korea, pp. 2521–2526, Oct. 2006.
[14] The Pressure Strain and Force Handbook, Omega
Engineering, Inc., Stamford, CT, 1995.
[15] Research Article on Strain gauge Load cell by Frank
E.Golding, Emory W Farr, U.S4148219
BIOGRAPHIES
NEHA NANDIKOL
Obtained his Bachelor’s degree in mechanical Engineering from Visvesvaraya Technological University (VTU).