© 2019, IRJET | Impact Factor value: 7.34 | ISO 9001:2008 Certified Journal
| Page 756
SLOPE STABILITY EVALUATIONS BY LIMIT EQUILIBRIUM AND FINITE
ELEMENT METHOD
Mr. Vineet R. Desai
1, Mr. Maulik R. Joshi
21
M. Tech Student, C. G. Patel Institute of Technology, Bardoli (Gujarat)
2
Lecturer, Dept. of Civil Engineering, Tapi Diploma Engineering Collage, Surat (Gujarat)
---***---Abstract -
A slope may be an unsupported or supported,inclined surface of some mass like soil mass. Slopes can be natural or manmade. These may be above ground level as embankments or below ground level as cuttings. Analysis of slope stability is carried out to minimize the occurrence of slope failures and landslides. Failure of natural slopes (landslides) and man-made slopes has resulted in much death and destruction. Engineers must therefore give serious consideration before any construction or development is executed to ensure that the designed slopes remain stable. Slope failure can be determined through appropriate measurement of slope stability and the analysis of slope. This thesis deals with slope stability evolutions carried out by commonly used limit equilibrium (LE) and finite element (FE) methods. The study utilizes two LE based software (SLOPE/W) and one FE based software (PLAXIS). The principal difference between these two analyses approaches is that the LE methods are based on the static of equilibrium whereas FE methods utilise the stress‐strain relationship or constitutive law. The study, carried out using the monitored groundwater table, reveals that the groundwater is the potential destabilizing factor in the slopes. Both hydrostatic pore pressure distributions with phreatic surface correction and seepage analysis were carried out in the stability analysis. The pore pressure distributions from the seepage analyses indicated critically stable slopes particularly at the toe areas. However, a significant improvement in the FOS was found with lowered groundwater table. For analysis factors such as soil cohesion, angle of internal friction, and unit weight of soil, which have been determined using lab soil investigation reports. The difference in FOS found from the LE and FE analyses may have a little interest, if there is a large uncertainty in the input parameters. Therefore, priority should be given to investigate the shear strength parameters and precise mapping of the slope geometry before selecting an appropriate analysis method.
Key Words: Limit Equilibrium method, Finite Element
Method, Angle of internal friction, Cohesion, factor of safety, Slope stability
1. INTRODUCTION
Slopes can be natural or man-made. These may be above ground level as embankments or below ground level as cuttings. Earth slopes are formed for railway embankments, earth dams, canal banks, levees, and at many other locations. Instability related issues in engineered as well as natural
slopes are common challenges to both researchers and professionals. Instability may result due to rainfall, increase in groundwater table and change in stress conditions. Similarly, natural slopes that have been stable for many years may suddenly fail due to changes in geometry, external forces and loss of shear strength. In addition, the long-term stability is also associated with the weathering and chemical influences that may decrease the shear strength.
The engineering solutions to slope instability problems require good understanding of analytical methods, investigative tools and stabilization measures. One says, “The primary aim of slope stability analyses is to contribute to the safe and economic design of excavation, embankment and earth dams”. Slope is an exposed ground surface that stands at an angle with the horizontal. Slopes are required in the construction of highway and railway embankments, earth dams, levees, canals etc., and are generally less expensive. Failure of natural slopes and man-made slopes has resulted in much death and destruction. Slope stability analysis consists of determining and comparing the shear stress developed along the potential rupture surface with the shear strength of the soil.
2. MATERIALS AND METHODS
[image:1.595.311.558.629.742.2]The project work was divided for the two cases, dry season and Wet season condition. For the soil required tests were conducted to determine properties of the soil such as cohesion, angle of internal friction, etc. Other input soil strength parameters are found by laboratory testing. These parameters are used for the analysis part, which were done by using a Finite Element Method (FEM) for use PLAXIS Software and for Limit Equilibrium Method (LE) using GEOstudio (SLOPE/W) software.
© 2019, IRJET | Impact Factor value: 7.34 | ISO 9001:2008 Certified Journal
| Page 757
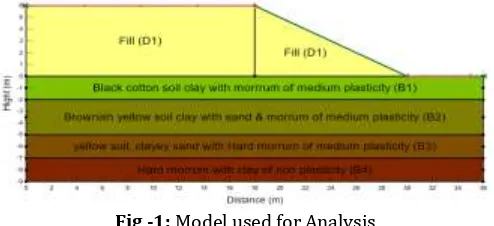
For study Surat region slope site condition used a slope site for getting required soil parameters. Laboratory investigated soil parameters shown in below table. For below the ground level soil parameters Borelog Chart used.
Table -1: Test Results
Sample Wet Density [kN/m3]
Dry Density [kN/m3]
Cohesion [kpa]
Angle of internal friction
D1 19.51 16.67 83.36 17.03
B1 17.35 14.02 10.79 11
B2 17.45 14.54 10.79 11
B3 17.65 15.01 10.79 11
B4 17.65 15.01 10.79 11
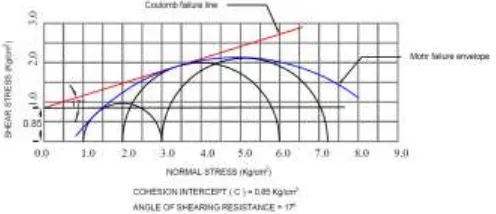
These results obtain from the in-situ test, Standard Proctor test and triaxial tests.
Chart -1: Mohr-coulomb Envelope
3. SOFTWARE ANALYSIS
The most vigorous LE methods, for example Janbu generalised (JG), Morgenstern-Price (M-P) and general limit equilibrium (GLE) procedure were selected for analyses. In addition, Bishop’s simplified (BS) and Janbu’s corrected (JC) methods were chosen due to their common use in practice.
SLOPE/W, developed by GEO-SLOPE International Canada, is used for slope stability analysis. This software is based on the theories and principles of the LE methods. The software SLOPE/W computes FOS for various shear surfaces, for example circular, non‐circular and user‐defined surfaces (SLOPE/W 2002, Krahn 2004). However, only the circular SS is automatically searched.
The general input parameters, as used for the slope were used to search and refine the circular CSS in SLOPE/W. The entry and exit search option was used to identify the CSS and
this was verified by the auto-locate option. The Mohr-Coulomb soil model and failure criterion together with a half-sine function for interslice forces were selected. They computed the factor of safety from the critical slip surface.
PLAXIS is a finite element code for soil and rock analyses (PLAXIS 2004), developed by PLAXIS BV in cooperation with several universities including DUT in the Netherlands and NTNU in Norway. The computer program is applicable to many geotechnical problems, including stability analyses and steady‐state groundwater flow calculations. This software contains several FE models and four main sub‐routines. These routines are inputs, calculations, outputs and curve plots. The FOS versus displacement is plotted from the curve plots sub‐routine. Material properties including shear strength parameters were defined for each soil layer. A plain strain model of 15 noded triangular elements was used to generate the finite element mesh. Similarly, pore pressure distributions were generated based on phreatic level with and without corrections and the steady‐state groundwater calculation. Moreover, a Mohr‐Coulomb material model was selected for the stability analyses.
[image:2.595.38.286.405.512.2]The slopes were modeled in the input module of PLAXIS based on 15 noded elements in a plane strain model. A sufficient well-refined mesh for the upper layer was generated to about the least possible FOS. Similarly, the soil properties in each layer were defined using a Mohr-Coulomb soil model.
[image:2.595.312.549.451.582.2]Fig -2: Dry season: FOS and CSS from SLOPE/W
© 2019, IRJET | Impact Factor value: 7.34 | ISO 9001:2008 Certified Journal
| Page 758
[image:3.595.309.561.287.416.2]The Dry season GWT consider below the depth 9 meter of the ground level. Shows the CSS and FOS compute by SLOPE/W, where similar results were obtained from the analyses by PlAXIS software.
[image:3.595.307.561.448.570.2]Fig -4: Wet season: FOS and CSS from SLOPE/W
Fig -5: Wet season: FOS and CSS from PLAXIS
The Ground water table (GWT) was raised in the model to represent wet season conditions. The phreatic level was corrected in SLOPE/W. In SLOPE/W, the option for the phreatic level correction was activated to compute the corrected pore pressure distribution. The results obtained from SLOPE/W are depicted in Fig 4.
4. SLOPE STABILITY RESULTS EVALUATION
The project work was divided for the two cases, dry season and Wet season condition. For the soil required tests were conducted to LE methods are important mainly because of two reasons. First, the methods have proved to be reasonably reliable in assessing the stability of slopes. Second, the methods require a limited amount of input, but can quickly perform an extensive trial-and-error search for the critical slip surface (CSS). In spite of these limitations, the LE methods are still common in practice because of their simplicity and the reasonably accurate FOS obtained.
In recent years, finite element (FE) methods, especially the FE program PLAXIS are becoming increasingly popular (Nordal & Glaamen 2004). The FE program PLAXIS is widely used in
many European countries and its application is spreading. Today, computational software based on the FE principles are developed and frequently applied in practice. Since the FE methods are based in compatibility relationship, and thus can handle the stress-strain behaviour of soil, a more realistic stress situation can be computed. Thus, FE analyses have an advantage over LE analyses for evaluation of the stability of slopes.
4.1 Comparison of LE methods
Some methods compute FOS by force equilibrium (e.g. Janbu’s simplified (JS) methods) or moment equilibrium (e.g. Bishop simplified (BS) method). Similarly, the advanced LE methods satisfy both force and moment equilibrium (e.g. Janbu’s GPS, M-P and Spencer methods).
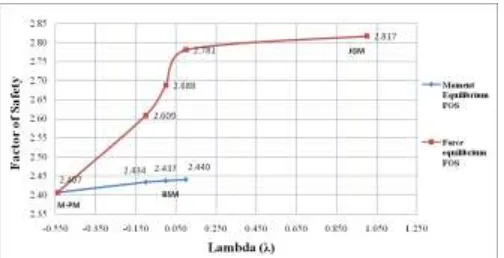
Chart -2: Comparison of FOS vs. Lambda (λ) for Dry season
Chart -3: Comparison FOS vs. Lambda (λ) for Wet season
© 2019, IRJET | Impact Factor value: 7.34 | ISO 9001:2008 Certified Journal
| Page 759
Chart -4: Comparison of LE method with BSM
The most common LE methods are also compared in Chart-4, using the BSM as a reference (0%). The comparison is based on the analyses for different conditions.
As in the discussion, M-PM computes consistent FOS with minor variations (~1%) on the higher side, and the reason has already been discussed above. Similarly, JGM also show variations 15% for the dry conditions and -48% for wet condition. However, both BSM and M-PM methods results in exactly the same FOS (not shown here) if particular, circular SS is analysed. This indicates that both methods compute the FOS with the same accuracy. In addition, the lower FOS in JGM for the CSS identified by itself means that the method is able to search for the CSS more accurately than M-PM and BSM. Nevertheless, the marginal variations in the FOS show that both methods are equally good among the LE methods even for the individual circular SS analysis.
Moreover, M-PM & JCM shows the largest variation on the lower side ranging (8% to 15%) Abramson et al (2002) say, ” FOS values may generally differ by ± 15% upon comparison with the results calculated by the M-P method.” In this study also, the variations are found within the range of the CSS analysis.
4.2 Comparison of LE and FE analyses
As discussed above, LE and FE analyses have fundamental difference in the basic principles. The first is based on the limit equilibrium formulations, which are dependent on static force or moment equilibrium. The second is based on a stress-strain relationship, which can effectively accommodate the change in stresses. The FE analysis in PLAXIS for example finds the CSS, where the excessive strains are localized, and computes the FOS by a c-ɸ reduction procedure for the Mohr-Coulomb soil model. In this context, the like to like comparison by the computed FOS can reveal the inherent difference between LE and FE methods. In addition, the fundamental difference within the analysis methods explains the difference in computed results (FOS).
Chart -5:Comparison of LE methods with FE software PLAXIS
Using the FOS computed from PLAXIS as a comparison of the LE and FE methods is presented in chart-5. The larger difference in wet season case indicates that LE analyses have difficulties to estimate a realistic pore pressure distribution, and further changes in the effective normal stresses along the CSS. This means, more accurate stresses can be computed in FE analyses than in LE analyses.
The study shows that the advanced LE (BS, M-P) method may overestimate FOS in Drained and Undrained condition as much as 15 % which is a significant difference (Chart-5). However, the variation is quite low for dry slope. Nevertheless, the differences in FOS may vary from case to case and therefore it cannot be generalised for all kinds of shear surfaces.
The reason for the difference in FOS in primarily related to the normal stress distribution along the CSS. According to a study carried out by Krahn (2004) a significant difference in normal stress distribution, particularly in the toe area can be found between FE and LE analyses for a particular SS. Krahn (2004) further concludes, “The normal stress distribution for a deeper CSS is much closer and thus the FOS from FE and LE analyses is not much different.” Janbu (1973) also suggests studying the shear stress concentrations in critical zones by using a stress-strain relationship instead of the LE equations.
4.3 Stability conditions of the case study slopes
The summary of the computed FOS is presented in Fig 41. The slope was analysed by both LE and FE methods for various conditions. The LE (SLOPE/W) analyses are based on circular SS and the present FOS is related to Janbu method. However, PLAXIS has computed slightly lower FOS and the reasons for this have been discussed above.
© 2019, IRJET | Impact Factor value: 7.34 | ISO 9001:2008 Certified Journal
| Page 760
Chart -6: Comparison of FOS computed by two software programs
Broadly speaking, the slope stability evaluations are irrelevant unless proper input parameters are utilized in the computations. Many authors have highlighted the importance of the quality of the input parameters. For example, Janbu (2001) states, ’The shear strength of subsoil has to be known before the analysis can be performed.’ Likewise, Nash (1987) points out, ‘The soil properties and groundwater conditions including others are the principles sources of uncertainty in slope stability.’ Thus, the investigated of relevant soil parameters is a vital work prior to perform slope stability evaluations.
Accordingly, full-scale laboratory investigations from index tests to the advanced triaxial tests were carried out in this study. An emphasis was given to investigate the effective shear strength parameters for the case study slopes. The specimens were built-in from the representative soil samples taking the reference to the index properties were verified later by in situ laboratory testing, and only marginally different results were found compared to the Standard Proctor test (Chapter 6 in section 6.3.2). Therefore, the specimens for permeability and triaxial tests were built-in based on the maximum dry density found by the Standard Proctor tests.
5. CONCLUSIONS
The project work was divided for the two cases, dry season and Wet season condition. For the soil required tests were conducted to
The further conclusions are derived from the comparative study between the LE based software (SLOPE/W) and the FE based software (PLAXIS). The comparative studies were made using the PLAXIS calculation as reference. This program searches for the CSS and computes the effective base normal stress utilising the stress-strain relationship, also for non-circular geometric.
The Bishop simplified (BS), Janbu generalised Janbu (JG), Morgenstern-Price (M-P) methods in most cases identical FOS for circular SS without any external loads on the slopes.
The Bishop Simplified (BS) and Morgenstern-Price (M-P) method or general limit equilibrium procedure is recommended to use in any kind of SS analyses, including external forces unless FE methods are available.
All LE methods, except the Fellenius (Ordinary) and Janbu methods, estimate higher FOS than FE analysis in PLAXIS. The Janbu method may underestimate FOS from 10-12% compared to FE. However, the correction factor applied in Janbu method (i.e. JGM & JCM) computes almost identical FOS compared with the FE analysis.
The FE methods are best suited for external loads, complicated geometry and more realistic normal stress distributions and resulting FOS. Hence, the FE analysis is recommended to use in stability evaluations with investigated relevant soil parameters.
For pore pressure case LE (M-P) analysis may overestimate FOS as high as ±10% compared to the FE analysis.
Where appropriate application of a positive dilatancy angle (ψ) in the FE analysis may improve the FOS in the range of 4-10% depending on the pore pressure conditions. However, the difference in FOS between LE (BS, M-P) and FE analyses may sometimes rise to moderate variations (<5%) even if these parameters are considered
6. FURTHER RESEARCH
The stability evaluations of the case study slopes utilise the common analytical approach based on the principles of the saturated zone. However, for situations where a failure occurs above the GWT in the partially saturated zone, the stability of slopes are better evaluated using an assumption of unsaturated soil. The advantages of such analysis will have both cost effective solution and advanced understanding of the suction contribution in the slope stability. Similarly, the studies of 3D-slope stability analyses show better FOS than in 2D-ananlyse (Duncan 1996).
3D-slope stability analyses are recommended to compare the FOS obtained from 2D-analyses, which are generally considered providing conservative results (i.e. low FOS). With the expected higher FOS in 3D-analyses a cost effective slope may be designed maintaining adequate stability
REFERENCES
[1] Abramson, L. W., Lee, T. S. Sharma (2002) “Slope
© 2019, IRJET | Impact Factor value: 7.34 | ISO 9001:2008 Certified Journal
| Page 761
[2] Andrzej M. (2014) “Slope Stability Analysis with GEO5
Software for Laski Landslide” DOI: 10.2478/CTG-2014-0005.
[3] Aryal K. (2006) “Slope Stability Evaluation by Limit
Equilibrium and Finite Element Methods” ISBN 82-471-7881-8 (electronic) & ISBN 82-471-7882-6 (Printed).
[4] Bishop, A. W. and Henkel, D. J. (1962) “The measurement
of soil properties in triaxial tests.
[5] Bishop, A. W. (1955) “The use of slip circles in stability analysis of slopes. Geotechnique, VOl.5 No.1.
[6] Chunyuan L., Ulysse S., F. Hounsa (2018) “ Analysis of
Road Embankment Slope Stability” Open Journal of Civil Engineering, 2018, 8, 121-128, ISSN Online: 2164-3172 ISSN Print: 2164-3164.
[7] Cruden (1991), “A simple definition of a landslide”,
Bulletin of International Association of Engineering Geology. 43, pp 27-29.
[8] Chvan G., Salunkhe D., Bartakke R., Kothavale P. (2017) “
An Overview on method for Slope Stability Analysis” IJERT ISSN:2278-0181 Vol. Issue 03, March-2017.
[9] Dr. B. C. Punmia, Er. Ashok Kumar Jain, Dr. Arun Kumar
Jain “Soil mechanics and foundations”Laxmi Publications (P) LTD, 1994, 2005.
[10]Dr. K. R. Arora “Soil mechanics and foundation
engineering”, (1987) Standard publisher distributors, (2015) ISBN: 81-8014-112-8.
[11]Duncan, J. M. (1996) “Limit Equilibrium and Finite
Element Analysis in Slopes.” Journal of Geotechnical Engineering, VOl.122 (7).
[12]Fredlund D., Gitirana G., Pham H. (2001) “Slope Stability
Analysis Dynamic Programming Combined With Finite Element Stress Analysis” International Conference on the Management of the land and water Resources, MLWR, October-2001.
[13]Griffiths D. (2015) “Slope Stability Analysis by Finite
Elements” Geomechanics Research Center Colorado School of Mines September-2015.
[14]Guo M., Ge X., Wang S. (2011) “Slope stability analysis under seismic load by vector sum analysis method” State Key Laboratory of Geomechanics and Geotechnical Engineering, Institute of Rock and Soil Mechanics, Chinese Academy of Sciences, Wuhan, 430071, China.
[15]Huat, Ali, Rajoo (2006), “Stability Analysis and Stability Chart for Unsaturated Residual Soil Slope”, American Journal of Environmental Sciences 2 (4): 154-160.
[16]Kolekar (2008) “Comparative Study of Stability of Man
Made Slope by Limit Equilibrium Method and Geo5 Software”, Proceedings of The 12th International Conference of International Association for Computer Methods and Advances in Geomechanics (IACMAG), Oct 2008, Goa, India.
[17]Kale S., Nimbalkar S., Borole S.T, Mungase S., (2016) “Slope stability analysis with geo5 software for malin Land slide in pune” Global Journal Of Engineering Science And Researches ISSN2348–8034 : 3.155 February-2016.
[18]Matthews C. and Farook Z., Arup and Helm P., “Slope
stability analysis – limit equilibrium or the finite element method” (2014), ground engineering Newcastle University.
[19]Mohanty A. Graduation thesis (2009) “Slope Stability
Analysis Using Genetic Algorithm” Department of Civil Engineering National Institute of Technology Rourkela.
[20]PLAXIS (2002): PLAXIS-2D Version 8.2, Reference Manual, Edited by Brinkgreve, et al., DUT, Netherlands. www.plaxis.com.
[21]SLOPE/W (2012). Stability Analysis User’s Guide
Version 8, GeoSlope Office, Canada. www.geoslope.com.
[22]Stability Using 2D and 3D Methods” University of Akron
August-2006.