ISSN Online: 2161-7198 ISSN Print: 2161-718X
DOI: 10.4236/ojs.2018.82020 Apr. 13, 2018 317 Open Journal of Statistics
Statistical Analysis of Variables Influencing
Type of Birth in Sri Lanka: A Logistic
Regression Approach
H. P. R. R. Pathirana, N. Varathan
*Department of Mathematics and Statistics, University of Jaffna, Jaffna, Sri Lanka
Abstract
Caesarean is a major surgical procedure undertaken in obstetrics and its rate is increasing in Sri Lanka as well as in the world. In Sri Lanka, health statistics show an increase in caesarean rates from 13.3% in 1998 to 30.6% by 2007. Due to its potential serious risks and the burden on the health system, many au-thorities have recommended reducing the caesarean rate for many years. This motivated us to study the most influential variables on the type of birth in Sri Lanka. In this study, based on the Anuradhapura Teaching Hospital records, entire 805 new born babies’ birth information was considered during the month of May, 2015. The variable “Type of Birth” (Normal/Caesarean) was considered as a binary response variable and age, height, weight of mother and sex, weight, length, shoulder length, head circumference of the baby were treated as explanatory variables. Logistic regression was used to model the da-ta and using stepwise regression; mother’s age, height and weight were identi-fied as the most influential variables on the type of birth. Further, it was observed that the odds of having normal birth is 80% higher for woman who belongs to the age group less than or equal to 30 years compared to woman who belongs to the age group greater than 30 years. Moreover, the Hosmer-Lemeshow good-ness of fit test was used to check the adequacy of the fitted model. Results from this study revealed that in future, the type of birth may be predicted by considering these identified influential variables.
Keywords
Caesarean, Logistic Regression, Type of Birth, Odds Ratio, Chi-Square Test
1. Introduction
Caesarean is a major surgical procedure undertaken in obstetrics and its rate is How to cite this paper: Pathirana, H.P.R.R.
and Varathan, N. (2018) Statistical Analysis of Variables Influencing Type of Birth in Sri Lanka: A Logistic Regression Approach. Open Journal of Statistics, 8, 317-326.
https://doi.org/10.4236/ojs.2018.82020
Received: February 22, 2018 Accepted: April 10, 2018 Published: April 13, 2018
Copyright © 2018 by authors and Scientific Research Publishing Inc. This work is licensed under the Creative Commons Attribution International License (CC BY 4.0).
DOI: 10.4236/ojs.2018.82020 318 Open Journal of Statistics increasing in Sri Lanka as well as in the world. Sri Lankan health statistic shows an increase in caesarean rate from 13.3% in 19998 to 30.6% by 2007. Due to its potential serious risks and the burden on the health system, many authorities have recommended reducing the caesarean rate for many years.
There are two types of births: one is vaginal (normal) birth and the other one is caesarean birth. In this study, we mainly focus on the caesarean birth. Caesa-rean is the delivery of a baby through a surgical incision in the mother’s abdo-men and uterus. Caesarean is recomabdo-mended when vaginal delivery might pose a risk to the mother or baby. Caesarean delivery also can divide into two types; they are planned caesarean and unplanned caesarean. There are lots of situations to perform a planned caesarean before a mother goes to labour. Some reasons to perform a planned caesarean delivery are: the pattern of the cut of previous cae-sarean; mother carrying more than one baby; baby is expected to be very large (>4000 g); baby is in a breech (bottom first) or transverse (sideways) position; mother has an obstruction, such as a large fibroid, that would make a vaginal de-livery difficult or impossible; baby has known abnormality that would make va-ginal birth risky; mother is a HIV positive or increased blood pressure or heart rate in the mother or baby. And unless there is a medical reason to do so, we do not schedule it before 39 weeks’ gestational age. Mother’s placenta starts to sep-arate from uterine wall, that is baby will not get enough oxygen, Mother’s water breaks and Baby stops moving are some main causes to have an emergency cae-sarean.
In general women say that giving birth vaginally feels like more of a natural experience. Actually going through labour and having vaginal delivery is a long process that can be a hard work for the mother. But the benefit of having vaginal birth is that it has shorter hospital stay and recovery time compared with a cae-sarean and it is safer than a caecae-sarean birth for both mother and baby. Another advantage for the baby of a vaginal delivery is that mother will have more early contact with her baby and she can initiate breastfeeding sooner. Not only is that vaginal delivery a benefit for the baby because it makes babies less likely to suffer breathing problems at birth.
DOI: 10.4236/ojs.2018.82020 319 Open Journal of Statistics identified. Gunasekara et al. [2] have studied whether the caesarean section rate is rising? They found that the limitation of family size and the couple’s expecta-tion of a healthy child at the end of the pregnancy and the lack of experience in performing operative vaginal deliveries are the main reasons to the increase in caesarean rates. In their research they have tried to reduce unnecessary caesa-rean by doing it only when it is obstetrically justified, especially in the first deli-very. Kumara and Perera [3] have evaluated six commonly used formula for so-nographic estimation of fetal weight in Sri Lankan population. They have done this at Sri Jayawardhanapura hospital and the statistical analysis was done by using Karl Pierson correlation.
Rates of caesarean section: analysis of global, regional and national estimates was evaluated by Betrán et al. [4]. Rates of caesarean section are of concern in both developed and developing countries. They set out to estimate the propor-tion of births by caesarean secpropor-tion at napropor-tional, regional and global levels. The analysis suggests a strong inverse association between CS rates and maternal, in-fant and neonatal mortality in countries with high mortality levels. Lumbiganon et al. [5] have investigated the Method of delivery and pregnancy outcomes in Asia. There has been concern about rising rates of caesarean section worldwide (9 countries including Sri Lanka). They estimated the rate of different methods of delivery and to examine the relation between method of delivery and maternal and perinatal outcomes. They obtained data from women’s medical records to summarize obstetric and perinatal events. Among the 122 Asian health facilities studied, more than one in four women underwent caesarean section. The con-clusion of their research was facilities in China, Sri Lanka, Vietnam, and Thail-and had higher aggregated rates of caesarean section than in Cambodia, India, Japan, Nepal, and the Philippines. Moreover, Fernando and Abeywardene [6] and Goonewardene [7] have analyzed the trend of caesarean section in Sri Lan-ka.
In this study, following Renuraj et al. [8] we analyze the variables affecting type of birth (caesarean and normal) by considering the information we ob-tained from the Teaching hospital in Anuradhapura. By considering the binary nature of response variable, the Logistic Regression approach is used to identify the variables that significantly affect the type of birth. The rest of the paper is organized as follows. In Section 2, we describe the statistical methods used in this research. Results and discussion is given in Section 3. Finally, we provide some conclusion in Section 4.
2. Methodology
2.1. Theoretical Background of Logistic Regression
DOI: 10.4236/ojs.2018.82020 320 Open Journal of Statistics coded as “1” and the contrary outcome (referred to as a “failure”) as “0.
Consider a binary response variable y = 0 or 1 and a single predictor variable x. We want to model E y x
(
)
= p y(
=1 |x)
as a function of x. The logistic re-gression model express the logistic transform of p y(
=1 |x)
as a linear func-tion of the predictor.This model can be written as
(
)
(
(
0 1)
)
0 1
exp 1 |
1 exp
x p y x
x
β β
β β
+
= =
+ + (1)
For multiple predictor variables x x1, 2,,xk, the logistic regression model
can be written as
(
)
(
1 2)
0 1 1 2 21 2
1 | , , , ln
0 | , , ,
k
k k k
p y x x x
x x x
p y x x x
β
β
β
β
= = + + + + = (2)
2.2. The Likelihood Ratio Test
The likelihood ratio test is a test of the significance of the difference between the likelihood ratios for the researcher’s model minus the likelihood ratio for a re-duced model.
i) The “Intercept only” model (null model) reflects the net effect of all va-riables not in the model plus error.
ii) The “Final” model (fitted model), which is the researcher’s model com-prised of the predictor variables.
When the reduced model is the baseline model with the constant only (initial model), the likelihood ratio test tests the significance of the researcher’s model as a whole. A well-fitting model is significant at the 0.05 level or better meaning the researcher’s model is significantly different from the one with the constant only. That is, a finding of significance (p≤0.05 is the usual cutoff) leads to rejection of the null hypothesis that all of the predictor effects are zero. When this like-lihood test is significant, at least one of the predictors is significantly related to the dependent variable.
A formal way to express the contribution to the likelihood function for the pairs (xi, yi) is through the term
( )
( )
( )
11 y
y
i i i i i
x x x
ϕ =π −π −
Since xivalues are assumed to be independent, the product for the terms given in the foregoing equation gives the likelihood function as follows:
( )
i1( )
in
x l
β
=∏
=ϕ
So the log likelihood expression
( )
ln( )
1{
ln( ) (
1 ln 1)
( )
}
n
i i i i
i
L β = l β =
∑
= y π x + − y −π x (3)DOI: 10.4236/ojs.2018.82020 321 Open Journal of Statistics The deviance factor is defined as in the following Equation (4).
likelihood of the current model 2 ln
likelihood of the saturated Devia
model
nce D −
=
= (4)
From the Equations ((3) & (4)):
(
)
ˆ 1 ˆ
ln 1 ln
1
2 i i
i i
i i
D y y
y y
π
π
+ − − − − =
∑
(5)The goodness of fit statistic
(
)
(
)
(
)
(
)
(
)
(
)
for model without the variable for model with the variable
2 ln likelihood of the current model without variable
( 2 ln likelihood of the current model with variable
G=D −D
= − − −
(6)
Thus, 2
( )
~ 1 .
G χ
2.3. Odds Ratio
An odds ratio (OR) is a measure of association between an exposure and an outcome. The OR represents the odds that an outcome will occur given a partic-ular exposure, compared to the odds of the outcome occurring in the absence of that exposure. When a logistic regression is calculated, the regression coefficient (β1) is the estimated increase in the log odds of theoutcome per unit increase in
the value of theexposure. In other words, the exponential function of the regres-sion coefficient (eβ1) is the odds ratio associated with a one unit increase in the
exposure.
2.4. Stepwise Regression
Stepwise regression is a semi-automated process of building a model by succes-sively adding or removing variables based on the t-statistics of their estimated coefficients. Usually, this takes the form of a sequence of F-tests or t-tests, but other techniques are possible, such as adjusted R-square, Akaike information criterion (AIC), Bayesian information criterion (BIC), Mallows’s Cp, PRESS. In this research we used AIC to select the most appropriate model.
The main approaches of stepwise regression are:
• Forward selection, which involves starting with no variables in the model,
testing the addition of each variable using a chosen model comparison crite-rion, adding the variable (if any) that improves the model the most, and re-peating this process until none improves the model.
• Backward elimination, which involves starting with all variables, testing the
deletion of each variable using a chosen model comparison criterion, deleting the variable (if any) that improves the model the most by being deleted, and repeating this process until no further improvement is possible.
2.5. Chi-Square Test of Independence
DOI: 10.4236/ojs.2018.82020 322 Open Journal of Statistics the two variables. In this test, we are interested in researching if two categorical variables are related or associated (i.e. dependent). Therefore, until we have evi-dence to suggest that they are we must assume that they are not. This is the mo-tivation behind the hypothesis for the Chi-square Test of Independence:
H0: In the population, the two categorical variables are independent. Ha: In the population, two categorical variables are dependent.
To conduct this test, we compute a Chi-square test statistic where we compare each cell’s observed count to its respective expected count. This Chi-square test statistic is calculated as follows:
(
)
22 i i
i
O E
E
χ
=∑
− (7)where Oi is the observed count and Ei is the expected count.
2.6. Model Selection
The model selection criteria that are most often used for Generalized Linear Models are AIC, BIC, R2, Adjusted R2, C
p, etc. In this research we use the AIC criterion to select the appropriate model. The best model is the one with the minimum AIC value.
General form for calculating AIC:
(
)
2 ln likelihoo
AIC=− ∗ d + ∗2 K (8)
where, ln is the natural logarithm,
(likelihood) is the value of the maximum likelihood, K is the number of parameters in the model.
2.7. Hosmer-Lemeshow Test
The Hosmer and Lemeshow’s (H-L) goodness of fit test divides subjects into de-ciles based on predicted probabilities, and then computes a chi-square from observed and expected frequencies. Then a probability value is computed from the chi-square distribution to test the fit of the logistic model. If the H-L goodness-of-fit test statistic is greater than 0.05 (significance level 𝛼𝛼), as we want for well-fitting models, we fail to reject the null hypothesis that there is no difference between observed and model-predicted values, implying that the model’s estimates fit the data at an acceptable level.
3. Results and Discussions
3.1. Preliminary Study
To have a preliminary idea about the influential variables on the type of birth, the initial step is preceded by representing the data in graphical form. Since the variables influencing type of birth are mostly categorical, we use bar charts to represent the data.
DOI: 10.4236/ojs.2018.82020 323 Open Journal of Statistics
DOI: 10.4236/ojs.2018.82020 324 Open Journal of Statistics Because, different variables influencing Type of birth in different directions. Therefore, these results are not enough to come up with decision about the va-riables which are most influential on the type of birth. So we need to use advance statistical methods to identify the actual relationship among the variables on the type of birth. In the next section we check the relationship of response variable, type of birth with the other predictor variables by using the chi-square test of independence.
3.2. Checking Independence
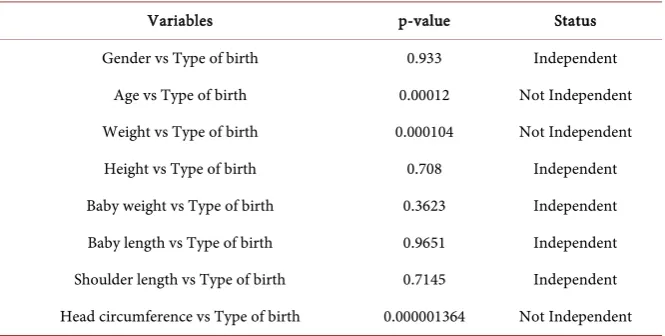
To test the relationship of the variables, in this section we apply the Chi-square test. To perform this, we compare all the explanatory variables with response va-riable, type of birth marginally. The results of the test are shown in the Table 1.
Based on the p-values in the Table 1, one may say that the variable Type of birth depends on Mother’s age, weight and Baby’s head circumference.
3.3. Fitting Logistic Regression Model
As a first step, we fit a logistic regression model by considering all the predictor variables and a response variable type of birth. The corresponding results are shown in the Table 2.
According to the summary statistics from the Table 2, the variables mother’s age, weight and height are statistically significant (P-value < 0.05) to the model. Then we fit the reduced model with only those three significant variables. Here we use the stepwise regression to get the possible models using all the main ef-fects and the possible interaction efef-fects.
Some possible models with corresponding AIC values through stepwise re-gression are displayed in the Table 3.
[image:8.595.207.540.552.720.2]Based on the results from the Table 3, the model with only the main effects having the minimum AIC value (978.34). Therefore, the final model contains only the variables Mother’s age, weight and height. That is, the variables Moth-er’s age, weight and height are more influential to the variable type of birth.
Table 1. Summary statistic for testing independence among variables.
Variables p-value Status
DOI: 10.4236/ojs.2018.82020 325 Open Journal of Statistics
Table 2. Summary statistics for the parameter estimates.
Variables Estimated coefficients Estimated standard error p-value
Intercept −1.016 2.459 0.6795
Age −0.0637 0.0145 0.0000116 (<0.05)
Weight −0.0475 0.00852 0.000000024 (<0.05)
Height 0.0398 0.0154 (<0.05) 0.0102
Gender 0.0548 0.155 0.7246
Baby weight −0.0000553 0.00008012 0.4894
Baby length −0.0105 0.0291 237181
Head circumference 0.00258 0.0076 0.7339
Shoulder length 0.0260 0.0349 0.4569
Table 3. Summary statistics for some selected models.
Explanatory variables in the model AIC values Age, weight, height, age * weight, age * height, weight * height, age * weight * height 985.29
Age, weight, height, age * weight, age * height, weight * height 983.38 Age, weight, height, age * height, weight * height 981.44 Age, weight, height, age * height 979.57
Age, weight, height 978.34
3.4. Goodness of Fit Test
To check whether the fitted model is adequate, we finally apply the Hosmer and Lemeshow test for goodness of fit to the identified reduced model.
H0: The fitted model is adequate. H1: Not H0
Since the P-value = 0.7754 > 0.05, we do not reject the hypothesis H0 at 5% level of significance. That is, the fitted reduced model is adequate.
Consequently, the final logistic regression model can be written in the form of,
( ) (
) (
) (
)
logit π = −0.064198 age∗ + −0.046789 weight∗ + 0.035142 height∗ (9)
where, logit
( )
π =loge{
π 1−π}
is the log odds ratio of having normal birth.The interpretation of the final model:
DOI: 10.4236/ojs.2018.82020 326 Open Journal of Statistics
4. Conclusion
In this research, we have performed a statistical analysis to identify the most in-fluential variables on the Type of birth using the data obtained from the Anu-radhapura Teaching Hospital. Logistic regression was applied to model the data and the maximum likelihood estimation technique is used to estimate the para-meters of the reduced logistic regression model. Results reveal from this study, that the variables Mother’s Age, weight and Height are more influential to Type of birth. Further, it was observed that there is no interaction among the levels of identified influential variables “Mother’s Age”, “weight”, and “height”. More-over, the overall significance of the fitted reduced model is tested using chi square test. Further, the marginal independence of the selected variables on the response Type of birth is also checked by performing chi-square test.
References
[1] Goonewardene, M., Kumara, D.M.A., Arachchi, D.R.J., Vithanage, R. and Wije-weera, R. (2012) The Rising Trend in Caesarean Section Rates: Should We and Can We Reduce It? SriLanka Journal of Obstetrics and Gynaecology, 34, 11-18.
https://doi.org/10.4038/sljog.v34i1.4816
[2] Gunasekera, P.C., Goonewardene, I.M.R. and Wijesinghe, P.S. (2001) The Caesa-rean Section Rate Is Rising. Ceylon Medical Journal, 46, 147-150.
[3] Kumara, D.M.A. and Perera, H. (2009) Evaluation of Six Commonly Used Formu-lae for Sonographic Estimation of Fetel Weight in a Srilankan Population. SriLanka Journal of Obstetrics and Gynaecology, 31, 20-33.
[4] Bertran, A.P., Merialdi, M., Lauer, J.A., Wang, B.S., Thomas, J., Van Look, P. and Wagner, M. (2007) Rates of Caesarean Section: Analysis of Global, Regional and National Estimates. Paediatric Perinatal Epidemiology, 21, 98-113.
https://doi.org/10.1111/j.1365-3016.2007.00786.x
[5] Lumbiganon, P., Laopaiboon, M., Gulmezoglu, A.M., Souza, J.P., Taneepanichskul, S., Ruyem, P., Attygalle, D.E., Shrestha, N., Mori, R., Nguyen, D.H., Hoang, T.B., Rathavy, T., Chuyun, K., Cheang, K., Festin, M., Udomprasertgul, V., Germar, M.J., Yanqiu, G., Roy, M., Carroli, G., Ba-Thike, K., Filatova, E. and Villar, J. (2010) Me-thods of Delivery and Pregnancy Outcomes in Asia: The WHO Global Survey on Maternal and Perinatal Health 2007-2008. Lancet, 375, 490-499.
https://doi.org/10.1016/S0140-6736(09)61870-5
[6] Fernando, L. and Abeywardene, M. (1992-1993) Trends in Caesarean Section. Sri-Lanka Journal of Obstetrics and Gynaecology, 16, 14-20.
[7] Goonewardene, M. and Gunaratna, K.A. (2001) Why Are the Caesarean Section Rates Rising? SriLanka Journal of Obstetrics and Gynaecology, 23, 20-27.
[8] Renuraj, S., Varathan, N. and Satkunananthan, N. (2015) Factors Influencing Traf-fic Accidents in Jaffna. Sri Lankan Journal of Applied Statistics, 16, 117-133.