© 2019, IRJET | Impact Factor value: 7.34 | ISO 9001:2008 Certified Journal
| Page 763
DYNAMIC VOLTAGE RESTORER FOR VOLTAGE SAG/SWELL
MITIGATION
Vivekkumar Alpeshbhai Patel
1, Jackson K Prajapati
2, Manisha Patel
3,
Ashishkumar Kanaiyalal Gamit
41,2,3,4
Assistant Professor, Electrical Engineering Department, MSCET, Surat
---***---Abstract -
With increase quantity of power electronicsdevice in the electrical system cause power quality problem. Various power quality disturbances are Voltage transients, voltage sag, voltage swell, harmonics etc. In order to mitigate voltage sag/swell problem various custom power devices are used. Dynamic Voltage Restorer is most economical and efficient Custom power device for mitigation voltage sag/swell. The principle of the DVR is utilized to inject the voltage in series and in synchronism with the standard voltages with a goal to compensate voltage influences. There are various control techniques used for the operation of Dynamic Voltage Restorer. This paper presents the Discrete PWM technique Using PI controller, Hysteresis voltage controller, Hysteresis current controller, for sensing the voltage sag and generation of switching pulses of inverter of dynamic voltage restorer. Discrete PWM-based control scheme is implemented to compensate the voltage sag/swell in test system. Control scheme are configured to maintain a constant voltage magnitude at the sensitive load point. In this DVR control system an error signal is obtained by comparing the reference voltage with the RMS voltage measured at the load point.
Key Words: Dynamic Voltage Restorer; voltage sag; PWM technique; Hysteresis voltage controller; Hysteresis current controller
1. INTRODUCTION
Recent technological advancement lead to a rapid growth in number of nonlinear load present in the power distribution system which adversely affect the quality of power supply. This nonlinear load distorts the supply voltage waveform. This result in power quality disturbances.[1] Most industries are depended on the electronic drives and Programmable logic controller which causes problems like Voltage sag, voltage swell, harmonics, flicker, voltage transient etc.
1.1 Solutions for power quality problems
Power Quality problems can be mitigating by installing a system at consumer side or utility side. A device installed at consumer side is used when the equipment is less sensitive to power disturbances. And device installed at utility side can suppress or counteracts the disturbances. For power quality improvement major role played by utility side solution.
Shunt Controllers:
Shunt devices are effective to compensate small voltage variation, which can be controlled by reactive power injection. The compensation of a voltage Sag by current injection is very difficult to achieve, because the supply impedance are usually low and the injected current has to be very high to increase the load voltage.
Series Controller:
The series controllers for control of the fundamental voltage are termed as a series connected PWM regulator, a static series regulator, but mostly the devices are termed dynamic voltage restorers. The supply continues to be connected and no resynchronization is necessary as it is the case with the shunt connected converter.
Load
V supply V load
I supply I load
I shunt Z supply
-+ +
-I series
(a)
Load
V supply V load
I supply I load
I shunt Z supply
-+ +
-I series
(b) Figure 1.1: (a) Shunt-Series controller (b) Series-shunt
Controller [4]
Combined shunt and series controllers:
© 2019, IRJET | Impact Factor value: 7.34 | ISO 9001:2008 Certified Journal
| Page 764
Most important the energy storage can be significantlyreduced with unified approaches.
1.2 Dynamic Voltage Restorer
Most economical and efficient custom power device for compensation of disturbances like voltage sags is Dynamic Voltage Restorer used in power system network. DVR is connected in series at point of common coupling. Custom power device that injects voltage into the system to regulate the load side voltage. DVR is installed in series between the supply and the critical load feeder at the point of common coupling (PCC). Location of DVR is shown in Figure 1.2. Other than voltage sags and swells compensation, DVR can also added other features like: line voltage harmonics compensation, reduction of transients in voltage and fault current limitations.
Load 1
DVR Sensitive Load Step down
transformer Step down
transformer Step down transformer
AC source
[image:2.595.53.286.297.435.2]Distribution Line
Figure 1.2: Location of DVR
1.3 Basic Configuration of DVR
The general configuration of the DVR consists of:
A. An Injection transformer
B. A Voltage Source Converter (VSC) C. Storage Devices
D. A Control and Protection system
Injection transformer
VL
Vs
Source
VSC Filter
Control Circuit
Vinj
Load
Figure 1.3: Schematic diagram of DVR
1) Injection/ Booster transformer:
For injection purpose three phase transformer is used. The injection transformers have two side namely high voltage side and low voltage side. At low voltage side DVR is connected while high voltage side is connected in series with distribution network. The main function of the injection transformer is to inject the voltage generated by VSI. Injected transformer are also used to isolating the DVR circuit from the distribution network.[5]
2) Voltage Source Converter:
Inverter is used in DVR to convert the DC voltage supplied by the energy storage device into an AC voltage. Voltage source inverter (VSI) of low voltage and high current with step up injection transformer is used for this purpose in the DVR compensation technique Generally Pulse-Width Modulated Voltage Source Inverter (PWMVSI) transformer is used. Thus a VSI with a low voltage rating is sufficient.[5][6]
1.3 Voltage injection methods of DVR
There are four different methods of DVR voltage injection which are
Pre-sag compensation method
In-phase compensation method
Voltage tolerance method with minimum energy injection
In-phase advanced compensation method
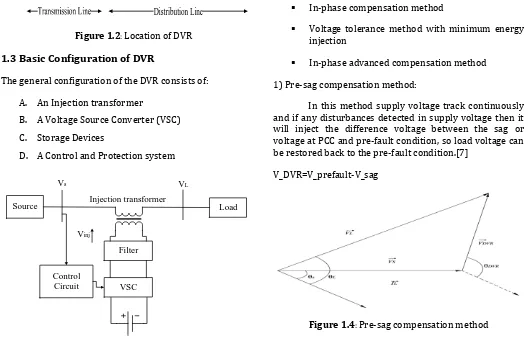
1) Pre-sag compensation method:
In this method supply voltage track continuously and if any disturbances detected in supply voltage then it will inject the difference voltage between the sag or voltage at PCC and pre-fault condition, so load voltage can be restored back to the pre-fault condition.[7]
[image:2.595.35.563.414.754.2]V_DVR=V_prefault-V_sag
© 2019, IRJET | Impact Factor value: 7.34 | ISO 9001:2008 Certified Journal
| Page 765
2) In-phase compensation method: [image:3.595.52.277.152.270.2]Injected voltage is in phase with the supply side voltage in this method which are irrespective of the load current and pre-fault voltage.
[image:3.595.308.540.225.551.2] [image:3.595.60.273.527.631.2]Figure 1.5: In-phase compensation method The phase angles of the pre-sag and load voltage are different but the most important criteria for power quality that is the constant magnitude of load voltage are satisfied.[7]
|V_L |=|V_prefault |
3) Voltage tolerance method with minimum energy injection:
A small drop in voltage and small jump in phase angle can be tolerated by the load itself. If the voltage magnitude lies between 90%-110% of nominal voltage and 5%-10% of nominal state that will not disturb the operation characteristics of loads. Both magnitude and phase are the control parameter for this method which can be achieved by small energy injection.[7]
Figure 1.6: Voltage tolerance method with minimum energy injection
2. COMPENSATION TECHNIQUE
2.1 Discrete PWM-Based Control Scheme
To compensate the voltage sag/swell in test system a discrete PWM-based control scheme is implemented. Control scheme are configured to maintain a constant voltage magnitude at the sensitive load point.
In this DVR control system an error signal is obtained by comparing the reference voltage with the RMS voltage measured at the load point. The PI controller processes the error signal and generates the required angle δ to drive the error to zero, for example the load RMS voltage is brought back to the reference voltage.[8] Basic Block Diagram shown in Figure 2.1.
The modulating angle δ or delta is applied to the PWM generators in phase A, whereas the angles for phase B and C are shifted by 240° or -120° and 120° respectively.
V_a=sin(ωt+δ) (2.1)
V_b=sin(ωt+δ+2π⁄3) (2.2)
V_c=sin(ωt+δ+4π⁄3) (2.3)
Line Voltage
V
abcConvert into Magnitude
Rated Voltage
V
ratedCompare
Control Error Signal
Convert To
V
abcGenerate Signal To PWM
Convert To DC to AC
Inject Voltage by Injection Transformer
Figure 2.1: Block Diagram of Control scheme using PWM generator
2.2 Synchronous reference frame:
2.2.1 Voltage Control Method:
© 2019, IRJET | Impact Factor value: 7.34 | ISO 9001:2008 Certified Journal
| Page 766
Line Voltage Vabc
Convert To DQ0
Vref to DQ0
Compare
Control Error Signal
Convert To Vabc
Generate Signal using HB
Convert To DC to AC PLL
[image:4.595.49.271.81.291.2]Inject Voltage by Injection Transformer
Figure 2.2: Basic Block Diagram of Hysteresis Voltage Control technique
The dq0 method gives the information of the depth (d) and phase shift (q) of voltage sag with start and end time. The load voltage is transformed to Vd, Vq and V0 based on park transformation according equations
(V_d )=2/3[V_a cosωt+V_b cos(ωt-2π/3)+V_ccos(ωt-2π/3) ] (V_q )=2/3[V_a sinωt+V_bsin(ωt-2π/3)-V_c sin(ωt-2π/3) ] (V_0)=[V_a+V_b+V_c]⁄3
2.2.3 Current Control method:
In a hysteresis controller, the hysteresis comparators are used to impose hysteresis around the reference current. Among all current control techniques, the hysteresis controller is widely used because of its simplicity of implementation and fast response current loop.[9]
Line Voltage Vabc
Convert To DQ0
Vdc
Generate Signal using HB
Convert To DC to AC PLL
Inject Voltage by Injection Transformer
Vref
Compare
Control Error Signal
Product
Compare Iabc
Figure 2.3: Basic Block Diagram of Hysteresis Current Control technique
2.3 Hysteresis Controller
Hysteresis voltage principle is shown in Figure 2.4. It compare the output voltage V0 with tolerance limits (VH,VL) around the reference voltage Vref .No switching occurs when output voltage V0 is between upper limit VH and lower limit VL and when the output voltage crosses to pass the upper limit the output voltage is decreased. Reference voltage is compared by the Output voltage of DVR to generate the switching pluses of the IGBT’s of the VSC. In hysteresis control, each phase is regulated independently. Difference between VH and VL is called hysteresis band (h=VH -VL). The quality of the DVR and load voltage is measured by term Total Harmonic Distortion (THD), Which is given as
THD(%)=100×(∑_(k=2)^nV_k)/V_1
Where,
k is the harmonic order.
n is the total number of harmonics.
[image:4.595.315.558.375.531.2]V1 is the fundamental component of the voltage.
Figure 2.4: Principle of Hysteresis Voltage Control
3. SIMULATION AND RESULT
[image:4.595.40.283.543.749.2]© 2019, IRJET | Impact Factor value: 7.34 | ISO 9001:2008 Certified Journal
| Page 767
VSC Δ Δ
Δ
Δ Δ
Υ Υ
Υ
Υ Υ Υ Υ
115/11 KV 115/11 KV
11/115/115 KV
11KV/440 V 11KV/440 V
3 Phase Fault Impedance
Impedance
Impedance
Impedance
Contorller
Load 1 Load 2
[image:5.595.39.292.84.278.2]AC
[image:5.595.312.558.308.422.2]Figure 3.1: Basic Diagram of Test System Table -1: System Parameter used in Simulation
Sr.
No. System Quantities Standards
1 Three Phase Source 11kV, 50Hz
2 Step Transformer Up Y/Δ/Δ, 11/115/115kV
3 Transmission Line Parameters R=0.001Ω, L=1.33𝜇𝐻
4 Step Transformer Down Δ/𝑌, 115/11 kV,
Y/Y , 11kV/440V
5 Linear Parameters Load R=45Ω, L=15mH
6 Non-linear Parameter Load R=20 Ω, L= 11mH
7 Inverter IGBT pulse,Carrierfrequency=1080Hz,Sbased, 3 arms, 6
ample time=5𝜇s
8 PI Controller KP=0.5,Ki=50,Sample time=50𝜇s
9 DC Voltage Source 2000V
10 Injection/Linear/Isolation Transformer 1:1 turns ratio, 440/440V
3.1Simulation and Result
3.1.1 Distribution System in normal condition:
[image:5.595.30.296.328.626.2]When the system in normal condition. No power quality disturbances are occurred. Obtained output voltage waveform is sinusoidal in nature. Simulation shown in Figure 3.2 and Output Voltage waveform shown in Figure 3.3.
Figure 3.2: Simulation diagram of normal system
0 0.05 0.1 0.15 0.2 0.25 0.3 0.35
-500 0 500
Time(sec)
Vo
lta
ge
(V
)
Figure 3.3: Output Voltage of Normal System
3.1.2 Source and Load with Three Phase Balanced
Fault:
Now a three phase balance fault is applied at the distribution side. Simulation shown in Figure 3.4. Value of fault resistance is 0.004Ω for a time interval of 0.3s.for a time period of 0.1s to 0.3s the fault is applied and the voltage sag condition is created. Here the output voltage of voltage sag is shown in Figure 3.5.
[image:5.595.325.568.579.732.2]© 2019, IRJET | Impact Factor value: 7.34 | ISO 9001:2008 Certified Journal
| Page 768
0 0.05 0.1 0.15 0.2 0.25 0.3
-500 0 500
Time(Sec)
Vo
lta
ge
(V
[image:6.595.319.573.88.206.2])
Figure 3.5: Output Voltage When Fault occur In the System
3.1.3 Voltage Sag Compensation using PWM
Scheme Using PI Controller:
3.1.3.1Discrete Sequence Analyzer for sense
Voltage Disturbance
[image:6.595.62.263.90.206.2]DVR is controlled by using discrete PWM scheme using PI controller. Simulation shown in Figure 3.6.Fault resistance is 0.004Ω for time duration of 0.2s. For a time interval of 0.1s to 0.3s. Voltage sag condition is created in the system. Voltage disturbance can be sensed by the phase sequence analyzer and error can be mitigating using PI controller. MATLAB simulation of control scheme is shown in figure 3.7. Firing angle control scheme shown in Figure 3.8. Output voltage is shown in Figure 3.9.
Figure 3.6: Simulink diagram of DVR with PWM scheme using PI Controller
Figure 3.7: Control Scheme of PWM scheme using PI Controller
Figure3.8: Firing Angle Controller Scheme
0 0.05 0.1 0.15 0.2 0.25 0.3 0.35
-500
0 500
V
s
u
p
p
ly
0 0.05 0.1 0.15 0.2 0.25 0.3 0.35
-50 0 50
V
D
V
R
0 0.05 0.1 0.15 0.2 0.25 0.3 0.35
-500
0
500
Time(Sec)
V
lo
a
[image:6.595.337.547.254.440.2]d
Figure 3.9: Output voltage of DVR with PWM Scheme using PI controller
3.1.3.2 Park transformation method used for
sense voltage disturbance
Voltage disturbance can be sensed by DQ0 conversion and then pulses generated. Control scheme for this method is shown in Figure 3.10.
[image:6.595.58.276.426.554.2] [image:6.595.52.293.601.732.2]© 2019, IRJET | Impact Factor value: 7.34 | ISO 9001:2008 Certified Journal
| Page 769
Here is a control scheme of Park Transformation [image:7.595.317.571.76.281.2]technique as shown in Figure 3.11. And Output Waveform are shown in Figure 3.12.
Figure 3.11: Control scheme Using Park Transformation
0 0.05 0.1 0.15 0.2 0.25 0.3 0.35
-500 0 500
V
s
uppl
y
0 0.05 0.1 0.15 0.2 0.25 0.3 0.35
-100 0 100
V
D
V
R
0 0.05 0.1 0.15 0.2 0.25 0.3 0.35
-500 0 500
Time(Sec)
V
L
oa
[image:7.595.45.283.145.282.2]d
Figure 3.12: Output voltage of DVR with PWM Scheme Using PI controller
3.1.4 Voltage Sag Compensation using Hysteresis
Voltage Control Method
[image:7.595.319.557.325.516.2]Now Hysteresis voltage control method is used for mitigation of voltage sag .voltage sag condition created by applying three phase fault by taken a fault resistance of 0.004Ω and time interval is 0.2s. For time periods of 0.1s to 0.3s voltage sag is created. Hysteresis controller method is used to generate pulses for VSI. Output voltage waveform is as shown in Figure 3.13. Figure 3.14 shows the simulation of hysteresis controller for pulses generation. And Figure 3.15 shows control method of hysteresis voltage control.
Figure 3.13: Simulation Diagram of DVR using Hysteresis Voltage Controller
Boolean NOT Double
Boolean NOT
Boolean
Double
NOT Double
VABC*
VABC
Pulses
+
-+
-+
-Figure 3.14: Hysteresis Controller Scheme
[image:7.595.46.267.337.514.2] [image:7.595.326.553.573.713.2]© 2019, IRJET | Impact Factor value: 7.34 | ISO 9001:2008 Certified Journal
| Page 770
Time(Sec)0 0.05 0.1 0.15 0.2 0.25 0.3 0.35
-500 0 500 V s uppl y
0 0.05 0.1 0.15 0.2 0.25 0.3 0.35
-100 0 100
V D
VR
0 0.05 0.1 0.15 0.2 0.25 0.3 0.35
-500 0 500 V L oa d
Figure 3.16: Output Voltage of DVR with Hysteresis Controller
3.1.5 Voltage Sag compensation using Current
Control Method:
[image:8.595.54.292.97.258.2]Hysteresis voltage control method is used for mitigation of voltage sag .voltage sag condition created by applying three phase fault by taken a fault resistance of 0.004Ω and time interval is 0.2s. For time periods of 0.1s to 0.3s voltage sag is created. Hysteresis controller method is used to generate pulses for VSI. Output voltage waveform is as shown in Figure 3.17.
Figure 3.17: Simulation of Hysteresis Current control method
0 0.05 0.1 0.15 0.2 0.25 0.3 0.35
-500 0 500
V su
pply
0 0.05 0.1 0.15 0.2 0.25 0.3 0.35
-100 0 100
V D
VR
0 0.05 0.1 0.15 0.2 0.25 0.3 0.35
-500 0 500 Time(Sec) V Lo ad
Figure 3.18: waveform Of Hysteresis Current Control technique
[image:8.595.324.560.126.219.2]Control scheme of current control method is shown in Figure 3.19.
Figure 3.19: Control technique
3.1.6 THD analysis of nonlinear load:
0 2 4 6 8 10
0 5 10 15
Harmonic order
Fundamental (50Hz) = 36.17 , THD= 28.95%
M ag (% of Fu nd am en ta l)
Figure 3.20: THD for Discrete PWM technique Using PI Controller
0 2 4 6 8 10
0 5 10 15
Harmonic order
Fundamental (50Hz) = 36.14 , THD= 29.07%
M ag (% of Fu nd am en ta l)
Figure 3.21: THD for Hysteresis Voltage Control method
0 2 4 6 8 10
0 5 10 15 20
Fundamental (50Hz) = 31.63 , THD= 31.86%
M ag (% of Fu nd am en ta l)
Figure 3.22: THD for Hysteresis Current Control technique
Table 2: THD Comparison
Discrete PWM technique using PI controller Hysteresis voltage controller Hysteresis Current Controller
[image:8.595.49.292.444.565.2]© 2019, IRJET | Impact Factor value: 7.34 | ISO 9001:2008 Certified Journal
| Page 771
3. CONCLUSION
This paper shows the basic configuration of Dynamic Voltage Restorer and its topology and various control techniques. The existing topologies and its control techniques applied to DVR have been explained with detail. The design and applications of DVR for voltage sag and comprehensive results were presented. Two control techniques are used as in-phase compensation and pre-sag compensation. For gate pulse generation two methods are discrete PWM techniques using PI controller and Hysteresis voltage controller discussed. MATLAB/SIMULINK model of discrete PWM technique using PI controller, Hysteresis Voltage controller technique, and Hysteresis current controller technique used for mitigate voltage sag. The simulation result and THD analysis shows clearly the performance of the DVR in mitigating voltage sag.
REFERENCES
[1] P. Roncero-Sánchez, E. Acha, J. E. Ortega-Calderon, V. Feliu, and A. García-Cerrada, “A versatile control scheme for a dynamic voltage restorer for power-quality improvement,” IEEE Trans.Power Del., vol. 24, no. 1, pp. 277–284, Jan. 2009.
[2] Roger C. Dugan, Electrical Power Systems Quality, Editorial McGraw-Hill, 1996.
[3] A. Ghosh and G. Ledwich, Power Quality Enhancement Using Custom Power Devices, Kluwer Academic Publishers, 2002.
[4] P. Wang, N. Jenkins, and M.H.J. Bollen. Experimental Investigation of Voltage Sag mitigation by an advanced static Var compensator. IEEE Transactions on Power Delivery, Vol. 13, No. 4, pp. 1461 – 1467, 1998.
[5] C.Benachaiba and B.Fedri, “Voltage Quality Improvement Using DVR”, electrical Power Quality and Utilization Journal Vol. XIV, No.1, pp.39-45, 2008.
[6] Rosli Omar, N.A. Rahim and Marizan Sulaiman. “Dynamic Voltage Restorer Application for Power Quality Improvement in Electrical Distribution System: An Overview” Australian Journal of Basic and Applied Sciences, 5(12): 379-396, 2011.
[7] John Godask Nielsen and Frede Blaabjerg, “Control Strategies for Dynamic Voltage Restorer Compensating Voltage sag with Phase Jump”, IEEE transaction on industry application, volume-41, No. 5, September/October 2005.
[8] H.P.Tiwari and S.K.Gupta, “Dynamic Voltage Restorer against Voltage Sag”, International Journal of Innovation, Management and Technology, vol.1, pp.232-237, August 2010.
[9] S.Saravanan, M.Solaimanigandan, T.Tharaneetharan, V.Varunraj,S.Parthasarathy, “Dynamic Voltage Restorer for Distribution System”, International Journal of Engineering Research and Development, Volume 7, Issue 1 , PP. 14-24, may 2013.
[10] Rosli Omar, N.A. Rahim and Marizan Sulaiman. “Dynamic Voltage Restorer Application for Power Quality Improvement in Electrical Distribution System:An Overview” Australian Journal of Basic and Applied Sciences, 5(12): 379-396, 2011.
BIOGRAPHIES
Vivek Patel is working as an Assistant Professor in Electrical Department at Mahavir swami college of Engg & Tech,Surat from last 4 year.
Jackson Prajapati is working as an Assistant Professor in Electrical Department at Mahavir swami college of Engg & Tech,Surat from last 7 year.
Manisha Patel is working as an Assistant Professor and HOD of Electrical Department at Mahavir swami college of Engg & Tech,Surat from last 7 year.