Salient Object Detection via Combining Duplex Features
Sai Zhong
School of Information and Mathematics, Yangtze University
School of Information and Mathematics, East Campus of
Yangtze University, Nanhuan Road, Jingzhou, Hubei Province
Yue Hu
Student Work Department, Yangtze University
Kaili Tu, School of Information and mathematics, Yangtze University
Haiyang Wang
College of Animal Scientist, Yangtze University
ABSTRACT
The salient object detection aims to predict the most eye-catching objects in an image. The existing salient object detection methods only rely on the single color difference and cannot predict the complete results. In this paper, a novel method is proposed for salient object detection. The proposed method combines SLIC super-pixel segmentation and K-Means clustering algorithm to extract image features. Firstly, SLIC segmentation is performed to obtain the color contrast feature map based on the color difference between the pixel blocks. Secondly, K-Means cluster is carried out according to the color feature. After the K-Means cluster, several classes are obtained by features in LAB space. Then, the initial color space distribution feature map of each class is calculated according to the spatial distribution compactness and the color distribution uniformity. Considering that the clustering results do not contain spatial information, this paper maps the clustered results into the super-pixel segmented pixel blocks to further optimize the color space distribution feature map. Finally, the ultimate saliency map is acquired by fusion the color contrast feature map and the color contrast feature map. Extensive experiments are conducted on ECSSD dataset and the experiment results show the proposed method can achieve state-of-the-art performance.
General Terms
Pattern Recognition, Deep Learning
Keywords
Salient Object Detection, SLIC Super-Pixel Segmentation, K-Means Clustering, Color Contrast, Color Spatial Distribution.
1.
INTRODUCTION
The salient object detection is to mark the most attractive objects of the image that contain richest information. The salient object detection has been applied in the fields of image segmentation [1], image compression [2], image retrieval [3], object recognition [4], image understanding [5]. At the same time, the rapid development of information technology has also made a large number of images as information carriers. Faced with such a huge image resource, how to quickly and accurately retrieve the information that people want to pay attention to is an extremely important issue. Research [6, 7] found that the human visual system has visual selectivity. When faced with a complex scene, humans can automatically process the region of interest and selectively ignore other regions. The human visual attention mechanism is mainly divided into two types: 1) the bottom-up strategy attention mechanism and 2) the top-down strategy attention mechanism. As for the former mechanism, the color, brightness, edge and other features are extracted to computed the difference between the central area and the surrounding
area, and the computed difference is treated as contrast feature for predicting saliency map. On the contrary, the latter mechanism is driven by the specific task. Specifically, the saliency map is predicted by extracting particular feature of the image, which is independent on the data.
the extension of the image saliency problem. Lin et al. [18] proposed to improve the saliency detection method of the existing Bayesian model, which is leveraged to solve the
[image:2.595.88.509.106.244.2]accuracy problem of the current saliency detection algorithm and improve the visual effect of the saliency map.
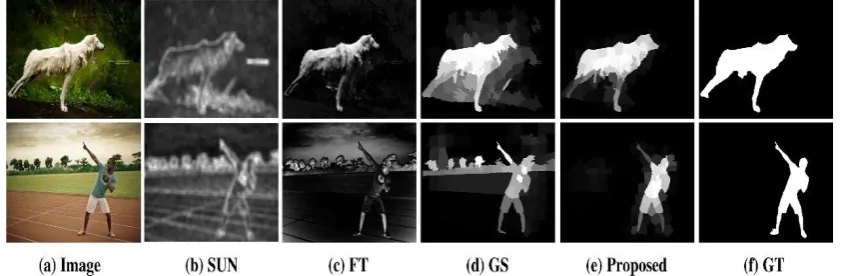
Fig. 1 Saliency maps of several existing methods and the proposed method. (a) the original images; (b) the SUN method; (c) the FT method; (d) the GS method; (e) the proposed method; (f) the ground truth.
With the rapid development of deep learning in recent years, some methods have been applied to apply deep learning for image saliency detection [19-21]. These methods need to be trained on a large number of images for a long time to obtain better saliency results. Most of the bottom-up methods are based on pixels, which predict the saliency map by the difference between pixels.
The FT [13] methods performs simple addition and subtraction in the matrix of pixels. The operation time complexity is O (N) (N refers to the number of pixels). To calculate the difference between a pixel and all other pixels, the time complexity will suddenly rise to O (N*N). In order to improve the effect of the method, researchers often make a plurality of pixels into one pixel block, and detect the salient area of the image by the difference between the pixel blocks. Ren [22] and Cheng [14] predict the saliency map using similar colors and their distances for each block. The K-Means clustering method [23] ignores the distance between pixels and divides the image into several classes that are similar in one or a few features, so that each class in the clustering result has similar feature. There is also a super-pixel segmentation method implemented by SLIC (Simple Linear Iterative Clustering) [24]. The SLIC method can divide the image into several super-pixels with uniform texture according to the color and spatial position. The time complexity can be reduced to O(m*m) (m refers to the number of super pixels, m << N) using the super-pixel to replace the pixel points for calculating the difference. Yang [25] improved the speed of the method by using SLIC for super-pixel segmentation.
According to the above introduction, we can find that the existing salient object detection methods face with two main challenges: 1) the results of the salient object detection are incomplete, and 2) some salient regions with similar background colors cannot be detected. To resolve these challenges, a novel salient object detection method is proposed. The proposed method combines both the color contrast and color space distribution features based on super pixel segmentation and clustering. Firstly, SLIC segmentation is performed on the image, and the color contrast feature map is obtained based on the color difference between the pixel blocks. Secondly, K-Means cluster is carried out for the image according to the color feature. After the K-Means cluster, several classes are obtained on the basis of features in LAB space and the initial color space distribution feature map of each class is calculated according to the spatial distribution
compactness and the color distribution uniformity. Considering that the clustering results do not contain spatial information, this paper maps the clustered results into the super-pixel segmented pixel blocks to further optimize the color space distribution feature map. Finally, the ultimate saliency map is acquired by fusion the color contrast feature map and the color contrast feature map. The proposed method has the time complexity of O(m*m+n*n) (m refers to the number of super-pixels, n refers to the number of cluster seeds). In addition, the proposed method is simple, easy to implement, and has a state-of-the-art result. What’s more, the proposed method also has obvious improvements to the shortcomings of the above-mentioned classical algorithms, as shown in Fig. 1. The non-salient regions detected by the color contrast map can be corrected using the color space distribution to obtain an accurate saliency map.
The rest of the paper is arranged as follows: Section 2 briefly introduces the related knowledge involved in the method. In Section 3, we present our proposed salient object detection method. Section 4 gives the experiment results of the proposed method. Finally, Section 5 conclude the paper.
2.
RALATED WORK
In this paper, the image filtering algorithm, K-means clustering algorithm and SLIC super-pixel segmentation algorithm are used to detect the image saliency. In this section, the related knowledge involved in the proposed method is briefly introduced.
2.1
Smoothing Filter
Smoothing filtering is a kind of spatial domain filtering technology that enhances low frequency. Smoothing filtering in spatial domain generally adopts simple averaging operation to obtain the average color value of adjacent pixels in image processing.
The size of the neighborhood is directly related to the smoothing effect. The larger the neighborhood, the better the smoothing effect. However, when the neighborhood is too large, the smoothness will cause the edge information
2.2
K-Means Clustering Algorithm
The clustering algorithm can divide the image into several classes that are similar in one or a few features to process the data efficiently. The basic principle of cluster analysis is to make the features of data in the same class are similar, and the features of data in the different classes are not similar. K-Means clustering algorithm is one of the most widely used algorithms in many clustering algorithms for its simple algorithm, easy implementation and good clustering convergence. The K-Means clustering algorithm divides the data into K classes. Each class ck has a cluster center i. The clustering process is to continuously calculate and update the cluster center. The distance between the data and the cluster center is:
2
( )
i k
k i k
x c
J c x
, (1) [image:3.595.58.281.289.473.2]where xi is the data point in the class and k is the cluster center.
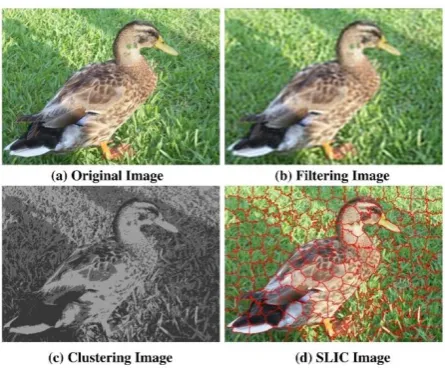
Fig. 2 Results of each step: (a) the original image; (b) the filtering image; (c) the clustering image; (d) the SLIC
segmentation result.
In this paper, the color features of the image are used for clustering. The color features refer to the three components of L, A and B in the CIE LAB color space.
2.3
SLIC super-pixel segmentation
Super-pixels can represent images in a relatively simple format and reduce image redundancy. Since each super-pixel block has the same properties, super-pixel meshes are more useful than pixel meshes in salient object detection. In the method of this paper, super-pixel image segmentation is used as the basic preprocessing. Firstly, the image is divided into different sizes of pixel blocks. Secondly, the saliency of each pixel block is computed. Finally, we generate the final saliency map based on the image pixel. In this paper, the SLIC super-pixel segmentation algorithm is adopted.
SLIC is a simple linear iterative segmentation algorithm based on the Means clustering. Differently, the search space of K-Means is the whole image, while the search space in SLIC is limited to the area proportional to the super-pixel size. Therefore, SLIC is faster to cluster than K-Means. The algorithm performs local clustering based on the five-dimensional feature vector composed of CIE LAB color space and two-dimensional coordinates (x, y) of the image [24]. The
main process is: 1) initialize the seed according to the required number of super-pixel partitions K and calculate the distance between the super-pixels, where the initial distance is defined as S (N K/ ); 2) the pixels are searched and clustered in the 2S*2S region; 3) perform the iterative optimization for 10 times to get the ideal segmentation result. The distance metric includes color distance and spatial distance. The calculation methods of the two distances are as follows:
2 2 2
( ) ( ) ( )
c j i j i j i
d l l a a b b , (2)
2 2
( ) ( )
s j i j i
d x x y y , (3)
2 2
( c) ( s)
c s
d d
D
N N
, (4)
where dc represents the color distance of the j-th super-pixel and the i-th super-pixel; l , a and b are the three channel variables in the CIE LAB color space; ds represents the spatial distance of the j-thsuper-pixel and the i-thsuper-pixel;
c
N is the maximum color distance, which is generally taken as 10; Nsis the maximum distance between seeds, and is set
to NsS.
The SLIC algorithm can effectively segment the image into super-pixel blocks with different sizes and shapes but similarly uniform. Fig. 2(d) shows the segmentation result using the SLIC algorithm. It can be seen from the figure that the boundary of the super-pixel block is largely close to the boundary of the object in the original image. Meantime, each super-pixel block not only contains the color, direction, and brightness information of the bottom layer, but also contains structural information of the entire image. The use of super-pixel blocks as a basic unit for salient object detection can ensure the accuracy of object boundary calculations.
3.
ROPOSED METHOD
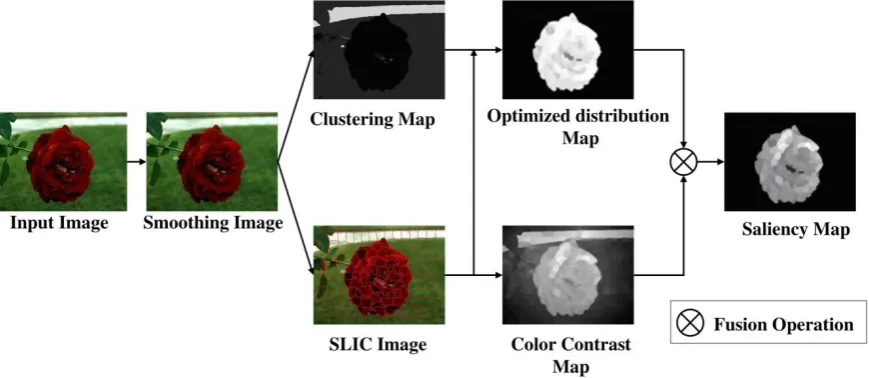
The proposed salient object detection method mainly includes three steps: 1) color contrast calculation, 2) color space distribution calculation and 3) saliency map fusion. For the image to be detected, we first use the smoothing filtering technique in Section 2.1 to smooth the image, and then calculate the saliency map of the smoothed image. The flow chart of the proposed method is shown in Fig. 3. It is worth noting that both the proposed method and the method in [26] preprocess the image with super-pixel segmentation. Differently, the method in [26] adopts the algorithm of super-pixel generation based on region covariance, which treats the covariance matrix between regions as a feature, so that the final saliency map is predicted by combining pixel blocks and pixel points and the predicted saliency map are incomplete in details.
3.1
Color Contrast Calculation
Pixel is the basic unit of image and whether it is located in the saliency area depends on the difference between the pixel and its surrounding environment. The greater the difference, the more likely it is located in the saliency area. Most of existing works are based on this Color Contrast for salient object detection.
to the latter. On the basis of color contrast, the weight is adjusted by considering the Euclidean distance between pixels. In [27], the author adopts the spatial distance from the
[image:4.595.82.517.112.301.2]pixel to the center of the image so as to obtain a more accurate detection result. In this paper, we use super-pixel blocks as basic elements to improve computational efficiency.
Fig. 3 The framework of the proposed method.
Suppose the image is divided into N super-pixel blocks, and each super-pixel block is called a region. The contrast value of the defined region i is the difference between it and all other regions in the CIE LAB color space. In [28], the larger the color distance between the regions and the smaller the geometric distance, the larger the contrast value. The saliency of the region is directly proportional to the color difference and inversely proportional to the geometric distance difference. Therefore, this paper additionally considers the distance weight between regions to adjust the contrast to obtain a color contrast map. The contrast value Ri of the
region i is defined as follows:
1
( , )
N
i i j i j
j
R c c P p p
, (5)2 2 2
( ) ( ) ( )
i j i j i j i j
c c l l a a bb , (6)
2
1 1
( , ) exp( )
2
i j i j
i p
P p p p p
Z
, (7)
2 2
( ) ( )
i j i j i j
p p x x y y , (8)
where ci and cj are the vector matrices composed of l, a
and b of region i and regionj, respectively.
The norms of the two vector matrices are used to find the color contrast between regions (see Eq. 6). ( ,P p pi j) is the distance weight between region i and region j. pi and pjare
the central coordinates of the two regions (represented by x, y). The adjustment distance weight is in the form of Gaussian
function. 1
i
Z is the normalization factor that makes
1 ( , ) 1
N
i j j P p p
.In our experiment, p is set as 0.5.3.2
Color Space Distribution Calculation
The background of the image is usually distributed throughout the image, with similarity, repeatability and large proportion. The salient region of the image is one or more independent
objects different from the surrounding environment. It is relatively compact and therefore has a certain sparseness. The salient region of the color contrast map is not necessarily a real salient region. Therefore, in addition to the color contrast, we need to define a second metric for inferring the saliency map, where we choose the color space distribution. In this paper, we use K-Means clustering algorithm to divide the image into several classes according to the color features. The difference between the various classes is large, so it is easy to calculate the spatial distribution of each class. According to the spatial distribution feature of the pixels, the independent target regions are analyzed. The wider the image color space distribution is, the more likely it is the background region. The narrower the image color space distribution is, the more likely it is a salient object. For some salient objects in the center of the image, there are still compact objects around the image. This kind of object is sub-salient or non-salient. For this case, it can be removed by the central principle.
Due to the randomness of the seeds in K-Means clustering, we use regular hexagonal typesetting to enhance the robustness. The number of seeds affects the effect of clustering. In this paper, we set the number of seeds as 10. In other word, the image is divided into 10 categories or divided into 10 color components, which can reduce the amount of calculation and ensure sufficient clustering precision.
3.2.1
Preliminary Color Space Distribution
can double suppress the class with the largest degree of diffusion, enhance the saliency of the class near the center of the image, and maintain the salient object around the image. In addition, the color variance within the class can represent the similarity of colors within the class. In general, the color of the salient object is concentrated, and the high similarity of the colors within the class can improve the saliency of the class. A preliminary color space distribution map can be obtained by combining the above three features, and the color space distribution value Di of the color component i is as follows:
2 2
(exp( in out) (1 exp( c) / (2 )))
i i i i d
D V V V ,
(9) 2 ( ) ( ) i p i i p cl i in i p c V n i
, (10)2
( )
1 ( )
i
p
i j
M p cl i out i j p c V n i
, (11)2 ( ) ( ) i c i i p cl i c i c c V n i
, (12)where Viin and out i
V represent the intra-class space variance and the inter-class space variance of the color component i, respectively. Vic represents the intra-class color variance of
the color component i. cip and p j
c represent the spatially clustered center of the color component i and j . cic
represents the clustering center the color component i, which is the color mean of each channel. cl i( ) is a collection of pixel data of color component i, which can access the related pixel features. pi refers to the x coordinate and y
coordinate of each pixel belonging to the set. ci refers to the l component value, the a component value and the b component value of each pixel belonging to the set.
In the calculation process, the relevant factors are normalized. Among them, the intra-class space variance and the inter-class space variance are inversely proportional to the saliency. Therefore, we change the value range from [0,1] to [1, 0] relying on the normalization by the exponential function. The color variance within the class is proportional to the saliency. Here, the Gaussian weight is used to assign weights to the color variance within the class. In this paper, we set d2 as 5.
3.2.2
Color Distribution Optimization
After clustering the color space distribution values of each class, it is necessary to combine with the super-pixel segmentation results to optimize again. When using K-Means clustering, we only consider the color clusters distributed in the image and ignore the adjacency between colors. According to the position of each super-pixel and the preliminary color space distribution map, the value of each super-pixel is an average gray value of the corresponding position pixel point on the preliminary color space distribution map. By assigning a value to the super-pixel, we obtain a super-pixel-based color space distribution map of the same shape as the pre-segmentation in color contrast. The calculation of the preliminary distribution value Ki of each
super-pixel is given by Eq. 13. In order to optimize the super-pixel blocks that should belong to the color space distribution map, we need to calculate the color difference between each super-pixel block and its adjacent super-pixel block. The smaller the difference, the more similar the two super-pixel blocks should be, and similar grayscale should be given. By combining the preliminary distribution values in the preliminary color space distribution map, we can obtain an
optimized color space distribution map. Let Di indicate the distribution value of the region i after optimization as:
( )
( ) i
i p sl i i
c K
n i
, (13)1
( exp( ( , )) ) i
U
i i j j i
j
D C c c K K
. (14)Where pisl i( ) refers to the set of all pixels in the i-th super-pixel. ci refers to the corresponding gray value of each pixel in the set in the preliminary color space distribution map. ( )n i refers to the size of the collection. Ui refers to the number of adjacent regions of region i. ( ,C c ci j) refers to the color difference between region i and region j . For accuracy, we ignore the channel l and only calculate the difference between the channel a and channel b. The small difference shows that the initial distribution values of the two regions are similar. Ki and Kj are the preliminary
distribution values of the region i and region j, respectively.
3.3
Fusion of Saliency Maps
The result of SLIC super-pixel segmentation is a similarly uniform region, which ensures the spatial distribution of pixels within each region. The result of K-Means clustering only guarantees the similarity of the color values of the pixel points in the class, and does not consider the spatial distribution of these pixels. The optimization results of the color distribution map can better reflect the saliency of the image, but in some cases, the color distribution map cannot better reflect the saliency area of the image. Therefore, it is an effective idea to combine color distribution map and the color contrast map to better extract the saliency of the image. The proposed method combines the spatial distribution and color distribution features of the image, and fuses the color contrast map with the optimized color space distribution map to obtain the final saliency map. In fact, the proposed method can extract the salient objects of the image effectively and reduce the time complexity of the operation by a large margin. As a result, the proposed method not only amplifies the advantages of both, but also compensates for their shortcomings, which is the biggest advantage of the propose method. We normalize the calculation results of the above two to the [0,1]. The final saliency map is proportional to the color contrast map and the color space distribution map, so the saliency value Si after the fusion of the color contrast and the color space distribution maps in region i can be written as follows:
i i i
S R D. (15)
result in the final saliency map is zero. Combining the two feature maps allows the final results to be complementary.
4.
EXPERIMENT AND ANALYSIS
In order to verify the accuracy and effectiveness of the proposed method, we conduct the experiment on the public saliency dataset ECSSD. The experimental environment is an ordinary PC under Windows 7 (32 bit), the processor is XeonE3-1231 v3, 32GB memory DDR3 ECC, and the experiment is implemented with MATLAB R2014a. The experimental results of our method are compared with the
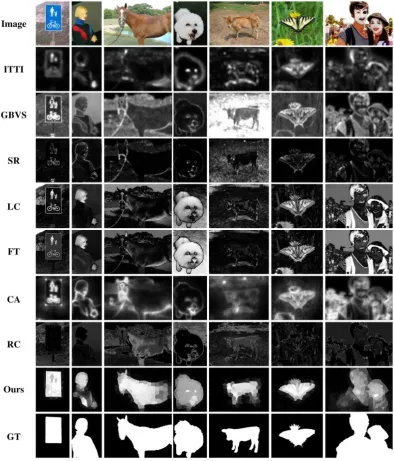
[image:6.595.104.499.189.651.2]classical ITTI [8], GBVS [9], SR [12], LC [11], FT [13], CA [28] and RC [14] methods. Fig. 4 shows the visual comparison results for different methods. It can be seen from the Fig. 4 that the proposed method has a significant improvement compared with the classical methods. The applicability of the proposed method is very wide, not only for large salient object detection, but also for salient object detection at the edge of the image. In addition, the propose method can be applied in the case of complex backgrounds, especially for the case that salient object is similar to the background color.
Fig. 4 The visual comparison results for different methods on ECSSD dataset.
To evaluate the effectiveness of the proposed method more objectively, we calculated the Precision-Recall Curve (PR) curve and the F-measure value as evaluation metrics for the above classical methods and our method. The PR curve reflects the tradeoff between the accuracy of the classifier's recognition of the positive example and the ability to cover the positive example. The ordinate is represented by Precision and the abscissa is represented by Recall.
The relevant formula is defined as follows:
TP TPR
TP FN
, (16)
FP FPR
FP TN
TP P
TP FP
, (18)
TP R
TP FN
, (19)
Among them, TP is a real class, FP is a positive class, TN is a true negative class, and FN is a false negative class.
TPRis the true positive rate. FPR is the false positive rate. P is precision, which reflects the accuracy of the salient object detection. R denotes Recall, which is the measure of coverage.
Fig. 5 The PR curves for different methods on ECSSD dataset.
The F-measure is calculated based on the precision and recall rate, which can be used for evaluating the classification method comprehensively. Formulaically, the F-measure can be written as follows:
2 2
(1 ) P R
F
P R
, (20)
where 2
3
.
In order to obtain P, R, TPR and FPR under different thresholds, the threshold is gradually increased from 0 to 255 (20 groups in total), and the mean values of P, R, TPR and FPR for each method on 1000 images are calculated. Fig. 5
shows the PR curve. To calculate the F-measure at a fixed threshold, the adaptive threshold of each salient object detection method is calculated to perform binary segmentation. The adaptive threshold of each saliency map is twice the mean of the grayscale. Fig. 7 shows the F-measure curve for each method on ECSSD dataset.
Combining the above two evaluation metrics, we can see that the proposed method is better than the other compared methods. It can be seen from Fig. 5 that the precision of the proposed method is higher in the case of the same recall rate than other compared methods. And as can be seen from Fig. 6, the precision of the RC method is not much different from the proposed method, but the recall rate is low, because the RC method can only enhance the saliency of some objects. In contrast, the proposed method can guarantee a higher recall rate while ensuring higher precision, and get a higher F-measure value than other methods. The experiment shows that the overall effect of the proposed method is the best, and it can accurately detect the salient object in the image. And the example in Fig. 1 shows that the detection results of the proposed method are significantly better than other compared
methods on images with similar background and salient objects.
Fig. 6 The F-measure for different methods on ECSSD dataset.
A comparison of the proposed method with the SF [29] method which also uses super-pixel segmentation and DeepSal [30] method which is based on deep learning is shown in Fig. 7. The salient object detection methods based on deep learning requires a large number of datasets to train the model, so they are usually more accurate than the contrast-based methods, and can detect the salient object in complex scenes. In contrast, it is obvious from Fig. 7 that the results of the proposed method can struggle to the DeepSal model based on deep learning and is far superior to the SF model used super-pixel segmentation, which further illustrates the effectiveness of the proposed method.
Fig. 7 The comparisons for recently methods on ECSSD dataset.
5.
CONCLUSION
not smooth enough. In the future work, the calculation speed of the frequency domain can be considered. In addition, we will also consider introducing spatial information into cluster segmentation to improve the accuracy of cluster segmentation results. At the same time, we will continue to explore the salient object detection method for complex scene to improve the robustness of the proposed method.
6.
ACKNOWLEDGMENTS
The authors would like to thank all the people who kindly helped us in conducting this study. This work was supported by the Social Science Foundation and Student Work Research Project of Yangtze University under Grant 2018cxy13.
7.
REFERENCES
[1] L. Li, Z. Liu, and J. Zhang, “Unsupervised image co-segmentation via guidance of simple images,” Neurocomputing, 275, 2017.
[2] M. Nejati, S. Samavi, N. Karimi, and K. Najarian, “Boosted dictionary learning for image compression,” IEEE Trans. Image Process., vol. 25, no. 10, pp. 4900-4915, 2016.
[3] R. Sarkar, and S. Acton, “SDL: saliency based dictionary learning framework for image similarity,” IEEE Trans. Image Process., 2017.
[4] H. Li, X. Su, J. Wang, H. Kan, T. Han, and Y. Zeng, “Image processing strategies based on saliency segmentation for object recognition under simulated prosthetic vision,” Artificial Intelligence in Medicine, vol. 84, 2017.
[5] V. Ramanishka, J. Zhang, and K. Saenko, “Top-down visual saliency guided by captions,” in Proc.CVPR, 2016, pp. 3135-3144.
[6] R. Desimone and J. Duncan, “Neural mechanisms of selective visual attention,” Annual Review of Neuroscience, vol. 18, pp. 193–222, 1995.
[7] S. Mannan, C. Kennard, and M. Husain, “The role of visual salience in directing eye movements in visual object agnosia,” Current Biology, vol. 19, no. 6, pp. R247–R248, 2009.
[8] L. Itti, C. Koch, and E. Niebur, “A Model of saliency-based visual attention for rapid scene analysis,” IEEE Trans. Pattern Anal. Mach. Intell., vol. 20, no. 11, pp. 1254–1259,1998.
[9] H. Jonathan, K. Christof, and P. Pietro, “Graph-based visual saliency,” in Proc.NIPS, 2006, pp. 545-552.
[10]R. Achanta, F. Estrada, P. Wils, and S. Süsstrunk, “Salient region detection and segmentation,” in Proc.ICCV, 2008, pp. 66-75.
[11]Y. Zhai and M. Shah, “Visual attention detection in video sequences using spatiotemporal cues,” in Proc. ACM International Conference on Multimedia, 2006, pp. 815-824.
[12]X. Hou and L. Zhang, “Saliency detection: a spectral residual approach,” in Proc.CVPR, 2007, pp. 1-8. [13]R. Achanta, S. Hemami, F. Estrada F, and S. Susstrunk,
“Frequency-tuned salient region detection,” in Proc.CVPR, 2009, pp. 1597-1604.
[14]M. Cheng, G. Zhang, N. Mitra, X. Huang, and S. Hu, “Global contrast based salient region detection,” in
Proc.CVPR, 2011, pp. 409-416.
[15] Y. Guo, H. Yuan, P. Wu, “Image saliency detection based on local and regional features,” Acta Automatica Sinica, vol. 39, no. 8, pp. 1214–1224, 2013.
[16] C. Chen, X. Wu, B. Wang, and L. Zhang, “Video saliency detection using dynamic fusion of spatial-temporal features in complex background with disturbance,” Journal of Computer-Aided Design & Computer Graphics, vol. 28, no. 5, pp. 802-812, 2016.
[17] J. Hu, S. He S, and L. Lv, “Placement optimization for generating bas-reliefs based on visual saliency,” Journal of Computer-Aided Design & Computer Graphics, vol. 28, no. 12, pp. 2128–2133, 2016.
[18] X. Li, Y. Wang, and H. Zhu, “Saliency detection based on the Bayesian model of improved convex hull,” Journal of Computer-Aided Design & Computer Graphics, vol. 29, no. 2, pp. 221-228, 2017.
[19] L. Wang, H. Lu, X. Ruan, and M. Yang, “Deep networks for saliency detection via local estimation and global search,” in Proc.CVPR, 2015, pp. 3183-3192.
[20] S. Kruthiventi, V. Gudisa, J. Dholakiya, and R. Babu, “Saliency unified: a deep architecture for simultaneous eye fixation prediction and salient object segmentation,” in Proc.CVPR, 2016, pp. 5781-5790.
[21] Q. Wang, W. Zheng, R. Piramuthu, “GraB: visual saliency via novel graph model and background priors,” in Proc.CVPR, 2016, pp. 535-543.
[22] Z. Ren, Y. Hu, and L. Chia, “Improved saliency detection based on super-pixel clustering and saliency propagation,” in Proc. ACM International Conference on Multimedia, 2010, pp. 1099-1102.
[23] J. MacQueen, “Some methods for classification and analysis of multivariate observations,” in Proc. BSMSP, 1967, pp. 281-297.
[24] R. Achanta, A. Shaji, and K. Smith, “SLIC super-pixels compared to state-of-the-art super-pixel methods,” IEEE Trans. Pattern Anal. Mach. Intell., vol. 34, no. 11, pp. 2274–2282, 2012.
[25] C. Yang, L. Zhang, and H. Lu, “Saliency detection via graph-based manifold ranking,” in Proc.CVPR, 2013, pp. 3166-3173.
[26] X. Zhang, Y. Lv, and Y. Miao, “Image saliency detection using regional covariance analysis,” Journal of Image and Graphics, vol. 21, no. 5, pp. 605-615, 2016.
[27] L. Duan, C. Wu, and J. Miao, “Visual saliency detection by spatially weighted dissimilarity,” in Proc.CVPR, 2011, pp. 473-480.
[28] S. Goferman, L. Zelnik-Manor, and A. Tal,“Context-aware saliency detection,” IEEE Trans. Pattern Anal. Mach. Intell., vol. 34, no. 10, pp. 1915–1926, 2012.
[29] F. Perazzi, P. Krahenbuhl, and Y. Pritch, “Saliency filters: contrast based filtering for salient region detection,” in Proc.CVPR, 2012, pp. 733-740.