International Research Journal of Engineering and Technology
(IRJET)
e-ISSN: 2395-0056Volume: 07 Issue: 01 | Jan 2020 www.irjet.net p-ISSN: 2395-0072
STUDY OF MOBILE USAGE USING CORRELATION TECHNIQUES
ROSHAN BABAJI DAFALE
Assistant Professor, Department Of Mathematics, D.B.J. College, Chiplun
S.K.Patil Nagar, Mumbai Goa Highway, D.B.J. College, Chiplun, Pin-415605
---***---Abstract -This study explores the use of mobile phones among all the age groups in Chiplun. The present review introduces methods of analyzing the relationship between two quantitative variables. The estimation of the sample product moment correlation coefficient are discussed.The usage of mobile phones is totally un-avoidable now a days and as such I have made a systematic survey through a well prepared questionnaire on making use of mobile phones to the maximum level. The results are scientifically classified and stated to match the ground reality.
Key Words: Coefficient of correlation and probable error 1. INTRODUCTION
Mobile phones are powerful communication device. In recent years, most of the world populations use smart phones thanks to its wide selection of applications. Movable is that the most dominant portal of data and communication technology. Right from a faculty going kid, a house partner to a servant, the telephone has its major impact on their lives. The expansion of mobile phones in India, |Asian country, Asian nation and specially their quality and use by teenagers in India has been the article of international and national media attention within the previous few months. Movable is that the most dominant portal of data and communication technology. The proportion of web usage additionally hyperbolic globally, the addiction behavior to mobile phones is additionally increasing.
Instead of its advantages, there are also some disadvantages of mobile phone. So it all depends on the user how he or she makes use for better living. A mental constipation resulting from modern technology has come to the attention of sociologists, psychologists, and scholars of education on mobile addiction. Mobile phone addiction and withdrawal from mobile network may increase anger, tension, depression and restlessness which may alter the physiological behavior and reduce work efficacy. Correlation in statistics can be used in finance and investing. For example a correlation coefficient could be identified to determine the level of correlation between the price of crude oil and the stock price of an oil-producing company, such as Exxon Mobil Corporation. Since oil companies earn more profits as oil prices rise, the relationship between the two variables is highly positive.
2. OBJECTIVES
To study the Correlation Between
1. The male and female using mobile phones.
2. The age groups of various people using the mobile phone.
3. The study of network connection with respect to pre-paid and post- paid connections. 3. Methodology
The current study is based on primary data collected from 1305 respondents from the 8 localities of Chiplun. A well-structured questionnaire was designed to collect the information from the respondents. The questionnaire was designed to study perception towards usage of mobile phones. In this paper the correlation between the eight localities with respect to the above said objectives are measured. A total of 1305 people were made to participate in this survey. Only 1001of these people are using mobile phones and the remaining 304are non-users of cell phones because of their own reasons.
Fig.1 karl pearson product moment correlation
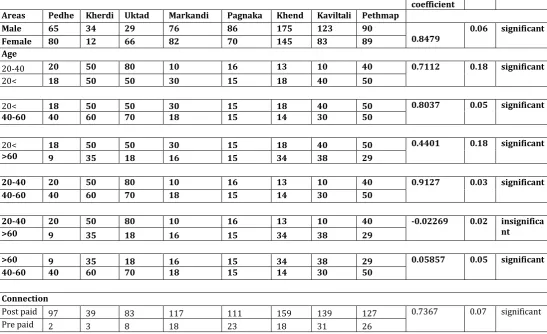
TABLE : AREA WISE AND AGE WISE DISTRIBUTION OF DATA
Gender Correlation
coefficient P.E. REMARK
Areas Pedhe Kherdi Uktad Markandi Pagnaka Khend Kaviltali Pethmap
Male 65 34 29 76 86 175 123 90
0.8479 0.06 significant
Female 80 12 66 82 70 145 83 89
Age
20-40 20 50 80 10 16 13 10 40 0.7112 0.18 significant
20< 18 50 50 30 15 18 40 50
20< 18 50 50 30 15 18 40 50 0.8037 0.05 significant
40-60 40 60 70 18 15 14 30 50
20< 18 50 50 30 15 18 40 50 0.4401 0.18 significant
>60 9 35 18 16 15 34 38 29
20-40 20 50 80 10 16 13 10 40 0.9127 0.03 significant
40-60 40 60 70 18 15 14 30 50
20-40 20 50 80 10 16 13 10 40 -0.02269 0.02 insignifica
nt
>60 9 35 18 16 15 34 38 29
>60 9 35 18 16 15 34 38 29 0.05857 0.05 significant
40-60 40 60 70 18 15 14 30 50
Connection
Post paid 97 39 83 117 111 159 139 127 0.7367 0.07 significant
[image:2.595.29.577.398.732.2]International Research Journal of Engineering and Technology
(IRJET)
e-ISSN: 2395-0056International Research Journal of Engineering and Technology
(IRJET)
e-ISSN: 2395-0056Volume: 07 Issue: 01 | Jan 2020 www.irjet.net p-ISSN: 2395-0072
Fig.2 : Area and age group wise distribution of data
4. Results
Correlation Coefficient
Measure the degree of relation
Understanding the economic behavior
Positive Correlation : when the values of variable moves in a same direction
Negative Correlation : when the values of variable moves in a opposite direction
There are several types of correlation coefficients, but the one that is most common is the Pearson correlation (r). This measures the strength and direction of the linear relationship between two variables. Correlation is a statistical tool for studying the relationship between two or more variables. Theory of correlation deals with the observation and measurement of the relationship between two or more statistical series. The study of correlation is very important from business and economic point of view.
Fig3. Types of correlation in bivariate data using scatter diagram
No correlation: If there is no linear correlation or a weak correlation than r is equal to 0. A value near r = 0 means that there is no relationship between the two variables.
Note that ris a dimensionless quantity; it does not depends on the units employed.
A perfect correlation (± 1) occurs only when the data points all lie exactly on a straight line. If r = positive (+1), the slope of this line is positive. If r = negative one(-1), the slope of this line is negative. A correlation greater than 0.8 is generally indicates that strong, whereas a correlation is less than 0.5 is generally described as weak. These values can vary based upon the 'type' of data being examined. A study utilizing scientific data that may required a stronger correlation than a study using social science data.
However, in real life situations, when the variables are random variables, the correlation coefficient does not equal the value 1 (+1 or -1). the value of correlation is nearly 1, means there is strong linear relationship and value nearing 0 indicates lack of linear relationship.
Thus the zero value of correlation coefficient does not imply that there is no relationship between the two variables or they are independent of each other. However, if two variables are independent of each other then the correlation coefficient is zero. There is interesting feature about interpretation of the low/high values of correlation and the extent of linear relationship. If the correlation coefficient is less than the probable error then there is no evidence of relationship between the variables i.e., there is no significant relationship between the variables.
Significant relationship exists only when correlation coefficient is greater than 0.8.
Regarding the mobile phone users, the correlation between the males and females is 0.8479, shown that there is a very high degree of correlation between the males and female.
With respect to age groups concern, the age groups 20-40 and 40-60 show a highest degree of correlation of mobile users which is 0.9127. And the 0.7112 between the age groups less than 20 and 20-40. The least is found with less than 20 years and greater than 60 years age group. It is shown in the table 1, and from figure1, we observe that the correlation between the age group 20-40 and 40-60 is highly significant and there is a positive correlation between them.
The correlation between the prepaid and post- paid connections is 0.7367. The major approximately around 85% of mobile users are pre-paid customer.
5. CONCLUSIONS
The analysis of correlation is of immense use in practical life. Correlation measures the degree or strength of the linear relationship between the variables. With the help of correlation analysis one can identify the direction or nature of relationship between variables. With this analysis, we can measure the magnitude or degree of relationship existing between the variables. Cell phone is being widely used for many valid reasons.
The usage of it varies from one age group to the other. Study has proved that majority of users are men.
International Research Journal of Engineering and Technology
(IRJET)
e-ISSN: 2395-0056Volume: 07 Issue: 01 | Jan 2020 www.irjet.net p-ISSN: 2395-0072
REFERENCES
Singh Fulbag and Sharma Reema(2007),”Cellular Services and Consumer Buying Behaviour in Amritsar City ,The IUP Journel of Consumer Behaviour ,Vol.2,No.3,PP.39-51.
L. M. S. D. Souza, H. Vogt and M. Beigl, “A survey on fault tolerance in wireless sensor networks”,2007.
T.N. Srivastava, ShailajaRego “ Statistics for Management” – Tata McGraw-Hill
I.F. Akyildiz, W. Su, Y. Sankarasubramaniam and E. Cayirci, "A Survey on Sensor Networks", IEEE . Communications Magazine, pp. 102--114, August 2002.
BIOGRAPHIES